> Environmental studies
09
07
> Air
> Critical Loads of Acidity
for Alpine Lakes
A weathering rate calculation model and the generalized First-order
Acidity Balance (FAB) model applied to Alpine lake catchments
> Environmental studies
> Air
> Critical Loads of Acidity
for Alpine Lakes
A weathering rate calculation model and the generalized First-order
Acidity Balance (FAB) model applied to Alpine lake catchments
Published by the Federal Office for the Environment FOEN
Bern, 2007
Impressum
Editor
Federal Office for the Environment (FOEN)
FOEN is an agency of the Federal Department of Environment,
Transport, Energy and Communications (DETEC).
Authors
Maximilian Posch
Urs Eggenberger
Daniel Kurz
Beat Rihm
CCE, MNP, Bilthoven/NL
Institute of Geological Sciences, University of
Bern
EKG Geo-Science, Bern
METEOTEST, Bern
FOEN Consultant
Beat Achermann, Air Pollution Control and Non-Ionizing Radiation
Division
Suggested Form of Citation
Posch M., Eggenberger U., Kurz D., Rihm B. 2007: Critical Loads of
Acidity for Alpine Lakes. A weathering rate calculation model and the
generalized First-order Acidity Balance (FAB) model applied to Alpine
lake catchments. Environmental studies no. 0709. Federal Office for
the Environment, Berne. 69 S.
Layout
Dominik Eggli, METEOTEST, Bern
Cover Picture
Chiara Pradella, Lago di Tomè
Downloadable PDF file
www.environment-switzerland.ch/uw-0709-e
(no printed version available)
Code: UW-0709-E
© FOEN 2007
3
> Table of Contents
Table of Contents
Abstracts
Preface
Summary
5
7
8
1
Background
10
2
2.1
2.2
14
14
2.4
2.4.1
2.4.2
2.4.3
2.4.4
Methods
Procedure Overview
Generalisation of the First-order Acidity Balance
(FAB) model
Model derivation
Input data requirements
The Steady-State Water Chemistry (SSWC)
model
Calculation of Weathering Rates for Catchments
Introduction
Calibration of Hydrology
Calibration of the Reactive Transport of Ions
Transfer Functions for the Regional Application
3
3.1
3.2
3.3
3.4
3.5
Input Data
Deposition Rates
Runoff
Weathering Rates
Terrestrial Sinks of Nitrogen and Base Cations
In-lake Retention
42
42
45
47
50
51
4
Results and Discussion
52
5
Concluding Remarks
58
2.2.1
2.2.2
2.3
Acknowledgements
18
18
23
24
26
26
26
34
39
59
Annexes
A1 List of Lakes
A2 FORTRAN subroutine genFAB
60
60
63
Indexes
Glossary
Figures
Tables
References
66
66
66
67
68
5
> Abstracts
> Abstracts
In alpine lakes in Southern Switzerland acid deposition is a problem due to slowweathering bedrocks and thin soils. Earlier assessments of critical loads of acidity for
these lakes with the Simple Mass Balance (SMB) model and the Steady-State Water
Chemistry (SSWC) model led to different results, due to differences in quantifying the
weathering of base cations (BC). In this study, a hydrological model was used to
quantify the typical groundwater flow through the prevalent bedrock types. A reactive
transport model supplied information for estimating the average weathering rates for
five lithological classes of bedrock, which are the dominating source of base cations in
these catchments. For calculating the critical loads for sulphur and acidifying nitrogen a
generalised version of the First-order Acidity Balance (FAB) model was derived, in
which BC leaching is explicitly formulated in terms of sources and sinks in the catchment. The generalised FAB model was applied to 100 catchments. The resulting critical loads were compared with the outcome of the SSWC model, which was applicable
to 19 lakes for which water-chemistry measurements are available. Overall, the new
methodology for calculating critical loads has the advantage of being more processoriented, differentiating better between catchments, and allowing the comparison with
S and N depositions. The atmospheric depositions were modelled for 1980, 1995 and
2010. The percentage of lakes protected (i.e. critical loads are not exceeded) increases
from 46 % in 1980 via 57 % in 1995 to 73 % in 2010.
Keywords:
In alpinen Seen der Südschweiz stellen saure Niederschläge wegen des langsam verwitternden Muttergesteins und der dünnen Böden ein Problem dar. Frühere Berechnungen
kritischer Eintragsgrenzen (critical loads, CL) für Säure mit der Simple Mass Balance
(SMB) und dem Steady-State Water Chemistry (SSWC) Modell führten zu verschiedenen Ergebnissen, da die Verwitterung basischer Kationen (BC) unterschiedlich
behandelt wurde. In dieser Studie wurde ein hydrologisches Modell für die Quantifizierung typischer Grundwasserflüsse im Felsuntergrund eingesetzt. Ein reaktives Transportmodell lieferte Abschätzungen der durchschnittlichen Verwitterungsraten für fünf
Lithologieklassen, der Hauptquelle von BC in diesen Seen. Zur Berechnung von CL
wurde eine verallgemeinerte Version des First-order Acidity Balance (FAB) Modells
entwickelt. Dabei wird die BC-Auswaschung explizit als Funktion von Quellen und
Senken im Einzugsgebiet formuliert. Das generalisierte FAB Modell wurde auf 100
Seen angewandt. Die resultierenden CL wurden mit dem Ergebnis des SSWC Modells
verglichen, welches in 19 Seen mit Wasserchemie-Messungen eingesetzt werden
konnte. Insgesamt ist die neue Methode zur Berechnung von CL mehr prozessorientiert, differenziert besser zwischen den Einzugsgebieten und erlaubt den Vergleich
mit S- und N-Einträgen. Die atmosphärischen Einträge wurden für die Jahre 1980,
1995 und 2010 modelliert. Der Anteil der geschützten Seen, in welchen die CL nicht
überschritten werden, stieg von 46% (1980) auf 57% (1995) und auf 73% (2010).
Stichwörter:
alpine lakes
acid deposition
critical loads of acidity
lithology
base cations
weathering
FAB model
alpine Bergseen
saure Niederschläge
kritische Eintragsraten
Lithologie
basische Kationen
Verwitterung
FAB Modell
6
Critical Loads of Acidity for Alpine Lakes FOEN 2007
Les pluies acides constituent un problème dans les lacs alpins du sud de la Suisse,
parce qu’elles altèrent lentement le substratum rocheux et que les sols y ont une faible
épaisseur. Les charges critiques d’acidité (critical loads, CL) calculées autrefois en
appliquant un bilan massique simple (simple mass balance / SMB) et le modèle de
chimie des eaux à l’état d’équilibre (steady-state water chemistry / SSWC) divergeaient
car l’altération des cations basiques était traitée différemment. La présente étude met en
œuvre un modèle hydrologique servant à quantifier des écoulements typiques à
l’intérieur du soubassement rocheux. Un modèle de transport réactif a permis d’estimer
les taux moyens d’altération pour les cinq classes lithologiques fournissant le plus de
cations basiques aux lacs étudiés. Une version généralisée du modèle du bilan d'acidité
du premier ordre (first-order acidity balance / FAB) a été développée pour calculer les
charges critiques. Le lessivage des cations basiques y est exprimé explicitement en
termes de sources et de puits présents dans le bassin versant. Le modèle généralisé a été
mis en œuvre sur 100 captages. Les charges critiques en résultant ont été comparées
avec les résultats du modèle SSWC, qui a pu être appliqué à 19 lacs pour lesquels on
disposait de mesures hydrochimiques. Dans l’ensemble, la nouvelle méthode de calcul
des charges critiques est axée davantage sur les processus, différencie mieux les bassins
versants et permet d’opérer des comparaisons avec les dépôts soufrés et azotés. Les
dépôts atmosphériques ont été modélisés pour les années 1980, 1995 et 2010. La
proportion de lacs protégés, où les charges critiques n’ont pas été dépassées, est passée
de 46 % en 1980 à 57 % en 1995, pour atteindre 73 % en 2010.
Nei laghi alpini della Svizzera meridionale le piogge acide costituiscono un problema,
a causa della roccia madre degradabile solo lentamente e del sottile strato di suolo. In
passato, il calcolo dei carichi critici di acidità (critical loads, CL) con il metodo SMB
(Simple Mass Bilance) e il modello SSWC (Steady-State Water Chemistry) ha prodotto
risultati discordanti, riconducibili a differenze nella quantificazione del rilascio di
cationi basici dalla roccia madre durante il suo degrado. In questo studio, è stato utilizzato un modello idrologico per quantificare i flussi tipici delle acque sotterranee attraverso i principali substrati rocciosi. Grazie ad un modello di trasporto reattivo, è stato
possibile stimare un tasso di degrado medio per cinque classi litologiche, le quali
rappresentano la principale fonte di cationi basici nel bacino imbrifero. Per calcolare i
carichi critici di zolfo e di azoto acidifiante è stata sviluppata una versione generalizzata del modello FAB (First-order Acidity Balance), in cui il dilavamento di cationi
basici viene esplicitamente formulato come una funzione della loro produzione ed
eliminazione. I risultati ottenuti dall’applicazione di tale modello su 100 laghi sono
stati confrontati con quelli derivanti dal modello SSWC, quest’ultimo applicato a 19
laghi per i quali erano disponibili misurazioni idrochimiche. Nel complesso, il nuovo
metodo di calcolo dei carichi critici a il vantaggio di essere più incentrato sui processi
differenziando meglio i singoli bacini imbriferi e permettendo un confronto con gli
apporti di zolfo e di azoto. Gli apporti di inquinanti atmosferici sono stati modelizzati
per gli anni 1980, 1995 e 2010. La percentuale dei laghi protetti, in cui i carichi critici
non vengono superati, aumenta dal 46 per cento (1980) al 57 per cento (1995) e al 73
per cento (2010).
Mots-clés :
lacs alpins
pluies acides
charges critiques d’acidité
lithologie
cations basiques
altération
modèle FAB
Parole chiave:
laghi alpini
piogge acide
carichi critici di acidità
litologia
cationi basici
alterazione
modello FAB
> Preface
> Preface
Critical loads play an important role within the Convention on Long-range Transboundary Air Pollution (UNECE) and its Protocols on Further Reduction of Sulphur
Emissions (Oslo Protocol, 1994) and to Abate Acidification, Eutrophication and
Ground-level Ozone (Gothenburg Protocol, 1999). Critical loads, defined as “a quantitative estimate of an exposure to one or more pollutants below which significant harmful effects on specified sensitive elements of the environment do not occur according to
present knowledge”, are the scientific rationale for the development of effects-based air
pollution control strategies.
For the preparation of the above mentioned Oslo and Gothenburg Protocols, Switzerland applied the so-called “Steady-state (Simple) Mass Balance” approach to calculate
critical loads of acidity for alpine lakes and forest ecosystems as proposed at that time
in the Convention’s Manual on “Methodologies and Criteria for Mapping Critical
Levels/Loads and Geographical Areas where they are Exceeded”. Since the Modelling
and Mapping Programme under the Convention now requires the development of
critical load functions of acidifying sulphur and nitrogen, the method of choice is the
“First-order Acidity Balance” (FAB) model. In cooperation with the Coordination
Centre for Effects (CCE) a generalized version of the FAB model was developed,
allowing the calculation of critical load functions by taking entire lake catchment
properties into account. In addition, substantial improvements could be made in quantifying the weathering of base cations in catchments. Overall, the new methodology for
calculating critical loads has the advantage of being more process-oriented, differentiating better between catchments and allowing the comparison with sulphur and nitrogen deposition. The results of the application of the improved weathering rate determination and the generalized FAB model to 100 lake catchments are now part of the
Swiss critical loads data set in use for the review of the Gothenburg Protocol.
We express our warm thanks to the Coordination Centre for Effects for its support in
deriving the generalized FAB model and to all scientists and engineers being involved
in the revision of the Swiss data set on critical loads of acidity for alpine lakes.
Martin Schiess
Head of the Air Pollution Control and Non-Ionizing Radiation Division
Federal Office for the Environment (FOEN)
7
Critical Loads of Acidity for Alpine Lakes FOEN 2007
> Summary
Acidification of surface waters as a result of deposition of acidifying air pollutants,
mainly sulphur and nitrogen, has primarily been witnessed in northern Europe and
North America. The release of base cations (BC = Ca2+ + Mg2+ + K+ + Na+) from
minerals in the soil and bedrock due to weathering is the major long-term acidity
buffering process. Surface waters in central Europe are often buffered by ubiquitous
carbonate bedrock. Among the exceptions are high-alpine lakes and rivers of the Lago
Maggiore catchment area, which lies half in Southern Switzerland. The bedrock of this
region consists of slow-weathering crystalline basement nappes.
Sensitive ecosystems regarding acidification became important when acidification was
perceived as a consequence of transboundary air pollution within the scope of the
UNECE Convention on Long-range Transboundary Air Pollution (LRTAP). Effect and
pollutant deposition were linked via the critical load which was defined as «a quantitative estimate of an exposure to one or more pollutants below which significant harmful
effects on specified sensitive elements of the environment do not occur according to
present knowledge”.
Earlier assessments of critical loads of acidity (CL(A)) for alpine lakes in southern
Switzerland with the Simple Mass Balance (SMB) model and the Steady-State Water
Chemistry (SSWC) model led to substantially different results. The discrepancies were
clearly related to differences in the weathering rates (BCw), independently derived from
soil and geological information with the SMB and back-calculated from present-day
water chemistry with the SSWC. Therefore, this study aims at (1) improving the derivation of weathering rates from catchment properties, (2) developing a more appropriate calculation model instead of the SMB model and (3) applying that model on a
regional scale in order to provide more reliable critical loads for Swiss alpine lakes:
(1) A detailed study of two lakes involving models for hydrology (groundwater flow)
and reactive transport (rock-water interaction) supplies the quantitative information to
develop so-called transfer functions. The transfer functions can be used to calculate the
average BC weathering of a catchment based on maps and data, which are available on
a regional scale, i.e. geological maps, terrain and precipitation data. The units of the
geological maps are aggregated to five lithological classes (carbonate bearing rocks,
amphibolite, melanocratic granite/gneiss, leucocratic granite/gneiss and quaternary
cover). Terrain data are used for calculating hydraulic gradients of the assumed flow
paths within the bedrock. The weathering contributed from the marginal soils found in
these steep alpine catchments was assumed to be negligible in comparison with the
release of base cations to the groundwater percolating the bedrock.
(2) Since the Mapping Programme under the LRTAP Convention requests critical
loads for sulphur, CLmax(S) and acidifying nitrogen, (CLmax(N)), the model of choice is
the First-order Acidity Balance (FAB) model. For this study, a generalised version of
8
> Summary
the FAB model has been derived. It differs from the previously published version of
FAB in the following points: Base cation leaching is explicitly formulated in terms of
sources and sinks in the catchment (deposition, weathering and removal due to uptake
by vegetation etc.), instead of plugging in the SSWC model. The number of sub-areas
(e.g., land cover classes) in the catchment, for which different fluxes can be specified,
is now unrestricted. Individual depositions to different sub-areas of the catchment can
be taken into account.
(3) In the regional application in Southern Switzerland input data for the transfer
functions and for the generalised FAB model are compiled and critical loads are calculated for 100 lake catchments. The lakes are situated between 1650 and 2700 m altitude. The mean lake area is 4 ha and the mean catchment area is 87 ha. The lithology is
dominated by granite/gneiss. Carbonate bearing rocks occur in only 20 % of the catchments. Precipitation amounts are in the range of 1.6–2.4 m a-1. The dominating landuse type is bare land (rocks, gravel, glaciers). Grassland covers 35 % of the catchments
on the average, and only 2 % is covered by forests.
In the 100 lakes, the median value of the resulting weathering rates (BCw) is 596 eq haa-1. The median values for CLmax(S) and CLmax(N) are 570 and 800 eq ha-1 a-1, respectively.
1
The atmospheric deposition of base cations, N and S is calculated with a generalised
combined approach for the year 1995. The approach is based on measurements of wet
deposition and on emission inventories combined with statistical dispersion models to
calculate dry deposition. In the considered catchments, dry deposition contributes only
a small part to the total deposition (< 20 %). Using EMEP-results, the 1995 deposition
values were rescaled to the years 1980 and 2010. In this period, the emissions and
depositions, especially of sulphur, changed substantially, and consequently also the
exceedances of the critical loads. The percentage of lakes protected (i.e. non-exceeded)
increases from 46 % in 1980 via 57 % in 1995 to 73 % in 2010.
For 19 lakes with available water chemistry measurements, also the SSWC model is
applied. A comparison of the CL(A) values resulting from the SSWC model with the
values for CLmax(S) obtained with the FAB model shows that the SSWC critical loads
are generally higher. The divergence must be explainable by the difference in base
cation inputs to the catchment (deposition, weathering, uptake), which is used in the
generalised FAB model, and the observed base cation flux leaving the lake, which
determines the results of the SSWC model. The measured flux of base cations leaving
the lake is for about half of the catchments considerably larger than the modelled net
input. Also in the balances of input-output fluxes for S and N biases can be observed.
Although possible reasons for the differences were identified, these discrepancies
warrant further investigations.
Overall, the new methodology for calculating critical loads for lakes, the generalised
FAB model, has the advantage of (a) being more process-oriented and thus easier to
modify or improve, (b) differentiating better between catchments, and (c) allowing the
comparison with S and N depositions.
9
Critical Loads of Acidity for Alpine Lakes FOEN 2007
1 > Background
1.1
Introduction
Wide-spread acidification of surface waters as a result of deposition of acidifying air
pollutants has primarily been witnessed in northern Europe and North America. The main
reasons for the susceptibility to acidification of these areas are the climate and the bedrock. Low average annual air temperatures and the predominance of acid silicate mineralogy impair soil formation, and consequently lead to low weathering rates. The release of
base cations from minerals in the soil due to weathering is the major long-term acidity
buffering process. Unlike in northern Europe, surface waters in central Europe are often
buffered by ubiquitous carbonate bedrock. Among the exceptions are high-alpine lakes
and rivers of the Lago Maggiore catchment area, which lies half in north-western Italy
and half in Southern Switzerland. The bedrock of this area consists of crystalline basement nappes with varied ortho- and paragneiss dominating. This particular geological and
climatic environment implies that the sensitivity of headwater lakes and streams above
the timberline should be comparable to that of Nordic lake catchments.
Sensitive ecosystems regarding acidification became important when acidification was
perceived as a consequence of transboundary air pollution and effect related abatement of
transboundary air pollution was adopted within the scope of the 1979 Convention on
Long-range Transboundary Air Pollution (LRTAP) involving the territory of the United
Nations Economic Commission for Europe (UNECE). Effect and pollutant exposure were
linked via the critical load which was defined as «a quantitative estimate of an exposure
to one or more pollutants below which significant harmful effects on specified sensitive
elements of the environment do not occur according to present knowledge» (Nilsson and
Grennfelt 1988). The concept was used since the early 1990’s to produce European maps
of critical sulphur deposition, which became the basis in the development of sulphur
emission reduction scenarios used in the negotiations of the Second Sulphur Protocol
(UNECE 1994).
1.2
Earlier Assessments
Switzerland participated in this work by compiling critical loads of acidity and sulphur
for Swiss terrestrial (forest soils) and aquatic (Alpine lakes) ecosystems (FOEFL 1994).
At that time, with respect to the data available in Switzerland and in agreement with
procedures recommended in the mapping manual, critical loads were calculated with a
simplified steady state mass balance method (SMB, Hettelingh et al. 1991). In Switzerland, also surface water critical loads were assessed with the SMB model, which allowed
10
1
11
> Background
considering all potentially sensitive lake catchments covering a total catchment area of
600 km².
The critical load of actual acidity, CL(A), was calculated as:
(1.1)
CL( A) = BC w,C − ANC le ,crit
where the average base cation weathering rate of the catchment BCw,C (in eq m-2 a-1) was
derived from:
(1.2)
BC w,C = BC w,class ⋅ d C ⋅ 10
⎛1 1 ⎞
− 3800 ⎜ −
⎟
⎝ T 283 ⎠
and the critical leaching of acid neutralizing capacity ANCle,crit (in eq m–2 a–1) was obtained by multiplying the annual average runoff rate Q (in m a–1) with the critical ANC
concentration in the runoff water (set at 0.02 eq m–3). BCw,class (in eq m–3 a–1) in the above
equation refers to soil type specific weathering rate classes taken from Hettelingh and De
Vries (1991). Class averages were allocated to the soil types found in the 1:500,000 soil
map of Switzerland (swisstopo 1984). dC (in m) refers to the annual average hydrologically active soil depth in the catchment (set to 1 m), and T (in K) is the annual mean soil
temperature at a depth of 0.2 m.
Due to inherent problems in directly assessing catchment weathering rates, the generally
used method to map critical loads of acidity for surface waters was at that time, however,
the Steady-State Water Chemistry (SSWC) model (Henriksen et al. 1990; Brakke et al.
1990; see also Chapter 2.3). The SSWC model was developed and widely applied in the
Nordic countries, where the required input was available. With the SSWC model, the
critical load of acidity can be derived from annual mean present-day water chemistry,
assuming all sulphate in the runoff to originate from sea-salt spray and anthropogenic
deposition. Basically, the acid load should not exceed the pristine, non-marine, nonanthropogenic base cation runoff (flux) from the catchment minus a buffer ([ANC]limit) to
protect selected biota from being damaged:
(1.3)
CL( A) = Q⋅ ([ BC * ]0 − [ ANC ]limit )
It is assumed that the catchments were in steady-state regarding deposition inputs during
pre-industrial times. The difference between present ([BC*]t) and pristine ([BC*]0) concentration of base cations (BC=Ca+Mg+K+Na) in the surface water is related to the longterm changes in the concentration of strong acid anions by the so called F-factor:
(1.4)
[BC * ]0 = [BC * ]t − F ⋅ ([SO4* ]t − [SO4* ]0 + [NO3* ]t − [NO3* ]0 )
The F-factor and the historic non-marine sulphate concentration ([SO4*]0 ) are approximated with two empirical functions, both having originally been calibrated in Norway:
Critical Loads of Acidity for Alpine Lakes FOEN 2007
(1.5)
⎧sin π [BC * ] [S]) if [BC * ] < [S]
t
t
F = ⎨ (2
1
else
⎩
and
(1.6)
[ SO4* ]0 = min{[ SO4* ]t ,0.015 + 0.16 ⋅ [ BC * ]t }
where [S] = 0.4 eq m–3, assuming all concentrations in the above equations to be in this
unit. Non-marine pristine inorganic nitrate concentration (if nitrate was considered in the
calculation, see Figure 1) was set to zero.
The water chemistry of a series of lakes in the Southern Swiss Alps has irregularly been
surveyed since the early 1980s. This data allowed De Jong (1996) to calculate critical
loads of acidity for Swiss high-alpine catchments using the SSWC method. The basic
findings of this study, i.e. substantial differences between critical load estimates generated
with the SMB method and the SSWC method, respectively, could be substantiated (EKG
1997). The discrepancies were found to be clearly related to differences in the weathering
rates, independently derived from soil and geological information with the SMB and
back-calculated from present-day water chemistry with the SSWC. SMB weathering
rates, and consequently critical loads, were found to be without exception much lower
than SSWC estimates (Figure 1). Additionally, in the set of lakes considered, there was
practically no variation, i.e. SMB weathering rates were all around 360 eq ha–1 a–1. This
was considered to be primarily a result of the insufficient resolution of the data source
(soil map of Switzerland 1:500,000) used to derive the parent material units, from which
catchment weathering rates were calculated.
In view of other studies, e.g. Zobrist and Drewer (1990), SSWC estimates appeared to be
quite high with around 45 to 55 % of the weathering rates and around 30 to 40 % of the
critical acid loads above 1500 eq ha–1 a–1. Correction for an acidification-induced increase
of cation exchange was found to reduce critical loads of acidity by up to 24 % (difference
between the H90 and the B90 approach) and by up to 53 % (difference between the H93
and the B90 approach). Nonetheless, there was also some basic concern about a default
application of the (original) SSWC method to high-alpine catchments. Among the reasons
were (1) the importance of current lake water chemistry in the model, which is known to
vary annually and seasonally (A. Barbieri, pers. comm.) as well as with lake depth (LSA
1999), (2) the assumption that the catchments are at steady-state with respect to current
sulphur deposition, and (3) the assumption that the empirical functions derived in Norway
can be applied to alpine catchments.
12
1
> Background
13
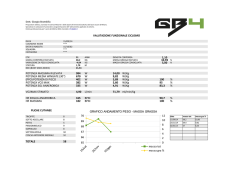
Figure 1 > Differences in the distribution of catchment weathering rates and critical loads of acidity of 45 high-alpine lakes in the Ticino area
(EKG, 1997).
Water chemistry data adopted from De Jong (1996). SMB results adopted from FOEFL (1994); H90: SSWC after Henriksen et al.
(1990) considering only sulphate as strong acid anion); B90: simplified SSWC after Brakke et al. (1990) with F=0 (i.e. using
present instead of pristine base cation concentration); H93: SSWC after Henriksen et al. (1993) considering both sulphate and
nitrate as strong acid anion (see Equation 1.4).
1.3
Aims of this Study
Considering these findings and the continual request for updated critical loads, it became
prudent to revise the methodology and database used to estimate surface waters critical
loads for Switzerland. Since regionalization is a crucial aspect in critical load calculations, and water chemistry is not available for all catchments of interest in the Ticino area,
focus was put on improving the methodology to directly estimate catchment weathering
rates from mapped catchment properties. Chapter 2.4 of this report describes the conceptual framework and the modelling approach used to calibrate mapped catchment units.
Since critical loads are now requested for sulphur and acidifying nitrogen, the model of
choice is the First-order Acidity Balance (FAB) model. Chapter 2.2 of the report explains
the changes needed in the FAB model to allow the use of independently estimated weathering rates. Chapters 3 and 4 discuss the input data used to do the critical loads calculations and the results obtained. Critical load functions for sulphur and nitrogen were
calculated for 100 sensitive lakes in the Ticino area, and the results were submitted to the
Coordination Centre for Effects (CCE) of the International Cooperative Programme on
Modelling & Mapping in response of the 2004 Call for Data.
14
Critical Loads of Acidity for Alpine Lakes FOEN 2007
2 > Methods
2.1
Procedure Overview
Under the Convention on LRTAP, all calculations and mapping of critical loads follow a
basic formal procedure (Table 1), which was outlined by Sverdrup et al. (1990). More
detailed and updated information about the single steps are compiled in the so called
UNECE Mapping Manual (UBA, 2004). Table 1 also summarises the main selections and
methodical decisions made in this study as well as references to the detailed descriptions
for each step.
Table 1 > Workflow for calculating and mapping critical loads.
formal procedure
selected procedure or item in this study
references
1. select receptor type
alpine lakes sensitive to acidification
chapter 1
2. quantify receptor distribution and
abundance
100 lake catchments in Southern Switzerland
chapter 2.1
3. determine biological indicator
(indicator organisms)
fish, invertebrate
UBA 2004
4. determine critical chemical value
that does not damage the selected
biota
Acid Neutralising Capacity (ANC) in lake water: [ANC]limit = 20
meq m–3
UBA 2004
5. select/develop computational
approaches
critical loads: generalized FAB (First-Order Acidity Balance) and
SSWC (Steady-state Water Chemistry) models; weathering
rates: simplified hydrology model and reactive transport model
chapter 2.2
and 2.3
chapter 2.4
6. collect required input data for each
receptor
deposition (N, S, BC) in 1980, 1995 and 2010, runoff, land use,
terrestrial BC and N sinks, catchment properties (land use,
lithological units, topographic parameters), water chemistry
measurements
chapter 3
7. conduct calculation of critical loads
and exceedance
FAB model for 100 lakes. SSWC model for 19 lakes where water
chemistry is available
8. produce maps/statistics
critical load functions, cumulative frequency distributions
chapter 4
9. check assumptions and quality
comparison of the results from FAB and SSWC, N and S
budgets
chapter 4
After Sverdrup et al. 1990
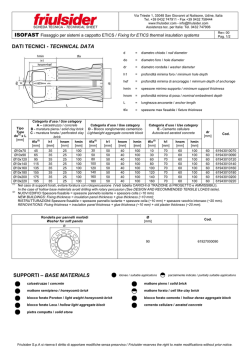
The occurrence and abundance of potentially sensitive lakes is determined in several
steps. First, all water surfaces were extracted from topographic maps within the region
shown in Figure 2. According to former studies (see Chapter 1), slow weathering bedrocks can be expected in this region, which covers the Northern part of the canton Ticino
and neighbouring areas of other cantons. Second, the Alpine lakes used in this study were
selected from the surface waters by meeting the following criteria:
2
15
> Methods
–
–
–
–
altitude is over 1500 m a.s.l.
lake area is greater than 0.5 ha
no storage lakes
large scale geological map (1:25’000) is available for the catchment
Finally, 100 lakes in Southern Switzerland were available for calculating critical loads
with the FAB-model (Figure 2, Table 17 in the Annex). They are located at altitudes
between 1650 and 2700 m (average 2200 m a.s.l.).
Figure 2 > Map of the 100 lakes modelled with genFAB. The 19 lakes with water chemistry measurements during
2000–2003 are shaded in blue color.
2
3
5
11
10
16
19
18
21 24
2526 23
31 205 2830
215
33
20 22 36
3537
38
220
44
217
46
204
201
47
48
49
51
203
54 55
57
218
214 216
60
202
64
65 219
67
707363
68 66
71
76
77
78
79
80
81 222
221
207
84
22388
224
92
206
9
12
17
27
15
4143
50
225
53
72
74
85
86
89
93
9495
20898
99
212
100
102
211
109210
110
209
106
101
213104
K606-01©2004 swisstopo
FAB-sites, ID
Monitoring 2000-03
EMEP 50x50 km, cell 70/38
0
5
10
km
rev. 14.9.2005
Critical Loads of Acidity for Alpine Lakes FOEN 2007
The indicator organisms (fish, invertebrate) and the critical chemical value (ANC concentration greater than 20 meq m–3) are selected following the recommendations in the
Mapping Manual (UBA 2004). Following a proposal of ICP-Waters (2000, p. 66) for
high altitude lakes, also a [ANC]limit of 30 meq m–3 was tested. However, the results were
less plausible, as critical loads became negative for several lakes.
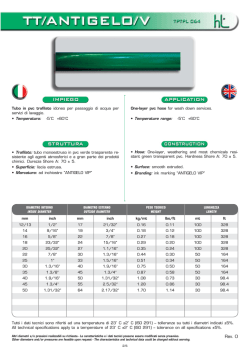
Figure 3 shows a flowchart of steps 5 to 7 of Table 1: A detailed study in two catchments
involved the calibration of models for hydrology (groundwater flow) and reactive transport (rock-water interaction). The rationale of this procedure is that soils in these catchments are very thin or even absent and therefore the main contribution of base cation
weathering does not come from soils but from groundwater percolating the bedrock.
As a main result, this ‘calibration’ study provided simplified transfer functions for calculating the average weathering rate of a catchment depending on five classes of lithology
and corresponding hydraulic gradients. The transfer functions are used in the regional
application to calculate the average weathering rates (BCw,C) in 100 catchments. Within
the catchments the lithology classes were derived from geological maps and the hydraulic
gradients were calculated from digital terrain data. BCw,C along with input maps related to
land-use, deposition, terrestrial sinks and runoff are compiled to apply the generalized
FAB model.
For 19 lakes, water chemistry measurements are available (Barbieri 2004, see Table 17 in
the annex), enabling the SSWC method to be applied as an alternative approach for
calculating critical loads.
16
2
17
> Methods
Figure 3 > Flowchart of the main procedural steps in this study.
Calibration Sites
(2 lakes)
calibration of hydrology:
travel times in different
lithologies
Measurements of Water Chemistry
(19 lakes)
Regional Application (100
lakes)
MODFLOW model
calibration of reactive transport:
composition of rockwater
MPATH model
simplifications for
the regional
application:
transfer functions
land-use,
deposition,
terrestrial sinks
input
maps
terrain,
lithology
precipitation,
runoff
weathering rates
for catchments
generalized FAB model
deposition model
SSWC
model
exceedances of
critical loads
The annual atmospheric depositions and resulting exceedances of the critical loads are
calculated for three years: 1980, 1995 and 2010. In this period, the emissions and deposition of sulphur and to a much lesser extent of nitrogen changed substantially, and consequently also the exceedances of the critical loads.
Critical Loads of Acidity for Alpine Lakes FOEN 2007
2.2
Generalisation of the First-order Acidity Balance (FAB) model
The original version of the FAB model has been developed and applied to lakes in
Finland, Norway and Sweden in Henriksen et al. (1993) and is also described in Posch et
al. (1997). A modified version was first reported in Hindar et al. (2000) and is fully
described in Henriksen and Posch (2001) as well as in Chapter 5.4 of the Mapping Manual (UBA 2004).
Here, a generalised version of the First-order Acidity Balance (FAB) model for calculating critical loads of sulphur (S) and nitrogen (N) for a lake is derived. It differs from the
previously published version of FAB in the following points:
– Base cation leaching is explicitly formulated in terms of its sources and sinks in the
catchment, i.e. deposition, weathering and removal due to uptake etc., instead of
plugging in the SSWC model, based on water chemistry data. This renders the FAB
model completely equivalent to the Simple Mass Balance (SMB) model for a soil
profile.
– The number of sub-areas (e.g., land cover classes) in the catchment, for which different fluxes can be specified, is now unrestricted.
– Individual depositions to different sub-areas of the catchment can be taken into account.
In addition, explicit formulae for computing the nodes of the critical load function are
given.
2.2.1
Model derivation
The lake and its catchment are assumed small enough to be properly characterised by
average soil and lake properties. The total catchment area (lake + terrestrial catchment) A
consists of the lake area Al =A0 and m different sub-areas Aj (j=1,…,m), comprising the
terrestrial catchment:
(2.1)
m
m
j =1
j =0
A = Al + ∑ A j = ∑ A j
E.g., A1 could be the forested area, A2 the area covered with grass or heathland, A3 the
area of bare rocks, etc. Also a subdivision along soil types could be useful.
Starting point for the derivation of the FAB model is the charge balance (‘acidity balance’) in the lake water running off the catchment:
(2.2)
S runoff + N runoff = ∑Y Yrunoff − ANCrunoff
18
2
19
> Methods
where ΣY stands for the sum of base cations minus chloride (Ca+Mg+K+Na–Cl), and
ANC is the acid neutralising capacity. In the above equation we assume that the quantities
are total amounts per time (e.g. eq a–1). To derive critical loads we have to link the ions in
the lake water to their depositions, taking into account their sources and sinks in the
terrestrial catchment and in the lake.
Mass balances in the lake are given by:
(2.3)
X runoff = X in − X ret ,
X = S , N , Ca, Mg , K , Na, Cl
where Xin is the total amount of ion X entering the lake and Xret the amount of X retained
in the lake. The in-lake retention is assumed to be proportional to the input of the respective ion into the lake:
(2.4)
X ret = ρ X ⋅ X in ,
X = S , N , Ca, Mg , K , Na, Cl
where 0 ≤ ρX ≤ 1 is a dimensionless retention factor. The mass balances then become:
(2.5)
X runoff = (1 − ρ X ) ⋅ X in ,
X = S , N , Ca, Mg , K , Na, Cl
The total amount of sulphur entering the lake is given by:
m
(2.6)
Sin = ∑ Aj ⋅ S dep , j
j =0
where Sdep,j is the total deposition of S per unit area onto land area j. Immobilisation,
reduction and uptake of sulphate in the terrestrial catchment are assumed negligible, and
sulphate ad/desorption need not be considered since we model steady-state processes
only. Equation 2.6 states that all sulphur deposited onto the catchment enters the lake, and
no sources or sinks are considered in the terrestrial catchment.
For nitrogen we assume that net uptake (= net removal), net immobilisation and denitrification can occur on all sub-areas, possibly at different rates. Thus the amount of N entering the lake is:
m
(2.7)
N in = ∑ A j ⋅ ( N dep , j − N i , j − N u , j − N de, j ) +
j =0
where Ndep,j is the total N deposition, Ni,j is the long-term net immobilisation of N (which
may include other long-term steady-state sources and sinks), Nu,j the net growth uptake of
N and Nde,j is N lost by denitrification, all per unit area for land area j. The symbol (x)+ or
x+ is a short-hand notation for max{x, 0}, i.e., x+= x for x > 0 and x+ = 0 for x ≤ 0. The
effects of nutrient cycling are ignored and the leaching of ammonium is considered
negligible, implying its complete uptake and/or nitrification in the terrestrial catchment.
20
Critical Loads of Acidity for Alpine Lakes FOEN 2007
Note that some of the terms in Equation 2.7 (other than deposition!) can be zero for
certain indices; especially for j=0, i.e. the lake itself, one mostly assumes Ni,0+Nu,0 = 0.
While immobilisation and net growth uptake are assumed independent of the N deposition, denitrification is modelled as fraction of the available N:
(2.8)
N de , j = f de, j ⋅ ( N dep , j − N i , j − N u , j ) +
for
j = 0,..., m
where 0 ≤ fde,j < 1 is the (soil-dependent) denitrification fraction for area j. The above
equation is based on the assumption that denitrification is a slower process than immobilisation and growth uptake. Inserting Equation 2.8 into Equation 2.7 one obtains:
m
(2.9)
N in = ∑ A j ⋅ (1 − f de, j ) ⋅ ( N dep , j − N i , j − N u , j ) +
j =0
For base cations and chloride the amount entering the lake is given by:
m
(2.10)
Yin = ∑ A j ⋅ (Ydep , j + Yw, j − Yu , j ) + , Y = Ca, Mg , K , Na, Cl
j =0
where Yw,j is the area weathering flux of ion Y for land cover class j.
Equation 2.10 highlights the conceptual difference to the standard FAB model (Henriksen
and Posch 2001): Base cation and chloride fluxes are not estimated from the lake water
chemistry, as in the SSWC model, but from individual (terrestrial) catchment fluxes. Such
an approach has also been tried by Rapp and Bishop (2003), using the PROFILE model
for estimating soil weathering rates in catchments.
To obtain an equation for critical loads, a link has to be established between a chemical
variable and effects on aquatic biota. The most commonly used criterion is the so-called
ANC-limit (see above), i.e. a minimum concentration of ANC derived to avoid ‘harmful
effects’ on fish: ANCrunoff,crit = A•Q•[ANC]limit, where Q is the catchment runoff. Other
criteria, e.g. a critical pH or Al concentration can be considered by calculating the critical
ANC concentration from it, as is done in the SMB model (see Chapter 5.3 of the Mapping
Manual).
Inserting Equations 2.6, 2.9 and 2.10 into Equation 2.5 and Equation 2.2 and dividing by
A yields the following equation to be fulfilled by critical depositions (loads) of S and N:
(2.11)
m
m
j =0
j =0
(1 − ρ S ) ⋅ ∑ c j ⋅ S dep , j + (1 − ρ N ) ⋅ ∑ c j ⋅ (1 − f de , j ) ⋅ ( N dep , j − N i , j − N u , j ) + = Lcrit
where we have defined the sub-area fractions cj:
2
21
> Methods
(2.12)
c j = Aj A
⇒
m
∑c
j =0
j
=1
where c0 = r is the lake:catchment ratio. Furthermore we introduced:
m
(2.13)
Lcrit = ∑Y (1 − ρY ) ⋅ ∑ c j ⋅ (Ydep , j + Yw, j − Yu , j ) + − Q ⋅ [ ANC ]limit
j =0
where the first sum is over the four base cations minus chloride (Ca+Mg+K+Na–Cl).
Note that in the standard FAB model (Henriksen and Posch 2001) Equation 2.13 reads
Lcrit=CL(A)=Q•([BC*]0–[ANC]limit). The depositions to the various sub-areas can be
written as:
(2.14)
S dep , j = s j ⋅ S dep
and
N dep , j = n j ⋅ N dep ,
j = 0,..., m
where Sdep and Ndep are catchment average depositions, and sj and nj dimensionless factors
describing the enhanced (or reduced) deposition onto sub-area j. Inserting them into
Equation 2.11 yields:
(2.15)
m
⎛
N + Nu, j
aS ⋅ S dep + (1 − ρ N ) ⋅ ∑ c j ⋅ (1 − f de , j ) ⋅ n j ⋅ ⎜ N dep − i , j
⎜
nj
j =0
⎝
⎞
⎟ = Lcrit
⎟
⎠+
with the dimensionless parameter:
m
(2.16)
a S = (1 − ρ S ) ⋅ ∑ c j ⋅ s j
j =0
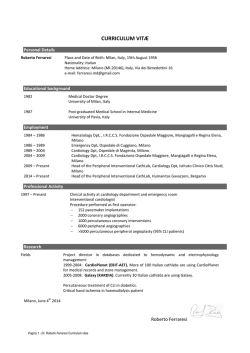
Equation 2.15 defines a function in the (Ndep, Sdep)-plane, the so-called critical load
function (see Figure 4) and in the following we look at this function in more detail. We
assume that the sub-areas are enumerated in such a way that
(2.17)
N j −1 = ( N i , j −1 + N u , j −1 ) n j −1 ≤ ( N i , j + N u , j ) n j = N j
for
j = 1,..., m
Between two successive values of Nj the critical load function is linear, but at Nj it
changes the slope (another of the large brackets in Equation 2.15 becomes non-zero). The
resulting piecewise linear function has (at most) m+2 segments, and every segment is of
the form:
(2.18)
aS ⋅ S dep + aN , k ⋅ N dep = LN , k + Lcrit
for
N k −1 ≤ N dep ≤ N k , k = 0,..., m + 1
22
Critical Loads of Acidity for Alpine Lakes FOEN 2007
with (by definition) N 1=0 and Nm+1=∞. In Equation 2.18 we introduced the dimensionless parameters:
k −1
(2.19)
a N ,0 = 0 , a N , k = (1 − ρ N ) ⋅ ∑ c j ⋅ (1 − f de, j ) ⋅ n j , k = 1,..., m + 1
j =0
and the terms:
k −1
(2.20)
LN ,0 = 0 , LN , k = (1 − ρ N ) ⋅ ∑ c j ⋅ (1 − f de, j ) ⋅ ( N i , j + N u , j ) , k = 1,..., m + 1
j =0
The maximum critical load of sulphur is obtained by setting Ndep = 0 in Equation 2.15:
(2.21)
CLmax ( S ) = Lcrit aS
To compute the maximum critical load of nitrogen one has to find the segment of the
critical load function, which intersects the horizontal axis. The first segment is horizontal
(since aN,0=0), and this segment extends till Ndep=N0=(Ni,0+Nu,0)/n0 (see Equation 2.17).
Each of the following (at most) m+1 straight lines defined in Equation 2.18 intersects the
horizontal axis at (setting Sdep = 0):
(2.22)
N 0,k = ( LN ,k + Lcrit ) a N ,k , k = 1,..., m + 1
And the N0,k which lies between the limits defined in Equation 2.17 defines the maximum
critical load for nitrogen. Denoting this specific index with K (1≤K≤m+1), we have:
(2.23)
CLmax ( N ) = N 0, K = ( LN ,K + Lcrit ) a N , K
where
N K −1 < N 0, K ≤ N K
The first node of the critical load function is (0,CLmax(S)), the second one (N0,CLmax(S)).
Note that in most applications uptake and immobilisation in the lake is assumed zero, i.e.
N0=0, and thus the second node coincides with the first. The next (maximum) K–1 nodes
of this piecewise linear function are given by (Nk,Sk), where Nk is defined in Equation
2.17 and the Sk are obtained as:
(2.24)
S k = a N ,k ⋅ ( N 0,k − N k ) aS , k = 1,..., K − 1
And the last, at most (K+2)-nd, node is given by (CLmax(N),0).
A Fortran subroutine to calculate the nodes of the critical load function for given catchment characteristics can be found in Annex A.2.
2
> Methods
Figure 4 > Piece-wise linear critical load function of S and acidifying N for a lake as defined by catchment
properties.
Here shown for two land use classes characterised by (N1,S1) and (N2,S2) (see eqs.17 and 24).
The grey area below the CL function denotes deposition pairs resulting in an ANC leaching
greater than Q•[ANC]limit (non-exceedance of critical loads). The critical load exceedance is
calculated by adding the N and S deposition reductions needed to reach the critical load
function via the shortest path (E→Z): Ex = ΔS+ΔN.
2.2.2
Input data requirements
The generalised FAB model needs information on (a) the runoff, (b) the area of lake,
catchment and different sub-areas, (c) terrestrial base cation and nitrogen sources and
sinks, and (d) parameters for in-lake retention of N, S and base cations.
a) Runoff:
The runoff Q is the amount of water leaving the catchment at the lake outlet, expressed in
m a-1. It is derived from measurements or can be calculated as the difference between
precipitation and actual evapotranspiration, averaged over the catchment area, if there are
no net losses to the groundwater. A long-term climatic mean annual value should be
taken.
b) Lake and catchment characteristics:
The area parameters Aj (j=0,…, m) can generally be derived from (digital) maps.
c) Terrestrial sources and sinks of BC and N:
These parameters can be derived the same way as for the SMB model.
23
Critical Loads of Acidity for Alpine Lakes FOEN 2007
The net uptake of base cations and N can be computed from the annual average amount of
N in the harvested biomass. If there is no removal of trees or by grazing animals, Nu = 0.
Ni is the long-term annual immobilisation (accumulation) rate of N for sustainable soil
formation in the catchment. Note that at present, immobilisation may be substantially
higher due to elevated N deposition.
The denitrification fraction fde depends on the soil type and its moisture status.
d) In-lake retention:
Concerning in-lake processes, the retention factor for nitrogen ρN (see Equation 2.4) is
modelled by a kinetic equation (Kelly et al. 1987) included in the FAB model:
(2.25)
ρN =
sN
sN
=
sN + z /τ sN + Q / r
where z is the mean lake depth, τ is the lake’s residence time, r=c0 is the lake:catchment
ratio (see Equation 2.12) and sN is the net mass transfer coefficient. There is a lack of
observational data for the mass transfer coefficients, especially from European catchments, but Dillon and Molot (1990) give a range of 2–8 m a–1 for sN. Values for Canadian
and Norwegian catchments are given in Kaste and Dillon (2003).
Alternative methods for calculating the in-lake retention of nitrogen might be evaluated
on the basis of monitoring data compiled by Steingruber (2001, page 77), which imply
that independent of depth and residence time the nitrogen retention in lake is mainly
determined by its areal nitrogen load.
An equation analogous Equation 2.25 for ρS, with a mass transfer coefficient sS, is used to
model the in-lake retention of sulphur. Baker and Brezonik (1988) give a range of 0.2–0.8
m a–1 for sS. For ρBC no data is available.
2.3
The Steady-State Water Chemistry (SSWC) model
The ‘classic’ model for calculation the critical load of acidity for a lake or stream is the
SSWC (or ‘Henriksen’) model, which uses (estimated) annual mean values of present-day
water chemistry. A derivation of the SSWC model, including many of its variants, and
references to the original literature can be found in Chapter 5.4 of the Mapping Manual
(UBA 2004). Here we simply summarise the model equations used in this study.
In the SSWC model the critical load of acidity, CL(A), is calculated from the principle
that the acid load should not exceed the non-marine, non-anthropogenic base cation input
24
2
25
> Methods
and sources and sinks in the catchment minus a buffer to protect selected biota from being
damaged. This critical load is given by:
(2.26)
CL( A) = Q ⋅ ([ BC * ]0 − [ ANC ]limit )
where Q is the catchment runoff (in m a-1), [BC*]0 (BC=Ca+Mg+K+Na) is the preacidification concentration of base cations, and [ANC]limit the lowest ANC-concentration
that does not damage the selected biota. The star indicates sea salt correction; however,
no such correction has been applied to the data for the Swiss lakes.
The pre-acidification base cation concentration is calculated with the help of the so-called
F-factor from:
(2.27)
(
[ BC ∗ ]0 = [ BC ∗ ] − F ⋅ [ SO4* ] − [ SO4* ]0 + [ NO3 ] − [ NO3 ]0
)
where [SO4] and [NO3] are the present-day concentrations of sulphate and nitrate and the
subscript zero indicates their pre-acidification values. The pre-acidification nitrate concentration is generally assumed zero.
Viewing Equation 2.27 as a definition for the F-factor, it shows that it is the rate of
change in non-marine base cation concentrations due to changes in strong acid anion
concentrations. If F=1, all incoming protons are neutralised in the catchment (only soil
acidification), at F=0 none of the incoming protons are neutralised in the catchment (only
water acidification). The F-factor was estimated empirically to be in the range 0.2–0.4,
based on the analysis of historical data from Norway, Sweden, U.S.A. and Canada (Henriksen 1984). Brakke et al. (1990) later suggested that the F-factor should be a function of
the base cation concentration:
(2.28)
(
)
F = sin π2 [ BC * ] [ S ]
where [S] is the base cation concentration at which F=1; and for [BC*]>[S] F is set to 1.
The traditional value of [S]=400 meq m–3 (ca. 8 mg Ca L–1) is used here.
The pre-acidification sulphate concentration in lakes, [SO4*]0, is assumed to consist of a
constant atmospheric contribution and a geologic contribution proportional to the concentration of base cations:
(2.29)
[ SO4* ]0 = a + b ⋅ [ BC * ]
Following Henriksen and Posch (2001), a=0.008 eq m–3 and b=0.17 are used here, as well
as a critical ANC-limit of 20 meq m–3.
Critical Loads of Acidity for Alpine Lakes FOEN 2007
2.4
Calculation of Weathering Rates for Catchments
2.4.1
Introduction
The in-soil weathering rates are very low in those catchments because of very thin soils,
low temperature and in many cases slow weathering minerals. Therefore, the weathering
rates of base cations (BCw ; BC = Ca2+ + Mg2+ + K+ + Na+) for each catchment were
estimated by quantifying rock-water interaction processes also through groundwater
recharge using a simplified hydrological model.
The geology of the catchments was digitized using regional geological maps and was
simplified by classifying it into 5 lithological units: quaternary cover, leucocratic granite/gneiss, melanocratic granite/gneiss, amphibolite, and carbonate bearing rocks (example in Figure 16). Digital elevation maps were used to estimate surface runoff, average
linear velocities and the resulting travelling time of the infiltrating water for each individual lithological area in a catchment. Dissolved BC’s of the infiltrating water were estimated using a reactive transport model, where transfer functions for the dependence of
«travelling-time» and «mineral dissolution» were calculated for each lithology. Travelling
time is essential, since longer reaction time of the water with the bedrock lithology contributes significantly to the overall catchment weathering rate (BCw,C). The contribution
from bedrock to BCw,C is restricted to saturated groundwater and infiltrates into the lake
mainly at deeper levels. At low porosity, e.g. 2 %, a recharge of 400 mm a–1 has been
estimated. The remaining surface runoff is the dominant H+ source, which enters the lake
directly (surface runoff), or after relatively short travelling time if the surface is covered
by quaternary deposits.
2.4.2
Calibration of Hydrology
Before the reactive transport in the subsurface of a basin can be studied in space and time,
the hydrological situation needs to be evaluated. First, a fluid flow mass balance calculation for the basin has to be performed, and then particle travel times have to be calculated.
For mass balance calculations and particle tracking in the crystalline basement of the two
catchments used for calibration, a simplified 3-D groundwater model was derived. Fluid
flow and mass transport simulations are conducted with the computer program Visual
MODFLOW (Waterloo Hydrogeologic, Inc.). Particle travel times in the overlying gravel
aquifer and parameter sensitivity analyses are evaluated using 2-D flow nets and Darcy’s
law.
26
2
27
> Methods
a) Introduction:
For evaluating the hydraulic parameters, the mountain basin of the Lake Superiore
(ID=64) and Lake Inferiore (ID=63) was used (see Figure 2 and Annex 1). Three distinct
lithological units with different hydrological characteristics are separated. The top gravel
layer has an approximate thickness of 0.1 to 1.0m, and is underlain by the crystalline
basement, which is composed dominantly of gneiss and amphibolite dykes. Very little is
known about the hydrological parameters of the unconfined aquifers. Therefore, hydraulic
conductivity (horizontal Kx, vertical Ky), porosity, and specific yield data are taken from
the typical range of comparable lithologies (Freeze and Cherry, 1992; Spitz and Moreno,
1996) as shown in Table 2.
Specific yield is a property of the aquifer measuring the ability to release groundwater
from storage, due to decline in hydraulic head. Hydraulic head is defined as the sum of
pressure and elevation heads. In an unconfined aquifer (which is in contact with the
atmosphere) it corresponds to the water table.
Table 2 > Hydrological characteristics of three distinct lithology units.
Lithology
Gravel
Porosity [%]
Ky [m/s]
Kx [m/s]
10
Specific Yield [ – ]
15
10
Feldpar-Gneiss
2
10–8
10–7
0.01
Amphibolite
4
10–7
10–6
0.02
–4
–3
0.15
The hydraulic conductivity of the crystalline basement depends largely on the degree of
fracturing. The crystalline is in nature a dual porosity aquifer with fractures and a porous
matrix. For the top glacial sediment layer a high uncertainty lays in the porosity value,
which could be as high as 40 %. The specific yield of 0.15 dominates release and storage
of groundwater in this aquifer. An unsaturated zone in the crystalline rocks might separate
the horizontal interflow in the gravel layer from the basement aquifer. Thin permeable
sediment layers with interflow are common when a layer with low vertical hydraulic
conductivity occurs beneath (Fetter, 1994). This interflow may be substantial in the Lake
Superiore/Lake Inferiore drainage basin and may contribute significantly to total discharge into the lakes.
In the hydrological model only annual mean values are used. Thus, seasonal fluctuations
are neglected, e.g. the spring melt, where large amounts of surface flow are observed, as
the water can not infiltrate the frozen soil. Furthermore, a constant water level is assumed
in the lakes. This water surface is used as a prescribed head boundary (upper boundary of
the bedrock aquifer).
Critical Loads of Acidity for Alpine Lakes FOEN 2007
b) Conceptual Model:
Computer simulations with Visual MODFLOW require defining the model boundaries,
defining the model dimensions, and simplifying the aquifer system.
a) The mountain range to the South of the lakes (see Figure 5) represents a natural deep
reaching groundwater divide and serves as no-flow boundary, whereas the other mountain ranges to the Southeast, West and North are just no-flow boundaries for local-flow
but not for regional (deeper reaching) groundwater flow. The Northeast boundary is a
natural flux boundary where a stream and partially the crystalline bedrock aquifer discharge. As no head distributions (ground water levels) and flux data are available it
must be accepted that all surrounding boundaries are modelled as no-flow boundaries.
Other natural discharge areas are the surfaces of Lake Superiore and Lake Inferiore,
which represent constant head boundaries.
b) The size of the model domain is selected based on the natural boundaries (mountain
ranges), and in the Northeast by the extension of Lake Inferiore.
c) Due to the steep topography, and subsequently the high vertical hydraulic gradient, it is
not possible in the finite difference program Visual MODFLOW to simulate fluid flow
through the gravel layer and bedrock aquifer together. As a first approximation the aquifer system is seen as one continuous hydrogeological unit and only groundwater flow
through the crystalline basement is simulated.
c) Selecting Model Input Data:
The 3-D finite difference program Visual MODFLOW requires information about vertical
and horizontal hydraulic conductivity, porosity, specific yield (in the case of unconfined
aquifers) and the coordinates of all layers. These input data are taken from literature
(Freeze and Cherry, 1992; Spitz and Moreno, 1996; see Table 2). The following assumptions lead to further simplifications:
d) The aquifer can be represented by a homogeneous porous medium.
e) Recharge due to infiltrating rainfall and melting snow, and evapotranspiration are
constant over the whole domain.
f) The crystalline bedrock aquifer is completely saturated, therefore the water table lies at
the surface.
28
2
29
> Methods
d) Defining the Model Domain and Discretization:
In order to evaluate the water mass balance in the Lake Superiore and Lake Inferiore
basin a three-dimensional domain has to be considered. A finite difference model is used,
and the domain is discretized with 15 horizontal layers, 75 rows and 118 columns yielding a total of 132750 elements. In the high discharge areas around the lakes a finer grid is
chosen.
e) Performing Model Simulations and Calibration:
All input data are assumed to be constant in time. Therefore, a steady state situation is
simulated. The model is calibrated using the prescribed heads of Lake Superiore and Lake
Inferiore. No other groundwater heads are known in the basin. In the calibration procedure it is assumed that the water table in the crystalline bedrock aquifer reaches the
surface. Model calibration yields a maximum possible recharge into the bedrock aquifer
of 400 mm a–1. Evapotranspiration from the saturated groundwater regime is assumed to
be 160 mm a–1.
f) Results from Model Simulations:
In the groundwater mass balance budget the total inflow into the crystalline aquifer
system is 1701.46 m³ d–1 (400 mm a–1), and the total discharge is 1712.11 m³ d–1 through
the lakes and due to evapotranspiration.
For a one-layer system at 400 mm recharge the infiltrations are estimated according to
Table 3.
Table 3 > Calculation of infiltrations for a one-layer system. Units are m³ d–1.
IN
OUT
Constant head = 2.0
Constant head = 1122.5
Recharge = 1699.4
Evapotranspiration = 589.6
Total in = 1701.5
Total out = 1712.1
IN – OUT = –10.6
% Discrepancy = –0.62 %
From calibration simulations it can be concluded that a large amount of rainwater infiltrates into the upper gravel layer (1600 mm a–1 – 400 mm a–1) and reaches the lake system
as surface-parallel interflow through the gravel. The amount of interflow is calculated
with 2547.0 m³ d–1. In order to evaluate the outflow of the basin, which discharges
through the lakes and ultimately through the stream, an annual stream hydrograph is
Critical Loads of Acidity for Alpine Lakes FOEN 2007
required. From such hydrograph data it is possible to separate baseflow from interflow
plus overland flow.
From the total recharge into the crystalline basement about 1/5 (or 339.9 m³/d) infiltrates
through amphibolite dikes.
For a three-layer system at 1600mm recharge the infiltrations are estimated as shown in
Table 4.
Table 4 > Estimated infiltrations for a three-layer system. Units are m³ d–1.
Layers
IN
Gravel
2547.0
Amphibolite
Gneiss
339.9
1359.5
g) Head Distribution (Groundwater Levels):
Calibrating the model with the prescribed heads of 2128m for Lake Superiore and 2074m
for Lake Inferiore, and defining the water table at the crystalline surface yields a consistent head distribution with fluid flow towards the two lake system (Figure 5). Due to the
head distribution in the basin, velocity vectors are pointing towards the defined discharge
areas. Average linear velocities depend on the hydraulic gradient, the vertical and horizontal hydraulic conductivity, and the porosity.
30
2
> Methods
Figure 5 > Head distribution isolines and three particle paths in the Lago Superiore (left) and Lago Inferiore (right) area.
The coloured areas represent lithology classes: red = gneiss, blue = amphibolite, green = quarterny cover.
h) Particle Tracking in the Crystalline Bedrock Aquifer:
The pathway of three particles, which have been released in areas with different gradients
and distances to the lake system, are shown in Figure 5. Particle 1, which is released at
the steep southern mountain slope, reaches Lake Superiore in 9300 days (~25.5 years).
The travel distance for particle 1 is about 660m, and the hydraulic gradient 0.48 (vertical
distance divided by horizontal distance, dh/dl). Particle 2 is released on the northern
ridge, which is relatively close to Lake Superiore and just about 100m higher in elevation.
Subsequently, the travel time is much shorter with 2000 days (~5.5 years). Particle 3 is
furthest away from the discharge areas, and has a travel time of 20900 days (~57.3 years)
before reaching Lake Inferiore.
31
Critical Loads of Acidity for Alpine Lakes FOEN 2007
i) Travel Times:
Using Darcy’s law, average linear velocities and resulting travel times are calculated for
gravel, amphibolite, and gneiss layer. A sensitivity study with respect to hydraulic gradient (dh/dl), hydraulic conductivity and porosity is performed.
1. Gravel Layer:
The travel time for a dissolved conservative particle in a gravel layer with 15 % effective porosity, a hydraulic conductivity of 10 – 4 m s–1, and a gradient of 0.48 is 23.9
days for a distance of 660 m (Table 5). A decreasing gradient to 0.1 results in an increase of the travel time to 114.6 days. If the porosity increases at a constant gradient,
travel times will also increase (Table 6). As the porosity changes from 15 to 30 % at a
hydraulic gradient of 0.48, the particle travel time changes from 23.9 to 47.7 days. Increasing the hydraulic conductivity by a factor of 10 will decrease the travel time also
by a factor of 10, if all other parameters stay constant.
2. Amphibolite Layer:
The largest outcrop for amphibolite lies in the south-eastern quadrangle of the study
area (Figure 5). Here the average hydraulic gradient through amphibolite is estimated
with 0.24. Particles released in the south-eastern area might travel about 210 m through
amphibolite, which has an estimated hydraulic conductivity of 10 – 6.5 m s–1. Assuming an effective porosity of 4 %, particles will take about 1292 days (~3.5 years) to
travel the distance of 210 m on their way towards Lake Inferiore. Decreasing the hydraulic conductivity to 10 – 7.5m/s will result in a 10-fold travel time of about 35
years.
3. Gneiss Layer:
Travel times for particles that are released near the southern border (see particle 1,
Figure 5) reach Lake Superiore in about 10,000 days, assuming that the hydraulic gradient is 0.48 (Table 7). Such gradient can only be reached, when the water table lies
directly beneath the surface. A lower water table will result in a decreasing hydraulic
gradient and subsequently yield longer travel times. If the effective porosity of 2 % is
doubled the travel time is doubled as well, assuming all other parameters stay constant
(Table 8).
32
2
33
> Methods
Table 5 > Maximum total daily flow through gravel layer for different gradients.
hydraulic
gradient
effective
porosity
hydraulic
conductivity
specific
discharge
average linear
velocity
total daily flow
per m width
thickness of
gravel layer
average linear
velocity
horizontal
distance
time
dh/dl
ne
K
q
v
Q
b
v
d
t
[-]
[-]
[m/d]
[m/d]
[m/d]
[m³/d]
[m]
[m/d]
[m]
[d]
0.10
0.15
8.64
0.9
5.8
0.9
1
5.8
660
114.6
0.20
0.15
8.64
1.7
11.5
1.7
1
11.5
660
57.3
0.30
0.15
8.64
2.6
17.3
2.6
1
17.3
660
38.2
0.40
0.15
8.64
3.5
23.0
3.5
1
23.0
660
28.6
0.48
0.15
8.64
4.1
27.6
4.1
1
27.6
660
23.9
average linear
velocity
total daily flow
per m width
thickness of
gravel layer
average linear
velocity
horizontal
distance
time
Table 6 > Travel times through gravel layer for different porosities.
hydraulic
gradient
effective
porosity
hydraulic
conductivity
specific
discharge
dh/dl
ne
K
q
v
Q
b
v
d
t
[-]
[-]
[m/d]
[m/d]
[m/d]
[m³/d]
[m]
[m/d]
[m]
[d]
0.10
0.10
8.64
4.1
41.5
4.1
1
41.5
660
15.9
0.20
0.15
8.64
4.1
27.6
4.1
1
27.6
660
23.9
0.30
0.20
8.64
4.1
20.7
4.1
1
20.7
660
31.8
0.40
0.25
8.64
4.1
16.6
4.1
1
16.6
660
39.8
0.48
0.30
8.64
4.1
13.8
4.1
1
13.8
660
47.7
thickness of
gravel layer
average linear
velocity
horizontal
distance
Time
Table 7 > Maximum total daily flow and travel times through gneiss layer for different gradients.
hydraulic
gradient
effective
porosity
hydraulic
conductivity
specific
discharge
average linear
velocity
total daily flow
per m width
dh/dl
ne
K
q
v
Q
b
v
d
T
[-]
[-]
[m/d]
[m/d]
[m/d]
[m³/d]
[m]
[m/d]
[m]
[d]
0.10
0.02
0.00273
0.0003
0.0137
0.0003
1
0.0137
660
48351.6
0.20
0.02
0.00273
0.0005
0.0273
0.0005
1
0.0273
660
24175.8
0.30
0.02
0.00273
0.0008
0.0410
0.0008
1
0.0410
660
16117.2
0.40
0.02
0.00273
0.0011
0.0546
0.0011
1
0.0546
660
12087.9
0.48
0.02
0.00273
0.0013
0.0655
0.0013
1
0.0655
660
10073.3
34
Critical Loads of Acidity for Alpine Lakes FOEN 2007
Table 8 > Travel times through gneiss layer for different porosities.
hydraulic
gradient
2.4.3
effective
porosity
hydraulic
conductivity
specific
discharge
average linear
velocity
total daily flow
per m width
thickness of
gravel layer
average linear
velocity
horizontal
distance
time
dh/dl
ne
K
q
v
Q
b
v
d
t
[-]
[-]
[m/d]
[m/d]
[m/d]
[m³/d]
[m]
[m/d]
[m]
[d]
0.10
0.01
0.00273
0.0013
0.1310
0.0013
1
0.1310
660
5036.6
0.20
0.02
0.00273
0.0013
0.0655
0.0013
1
0.0655
660
10073.3
0.30
0.05
0.00273
0.0013
0.0262
0.0013
1
0.0262
660
25183.2
0.40
0.07
0.00273
0.0013
0.0187
0.0013
1
0.0187
660
35256.4
0.48
0.10
0.00273
0.0013
0.0131
0.0013
1
0.0131
660
50366.3
Calibration of the Reactive Transport of Ions
a) The used Model and Modelling Conditions:
In the used approach the lithologies were treated as porous homogeneous media, neglecting preferential flow paths. The averaged water composition was then calculated from the
contribution of each lithology and expressed as field weathering rate BCw.C for each of the
100 catchments.
The Model MPATH (Lichtner, 1985, 1988,1992) describes fluid transport in a time-space
continuum, assuming pure advection. MPATH calculates the changes in the composition
of an infiltrating fluid packet as well as the associated mineralogical changes of the parent
rock (Figure 6). Rock-water interaction reactions occur until a quasi stationary state is
reached. The next fluid package infiltrates in the now slightly altered parent rock, and so
on. The reaction history of each fluid packet therefore behaves differently, producing
reaction fronts depending on the reaction kinetics, the composition and velocity of the
fluid.
Figure 6 > General scheme of the rock-water interaction model MPATH.
Water composition
Infiltation
Minerals
Surface
Rate
K
Water composition
Mineralogy
2
35
> Methods
Reversible homogeneous reactions are considered for aqueous components (speciation,
complexation, redox reactions) and non reversible heterogeneous reactions for mineral
phases (dissolution and precipitation). Aqueous complexing reactions are assumed to be
in local chemical equilibrium, including all redox couples. Sposito (1989) confirmed that
in soils the kinetics of complexation is fast enough to assume instant chemical equilibrium.
Mineral reactions are described using kinetic rate laws, activity coefficient corrections are
based on an extended Debye-Hückel algorithm (The code was developed by Peter Lichtner and is described in detail in Lichtner, 1985 and Lichtner, 1988).
At the initial state of the column, mineral compositions and physical properties of a
parent rock were used. Rain water composition measured by Barbieri (pers. comm.,
Barbieri & Pozzi 2001) was used as input solution, representing the water composition,
which infiltrates the parent rock. The model has been run over a time span of 100 years.
The initial state of development is mainly dependent on the porosity and the velocity of
the water front which in the model is assumed to be saturated. The velocity of the percolating front was calculated by ModFlow to be 400 mm per year. The input parameters
used are listed in Table 9.
Table 9 > Input parameters for the Model MPATH.
Lithology
specific Yield
min VDarcy
max VDarcy
Discharge
Temp
m/a
m/a
mm/a
°C
Gravel
0.15
2’000
10’000
> pecipitaion
8
Gneiss (L&M)
0.01
5
24
400
8
Amphibolite
0.02
10
48
400
8
Carbonate
0.02
10
48
400
8
Modelling conditions used are:
–
–
Mode
Species
–
–
Activity model
Area
–
–
Flow
Temperature
–
Constraint types
–
Output
open system (Fluid packet model)
all species contained in database are read in consistent with
set of primary species
extended Debye-Hückel approximation
variable surface area according to the two-thirds power of the
mineral volume fraction
Darcy fluid velocity, VDarcy (m a-1)
temperature in °C. Allowed values are in the range 0–300 °C
for the EQ3/6 (Wolery et al. 1990)
mass balance / mineral constraint / gas constraint / concentration constraint buffer along flow path / concentration (activity
of H+ ) constraint / pH constraint or charge balance
aqueous concentrations / mineral reaction rates / mineral saturation indices / mineral volume fractions
Critical Loads of Acidity for Alpine Lakes FOEN 2007
Figure 7 > Ion concentrations in rock-water for Leucocratic Crystalline Rocks (top) and Melanocratic
Crystalline Rock Types (bottom). Y is the best-fit function for BC (dotted line).
36
2
> Methods
Figure 8 > Ion concentrations in rock-water for Amphibole Bearing Rocks (top) and Carbonate Rock Types
(bottom). Y is the best-fit function for BC (dotted line).
37
Critical Loads of Acidity for Alpine Lakes FOEN 2007
Figure 9 > Ion concentrations in rock-water for quarternary cover. y is the best-fit function for BC.
b) Calculated Water Composition:
Using the modelling conditions described above, the water composition has then been
calculated as function of travelling distance for each of the lithologies. For better reading
of Figure 7, Figure 8 and Figure 9, the water composition is shown as a function of
residence time (travelling time), corresponding to the time a water package needs to
migrate through the bedrock. The figures show the concentrations of Na, K, Ca and Mg as
well as the resulting total BC-concentrations approximated by a best-fit function (polynomial of 5th order).
Using the best-fit functions of the calculated BC-release in combination with additional
catchment specific parameters, transfer functions were defined as described in the next
section.
38
39
2
> Methods
2.4.4
Transfer Functions for the Regional Application
The measured water composition in the catchment lake is a function of the amount and
composition of the infiltrating and surface runoff water, and the mineralisation through
mineral dissolution reactions during migration through the host rock. For the calculation
of the catchment weathering rates (BCw,C) the following calculation steps were made.
The hydrological parameters for the lithology-classes (L) such as conductivity (KL) and
porosity (see Chapter 2.4.2) are used to calculate the mass flow (QL):
(2.30)
QL = dh/dl * KL
(Qmax = infiltration)
Where: dh is the difference in height to the lake surface and dl is the horizontal distance
to the lakeshore (see Figure 10). dh/dl is the hydraulic gradient. dh and dl are calculated
from digital terrain data.
The amount of infiltrating water is limited by the precipitation, and the difference between precipitation and infiltration is assumed to be surface runoff which reaches the lake
directly. Therefore it has no direct influence on the weathering rate of the catchment, but
has to be taken into account when the measured water composition in the lake is compared to the modelled water composition.
For the area, which is covered by glaciers no infiltration in the host rock is calculated.
The total amount of precipitation is infiltrating the quaternary cover (gravel), if present,
and below the gravel the water balance is handled according to the specific lithology, the
same way as when no gravel would be present. In practice, the lithology underneath the
quaternary cover is not known, and therefore the area covered by gravel was distributed
among the other lithologies in the catchment according to their relative coverage of the
catchment by increasing the weathering rate of the specific lithology.
For every lithology in a catchment an average flow path length (DISTL) and an average
travelling time (TTL) was approximated by (see Figure 10, left):
(2.31)
DISTL = dlL + 0.5 * dhL
(2.32)
TTL = DISTL / (QL / porosityL)
The mean flow path length for each lithology was calculated as a weighted average based
on the surface of the mapped sub-areas of the lithology. E.g. the catchment in Figure 16
contains three sub-areas of lithology No. 4 (leucocratic granite/gneiss) which are mapped
as individual polygons. The area-weighted averaged flow path length was calculated
operationally in the GIS by rasterizing the catchment with a resolution of 10x10 m,
calculating DIST for each raster-cell and averaging all cells belonging to a specific lithology. The total area of a lithology within the catchment is denoted as AREAL.
Critical Loads of Acidity for Alpine Lakes FOEN 2007
Figure 10 > Scheme of the simplified flow path calculation (left)as well as the calculated total areas (AREAL) and the mean flow path lengths
(DISTL) per lithology-class in catchment No. 64 (Lago Superiore) (right).
In Figure 10 (right) an example for catchment No. 64 is given, where the radius of a
sector corresponds to the averaged travelling distance and the area of the sector to the
relative surface area of the specific lithology.
Depending on the travelling time (TTL), which is assumed to be the average time the
water is in contact with the host rock, the BC concentration contributed by every lithology (BC(TTL)) was calculated according to the functions shown in Chapter 2.4.3. At the
end, the BC concentrations were multiplied by the mass flow (QL * AREAL), and the
results of all lithologies were summed up and then expressed as eq ha–1 a–1:
(2.33)
BCL = QL * AREAL * BC(TTL)
(2.34)
BCw,C = ∑ BCL1..L4 + BCGravel
Table 10 gives an example of the input data compiled to calculate the average weathering
rate of a catchment (BCw,C) by Equations 2.30 to 2.34.
40
2
41
> Methods
Table 10 > Mean values of area (AREAL), distance of the flow path (DISTL) and hydraulic gradient (dhL/dlL)
per lithology-class (L) in the catchment No. 77 (Lago Nero).
L
Description
AREAL
DISTL
dhL/dlL
KL
porosityL
1
carbonate bearing
rocks
[ha]
[m]
0
--
[-]
[m s–1]
[%]
--
3.17*10-8
2
2
amphibolite
0
--
--
3.17*10-8
4
7.3
582
0.68
3.17*10
-8
3
melanocratic
granite/gneiss
2
4
leucocratic
granite/gneiss
32.1
235
0.71
3.17*10-8
2
5
quaternary cover
(gravel)
20.2
272
0.57
3.17*10-5
15
8
glacier
0
--
--
--
--
9
lake surface
12.7
--
--
--
--
Total
72.3
42
Critical Loads of Acidity for Alpine Lakes FOEN 2007
3 > Input Data
3.1
Deposition Rates
The atmospheric deposition of base cations, N and S was calculated with a generalised
combined approach (FOEFL 1994 and 1996, Rihm & Kurz 2001, Thimonier et al. 2004).
Wet deposition is calculated by combining a digital precipitation map (see chapter 3.2)
with the concentration fields of the compounds in precipitation water. In Southern Switzerland, a detailed study on wet deposition patterns was carried out (SAEFL, 2001). It
presents a regression model for calculating the concentrations in precipitation as a function of altitude, longitude and latitude as shown in Table 11. The regression model is
based on 13 monitoring stations in the canton Ticino and Italy. Fortunately, at least one
station is situated in the altitude range of the investigated lakes: Robei, 1890 m a.s.l (near
lake No. 78).
Table 11 > Linear regression models for calculating ion concentrations in precipitation in the canton
Ticino, based on measurements from 1993 to 1998 (SAEFL 2001).
compound
Regression coefficients
Sulphate, SO42Nitrate, NO
Intercept
longitude
latitude
meq m–3
meq m–3 km–1
meq m–3 km–1
altitude
meq m–3 km–1
54.58
0.12
–0.24
–9.18
44.49
0.057
–0.20
–7.29
Ammonium, NH4+
51.90
0.090
–0.30
–7.98
Base cations, Bc
3-
27.78
0.21
–0.033
–6.92
Sodium, Na+
9.14
0.045
–0.047
–1.62
Chloride, Cl
9.5
0.053
–0.039
–2.54
-
Longitude, latitude and altitude are given in a local coordinate system in km. They can be
obtained from Swiss national coordinates x and y (in m) with: longitude = x/1000–668,
latitude = y/1000–70. Altitude is the average catchment altitude above sea level. It was
available in digital form with a resolution of 25x25 m from the Federal Office of Topography.
Bc is defined as the sum of Ca2+, Mg2+ and K+. For all compounds, there is a clear decrease of concentrations with altitude and latitude.
Resistance analogue models are used for assessing the dry deposition of NH3 and NO2
gases as well as aerosols (PM10). For these compounds, the concentration fields were
3
43
> Input Data
calculated from emission inventories with a resolution of 200m (NH3 100m) by applying
statistical dispersion models. The models are described in Thoeni et al. (2004) for NH3, in
SAEFL (2004) for NO2 and in SAEFL (2003) for PM10. For HNO3, the concentration
field is calculated as a function of altitude. For SO2, the concentration field is determined
by geo-statistical interpolation of monitoring results. The concentration fields are multiplied by deposition velocities, which depend on the reactivity of the pollutant, surface
roughness and climatic parameters. Deposition velocity values were taken from literature
(FOEFL, 1996, with modifications).
The resulting patterns of deposition are supposed to be representative for the year 1995.
As an example, Figure 11 shows a map of total nitrogen deposition: the gradients in
altitude and latitude are evident. The Alpine lake catchments, mostly located near the
watersheds, have much lower depositions than the bottoms of the valleys.
Figure 11 > Map of modelled N deposition for the year 1995.
2
3
5
10
11
9
16
19
18
21 24
2526 23
31 205 2830
215
20 223336
3537
38
220
44
217
46
204
201
47
48
49
51
203
54 55
57
218
214 216
60
202
64
65 219
66
67
68 707363
71
76
77
78
79
80
81 222
221
207
84
22388
224
92
206
12
17
27
15
4143
50
225
53
72
74
85
86
89
93
9495
20898
99
212
100
102
211
109210
110
209
106
< 400
400 - 700
700 - 1000
1000 - 1500
> 1500
eq /ha /a
101
213104
K606-01©2004 swisstopo
0
5
10
km
44
Critical Loads of Acidity for Alpine Lakes FOEN 2007
For estimating the deposition in 1980 and 2010, the depositions for each lake are scaled
backward and forward from 1995 proportionally to the European deposition time series
modelled by Schöpp et al. (2003) on the European 150x150 km EMEP-raster. The 2010
scenario corresponds to the NEC Directive Implementation of the Gothenburg Protocol.
From that dataset deposition ratios for the relevant years and EMEP-cell were derived as
shown in Table 12. The area of investigation is covered by the EMEP-cell no. 24/13
(150x150 km). The ratios are used to scale the 1995 deposition calculated for each
catchment. BC deposition is supposed to be time-independent.
Table 12 > Deposition of S, NOy and NHx in 1980, 1995 and 2010 for the EMEP-cell 24/13 (from Schöpp et
al. 2003) and derived deposition ratios normalised to 1995.
Units
1980
1995
2010
Sulphur
g S m–2 a–1
3.739
1.405
0.502
NOy
g N m–2 a–1
0.754
0.698
0.418
NHx
g N m–2 a–1
1.371
1.243
1.213
--
2.661
1.000
0.357
NOy
--
1.080
1.000
0.599
NHx
--
1.103
1.000
0.976
Deposition:
Ratios:
Sulphur:
Figure 12 shows the resulting deposition values in the 100 catchments with a decrease in
S deposition of roughly 85 % and in N deposition of nearly 30 % between 1980 and 2010.
At the considered altitude range, dry deposition contributes only a small part to the total
deposition, namely 18 % of total nitrogen and 10 % of total sulphur.
3
45
> Input Data
Figure 12 > Cumulative frequency distributions of S and N deposition for the 100 catchments in 1980, 1995 and 2010. Bc is the time-independent
deposition of base cations.
100
90
80
N 1980
N 1995
70
60
N 2010
S 1980
S 1995
[%] 50
40
S 2010
Bc
30
20
10
0
0
3.2
200
400
600
[eq/ha/a]
800
1000
1200
Runoff
The runoff (Q) is the difference between precipitation (P) and evapotranspiration (ET).
Precipitation data are taken from a national precipitation map (FOWG 2000, Figure 13)
with a resolution of 2x2 km. It contains long-term annual averages.
Actual evapotranspiration is available from the Hydrological Atlas of Switzerland
(FOWG 1999) on a 1x1 km raster. These are long-term annual averages taking into
account climate, altitude, exposition, land-use and soil-properties.
The frequency distribution of mean precipitation, evapotranspiration and the resulting
runoff within the 100 catchment areas is shown in Figure 14.
46
Critical Loads of Acidity for Alpine Lakes FOEN 2007
Figure 13 > Map of precipitation rates, average 1961–1999 (FOWG 2000).
2
3
5
11
10
15
16
19
18
21 24
2526 23
28
215
31
30
205
20 223336
3537
38
220
44
217
46
204
201
47
48
49
51
203
225
54 55
57
218
214 216
60
202
64
65 219
67
707363
68 66
71
76
77
78
79
80
81 222
221
207
84
86
22388
89
224
92
93
206
99
20898
212
100
102
211
109210
110
209
< 1.25
1.25 - 1.50
1.50 - 1.75
1.75 - 2.00
2.00 - 2.25
> 2.25
106
9
12
17
27
4143
50
53
72
74
85
9495
101
213104
mt©20040920
0
5
10
km
m /a
3
47
> Input Data
Figure 14 > Cumulative frequency distributions of mean precipitation (P), evapotranspiration (ET) and
runoff (Q) for the 100 catchments.
100
P
90
ET
80
Q
70
60
[%] 50
40
30
20
10
0
0.0
3.3
0.5
1.0
1.5
2.0
2.5
[m/a]
Weathering Rates
For defining the boundaries of the lithological units used for calculating the overall
weathering rates of the catchments, four different sources of geological maps were considered. Where available, the maps of the Geological Atlas of Switzerland (scale
1:25’000) were used (Figure 15 top). Where these maps are not yet available, special
regional maps were used: Either special geological maps (Figure 15 middle Spezialkarten
der Schweiz), original geological maps (Figure 15 bottom geologische Originalkarten der
Schweiz). Otherwise, the lithological maps from Boggero et al. (1996) were employed.
The maps were simplified by reducing the complex geological information into the five
classes of lithology, for which rock-water interactions were calculated using the model
MPATH (see Chapter 2.4): 1. carbonate bearing rocks, 2. amphibolites, 3. melanocratic
granite/gneiss, 4. leucocratic granite/gneiss, and 5. quaternary cover.
The simplified boundaries of the lithologies within the catchments were transferred from
the original geological maps to transparent foils and then digitised and geo-referenced on
a tablet (see example in Figure 16). By overlaying digital terrain data with the geologylayer, the average horizontal and vertical distances (see Figure 1) from the lithological
units to the lakes were calculated using GIS-tools. The digital terrain model had a resolution of 25x25m (source: DHM25©swisstopo).
Critical Loads of Acidity for Alpine Lakes FOEN 2007
Figure 15 > Different types of geological maps (supplied by swisstopo, 2006). Geological Atlas (top),
special geological maps (middle) and original geological maps (bottom).
48
3
49
> Input Data
Figure 16 > Digitized lithological units in the catchment of lake No 77 (Lago Nero).
Legend: melanocratic granite/gneiss (3), leucocratic granite/gneiss (4), quaternary cover (5),
and surface water (9). Carbonate bearing rocks (1) and amphibolite (2) do not occur. Lattice
0.5x0.5 km.
Table 13 > Mean values of area (AREA), distance of the flow path (DIST) and hydraulic gradient (dh/dl) per
lithology-class, averaged over the 100 mapped catchments.
No
Description
AREA
DIST
[ha]
[m]
dh/dl
[-]
5.5
427
0.44
3.1
379
0.47
31.0
395
0.50
1
carbonate bearing rocks
2
amphibolite
3
melanocratic granite/gneiss
4
leucocratic granite/gneiss
15.2
545
0.46
5
quaternary cover
22.0
301
0.40
8
glacier
6.1
645
0.33
9
lake surface
3.9
0
--
50
Critical Loads of Acidity for Alpine Lakes FOEN 2007
Table 13 shows a statistical summary of the analysed geological maps, lithological units
and terrain data. AREA, DIST and dh/dl are explained in Chapter 2.4.4. The Table represents the ‘average’ of all 100 mapped lake catchments. The average catchment area is
86.8 ha and the lake surface 3.9 ha. The dominant lithology is melanocratic granite/gneiss
with 31.0 ha on the average. However, the values vary largely among individual lakes
(see also Table 14), e.g. carbonate bearing rocks only occur in 20 % of the catchments.
The resulting weathering rates of the catchments are listed in Annex A.1 and summarised
in Figure 17.
Figure 17 > Cumulative frequency distribution of the average weathering rates (BCw,C) for the 100
catchments. Units: eq ha–1 a–1.
100
90
80
70
60
[%]50
40
30
20
10
0
0
3.4
250
500
750
1000
1250
1500
1750
2000
Terrestrial Sinks of Nitrogen and Base Cations
For determining terrestrial sinks as well as for calculating deposition, land-use data are
necessary. The land-use within the catchment areas was determined on the basis of a
raster data set with a resolution of 100x100 m supplied by the Federal Office for Statistics
(Geostat, land use statistics). The original 24 categories were aggregated to 3 main categories (j) for the FAB-application:
– forest
– grassland (mountain meadows and pastures)
– bare land (gravel, rocks, glaciers)
The lake surface was taken from the digitised geological maps, not from the land use
statistics.
3
51
> Input Data
Table 14 > Statistics of the land-use categories occurring in the 100 mapped catchments.
statistical
parameter
area [ha]
total catchment
lake surface
forest
grassland
bare land
Minimum
8.38
0.22
0
0
0.47
Maximum
929.88
38.54
47.63
281.31
810.90
Mean
86.82
3.89
1.40
30.44
51.09
Median
52.31
1.97
0
16.25
29.73
Input values for uptake, immobilization and denitrification depending on land-use type
are shown in Table 15. The net uptake of BC and N for forests is consistent with the
amounts used for the critical load calculations for forests. For grassland, relatively low
uptakes are used which reflect goat and sheep grazing. The denitrification factors (fde)
correspond to well drained soils. Also for bare land a small value of fde was used accounting for re-emissions from drying bare rocks.
Table 15 > Values for uptake, immobilization and denitrification used in the FAB-model application for
alpine lakes.
parameter
land-use categories (j)
forest
3.5
units
grassland
bare land
N uptake (Nu)
56
36
0
eq ha–1 a–1
BC uptake (BCu)
54
18
0
eq ha–1 a–1
N immobilisation (Ni)
357
143
0
eq ha–1 a–1
denitrification factor
(fde) (see Equation
2.8)
0.3
0.2
0.1
fraction
In-lake Retention
In the FAB model the retention of sulphur, nitrogen and base cations in the lake is incorporated (see Equations 2.4 and 2.25 in Chapter 2.2). In addition to runoff and lake:
catchment ratio, the retention is characterised by the so-called net mass transfer coefficient sX (X=S,N,BC).
For base cations no retention was assumed (sBC=0), whereas sS=0.5 m a–1 and sN=5 m a–1
was used for S and N retention, resp., for all lakes. These are average values from the
ranges given in Baker and Brezonik (1988) and Dillon and Molot (1990), respectively.
52
Critical Loads of Acidity for Alpine Lakes FOEN 2007
4 > Results and Discussion
Using the input data described in Chapter 3, the critical load functions of acidifying N and
S for 100 lakes were computed with the generalised FAB model and the result is displayed in Figure 18.
Figure 18 > Critical load functions of acidifying N and S for 100 lakes as computed with the generalised
FAB model. Also shown are the respective pairs of N and S depositions (points) in the 100 catchments for the
year 1995.
100 lakes
Sdep
2000
1000
1000
2000
Ndep (eq/ha/yr)
To get a better overview over these critical loads, the cumulative distribution functions
(CDFs) of the maximum critical loads of S and N are shown in Figure 19. The figure
shows that, e.g., the median values for CLmax(S) and CLmax(N) are about 570 and 800 eq
ha-1 a-1, respectively.
From Figure 18 one can not determine for which lakes critical loads are exceeded (in
1995) and for which not. One can only infer that some lakes are not exceeded, whereas
others are exceeded: Certainly those for which all deposition dots lie above the critical
load function. An overview over the exceedances is provided in Figure 20. The figure
shows the cumulative distribution functions of the exceedances of the acidity critical
loads displayed in Figure 18 computed for the depositions of N and S in 1980 (when they
were about peaked), in 1995 and in 2010 (after the implementation of the Gothenburg
Protocol and other current legislation). The percentage (or number – since there are
exactly 100) of lakes protected (i.e. non-exceeded) increases from 46% in 1980 via 57%
4
53
> Results and Discussion
in 1995 to 73% in 2010. As can be seen from the cumulative distribution functions, also
the amounts by which critical loads are exceeded decrease dramatically over time.
Figure 19 > Cumulative distribution functions of CLmax(S) (left) and CLmax(N) (right) of the 100 lakes.
100 lakes
100
%
80
60
40
20
0
0
400
800
1200
1600
2000
2400
Critical Loads (eq/ha/yr)
Figure 20 > Cumulative distribution functions of the exceedances of the acidity critical loads for the 100
lakes shown in Figure 18 for the years 1980 (dashed line), 1995 (solid line) and 2010 (thin solid line).
100 lakes
100
%
80
60
40
20
0
0
200
400
600
800
Exceedance (eq/ha/yr)
1000
1200
54
Critical Loads of Acidity for Alpine Lakes FOEN 2007
The novel way of computing lake critical loads by using estimated catchment weathering
rates prompts the question how the result compare with critical loads computed in the
‘traditional’ way, i.e. with the SSWC (or ‘Henriksen’) model using water chemistry data.
For 19 of the 100 lakes water chemistry measurements are available for the years 2000–
2003 (Barbieri 2004, Annex A.1). And the volume-weighted average concentrations over
those years (6–13 water samples taken at a depth of 0.4 m, see column 2 in Table 16)
have been used to calculate the critical loads for acidity with the SSWC model (see
Section 2.3). Figure 21 shows a comparison of the resulting CL(A) values with the values
for CLmax(S) obtained with the FAB model for those 19 lakes. CLmax(S) was chosen for
the comparison as the FAB model does not produce values for CL(A) but critical load
functions for S and N (see Figure 4).
Figure 21 > Comparison of the acidity critical load values obtained with the SSWC model and CLmax(S)
output from the FAB model for 19 sites for which water chemistry is available (see also Table 16).
CL(A) (SSWC) (eq/ha/yr)
2000
1600
1200
800
400
0
0
400
800
1200
1600
2000
CLmax(S) (FAB) (eq/ha/yr)
Figure 21 shows that the SSWC critical loads are generally higher than the corresponding
values for CLmax(S). Since in both models the same runoff and critical ANC limit have
been used, the difference must be explainable by the difference in base cation inputs to
the catchment (deposition, weathering, uptake), which is used in the generalised FAB
model, and the observed base cation flux leaving the lake, which determines the results of
the SSWC model. A comparison between the net input flux (area weighted BCnet =
BCdep–Cldep+BCw–BCu) and the output flux (average Q•[BC–Cl]) is shown in Table 16
and illustrated in Figure 22.
4
55
> Results and Discussion
Figure 22 shows that the measured flux of base cations leaving the lake is for about half
of the catchments considerably larger than the (mostly) modelled net input, i.e. deposition
plus weathering minus net uptake. There could be several reasons for this: Deposition
and/or weathering rates are underestimated (the net uptake flux in these high alpine
catchments is certainly small) or (the averages of) the measurements do not represent a
true annual average. In any case, this discrepancies warrant further investigations.
Table 16 > Critical loads and element net in and output fluxes for 19 lakes for which FAB-results and
measurements are available (Barbieri 2004).
All fluxes are in eq ha–1 a–1. For lake identification see ‘LakeNr’ and the Annex A.1. Nobs is the
number of observations (samples). Sin and Nin are defined by Equations 2.6 and 2.9, respectively.
LakeNr
Nobs
CLmax(S)
CL(A)
BCnet
Q•[BC-Cl]ave
Sin
64
13
67
7
76
7
77
7
79
81
Q•[S]ave
Nin
Q•[S]ave
961.4
740.1
1258.6
1218.0
485.3
1242.4
864.7
2152.2
380.0
530.4
470.8
378.0
440.1
1463.3
574.5
319.7
771.1
929.4
1089.5
262.5
1588.7
601.2
1472.2
429.8
736.1
513.9
279.6
2240.2
339.0
940.7
351.9
225.8
6
361.3
1062.3
7
1229.5
1487.5
691.0
1591.9
340.0
668.4
465.5
288.4
1545.6
2238.2
439.3
1023.5
589.6
331.1
84
7
513.5
667.5
88
7
457.3
1222.0
866.0
1218.4
457.9
660.7
500.3
433.4
736.3
1669.5
375.2
398.1
462.1
421.0
89
7
936.9
1598.5
92
7
730.8
501.2
1253.1
2497.0
497.8
1177.5
652.1
416.6
1003.9
878.4
375.8
338.3
465.3
302.6
93
11
1124.6
98
7
553.0
590.4
1460.8
1150.8
535.9
573.1
747.0
627.6
761.9
879.4
1270.2
438.6
454.7
575.3
102
7
777.7
507.6
771.5
1119.4
1341.0
568.2
599.3
807.9
529.4
104
11
535.3
106
7
727.9
484.1
898.4
1053.4
617.4
665.3
844.3
606.5
1771.8
1056.2
2423.3
579.3
797.0
731.0
367.5
109
7
639.0
208
7
475.8
742.3
947.5
1146.0
508.6
497.6
752.2
155.3
1056.3
818.4
1608.8
408.4
560.9
612.1
457.6
210
7
572.5
222
7
287.4
727.2
874.6
1174.3
515.6
529.6
732.3
281.4
314.0
667.2
809.1
439.3
654.5
504.2
350.7
56
Critical Loads of Acidity for Alpine Lakes FOEN 2007
Figure 22 > Comparison between net base cation input flux and average measured BC output flux for the
19 lakes studied.
measured Q*[BC]ave (eq/ha/yr)
2500
BC in- and output fluxes
2000
1500
1000
500
0
0
500
1000
1500
2000
2500
Net BC input (eq/ha/yr)
Figure 23 > Net (modelled) input and measured average output fluxes of sulphate and total inorganic nitrogen for the 19 lakes studied (averages
2000–2003).
S in- and output fluxes
1600
measured Q*[N]ave (eq/ha/yr)
measured Q*[S]ave (eq/ha/yr)
1600
1200
800
400
0
0
400
800
1200
Net S input (eq/ha/yr)
1600
N in- and output fluxes
1200
800
400
0
0
400
800
1200
Net N input (eq/ha/yr)
Sulphur and nitrogen deposition are not used in the calculation of critical loads. Nevertheless, it is of interest to compare also input-output fluxes for sulphur and nitrogen compounds. Such a comparison is illustrated in Figure 23 (see also Table 16), for which as S
1600
4
> Results and Discussion
and N deposition fluxes the mean of the available 1995 and projected 2010 depositions
was used to make them compatible with the 2000–2003 average concentrations.
Figure 23 (left panel) shows that the amount of sulphur leaving the catchments is for most
of the sites (much) larger than the amount deposited (minus a small fraction modelled to
be retained in the lake). This could be due to:
a) an underestimate of the deposition at certain sites or
b) the computed average concentration in the lake not being representative of the annual
mean,
c) the additional release of sulphate from geological sources in some of the catchments
(e.g. pyrite, FeS, which could release sulphur during weathering) and
d) the release of previously adsorbed sulphate following the reductions of S emissions
and depositions since 1980 (see Figure 12), and/or
e) the delay of water reaching the lake because of retention in the terrestrial catchment,
which can be up to several decades (see Chapter 2.4). This would mean that a small
part of the high S depositions in the 1980ies would reach the lake nowadays.
Points c) and d) are supported by the results of a trend-analysis carried out by Steingruber and Colombo (2006) for the same lakes. They show that the trend in sulphate concentrations between 1980 and 2004 is significantly negative in only 14 out of 20 lakes.
In the presence of S sources in the catchments, for both the Henriksen and FAB approach
the model formulation should be revised.
Figure 23 (right panel) shows that in some catchments there is more input of total inorganic N (nitrate plus ammonium) than is leaving via runoff, but the discrepancies are
much less pronounced than for sulphur. In fact is not surprising at all that the N input is
be larger than the measured output, since in the modelling of the N sinks only a small
long-term sustainable immobilisation is assumed, whereas present N immobilisation
could be considerably larger.
57
Critical Loads of Acidity for Alpine Lakes FOEN 2007
5 > Concluding Remarks
An attempt has been made to improve the calculation of critical loads for Swiss highalpine lakes by explicitly estimating the weathering of base cations in the terrestrial
catchment. This was done by combining a hydrological model, which estimates the flow
paths through the catchment, with weathering calculations of individual lithological units,
resulting in an overall catchment weathering rate. The First-order Acidity Balance (FAB)
model was modified to accept these weathering rates as input, thus making it fully compatible with the widely used Simple Mass Balance (SMB) model for soil profiles. In
contrast to the SSWC (‘Henriksen’) model the FAB model fully incorporates nitrogen
processes and thus also allows assessing a catchment’s sensitivity to N acidity.
The critical loads obtained for the 100 lakes have a median value of about 570 eq ha–1 a–1
for CLmax(S) and of about 800 eq ha–1 a–1 for CLmax(N), with the most sensitive below 100
eq ha–1 a–1. Critical loads of S thus calculated were compared with those from the SSWC
model and found to be in the same range, albeit somewhat lower than the SSWC values.
In this comparison it has to be kept in mind that the calculations of critical loads with the
SSWC model depend on the water quality measurements chosen (date of sampling,
averages taken, etc.), whereas the FAB model uses only time-independent data (catchment characteristics) as input. As a quality check, catchment input-output fluxes for S, N
and base cations (BC) have also been calculated. The output fluxes (runoff) of base
actions and especially sulphur are presently (2000–2003 average) higher the corresponding input fluxes (deposition plus weathering minus sinks such as net uptake). For nitrogen
the results were the opposite. Whereas this is not surprising for N, it is less clear in the
case of S and BC. Many possible reasons were identified, some of them relating to the
lack of input data (e.g., sulphate sources in the terrestrial catchment), others due to the
inherent simplicity of the critical load models (e.g., neglecting episodes such as spring
snowmelt and runoff peaks).
Overall, the new methodology has the advantage of (a) being more process-oriented (and
thus easier to modify/improve), (b) differentiating better between catchments, and (c)
allowing the comparison with S and N depositions. Nevertheless, further improvements,
for example in the details of catchment geology, would be desirable. Also, the modelling
could be refined, e.g., by taking into account time delays between deposition and leaching
to the lake due to long travelling times of ions in the bedrock. Any improvement, however, will depend on the priority given to such a tool for aiding assessing emission reduction, both on a national and international level.
58
5
> Concluding Remarks
> Acknowledgements
This study was requested and financed by the Federal Office for the Environment
(FOEN). We would like to thank Beat Achermann (FOEN) for his helpful support
throughout the project and Dr. Niklaus Waber from the Institute of Geological Science,
University of Bern, for assistance in hydrology and geochemical modelling. We would
also like to thank Dr. Alberto Barbieri and Dr. Sandra Steingruber (Canton Ticino) for
supplying the monitoring data and helpful comments as well as Dr. Rosario Mosello and
his team (C.N.R - Institute of Ecosystem Study, Verbania Pallanza, Italy) for the fruitful
discussions.
59
Critical Loads of Acidity for Alpine Lakes FOEN 2007
> Annexes
>
A1 List of Lakes
List of the 102 lakes. Two lakes could not be modelled with genFAB: ID=63 (downstream lake) and ID=217 (no weathering rate). X and Y are coordinates in the national
system. Z is the altitude above sea level. AL is the area of the lake (water surface) and
AC the area of the whole catchment. 20 lakes with water chemistry measurements
during 2000–2003 have a OBS_ID. Q is the runoff and BCw,C are the calculated average weathering rates of the catchments in keq ha–1 a–1.
60
61
> Annexes
Table 17 > List of lakes.
ID
NAME
X [m]
694475
Y [m]
2
Lai da Tuma
165335
3
Lai Urlaun
695436
5
Lai Verd
702572
9
no-name
723520
10
Lai Blau
702526
11
no-name
694982
12
Selvasee
732206
15
Lago Retico
711270
16
no-name
696399
17
Ampervreilsee
731267
159248
18
Lago d’Orsino
684387
19
no-name
696720
20
Laghi d’Orsirora
683450
21
Lago di Froda
694304
22
no-name
683988
23
no-name
685725
24
Lago di dentro
696350
25
Lago della Valletta sup.
683218
26
Laghi della Valletta
27
Curaletschsee
28
Lago di scuro
30
Lago dello Stabbio
31
Z [m]
AL [ha] AC [ha]
OBS_ID
Q [m]
BCw,C
2578
2.54
201.3
1.43
0.505
164634
2333
1.54
37.1
1.83
0.336
162606
2798
4.11
51.2
1.98
0.406
161289
2744
0.93
28.0
1.77
1.224
161006
2559
5.30
64.7
1.72
0.445
161030
2432
2.05
18.1
1.57
0.158
160692
2466
2.49
85.1
1.44
0.857
159452
2483
9.22
93.1
1.49
0.555
159237
2776
1.34
15.0
1.71
1.062
2605
0.73
63.3
1.57
0.714
158877
2437
4.10
100.2
1.59
0.497
158908
2681
2.32
36.9
1.72
1.205
158553
2513
3.91
29.8
1.61
0.219
158619
2589
0.91
33.3
1.35
0.557
158416
2414
1.64
47.2
1.49
0.335
158359
2196
2.15
127.9
1.38
0.147
158359
2545
0.57
14.3
1.74
0.156
158191
2536
0.79
21.3
1.54
0.297
683626
158067
2499
2.40
21.9
1.66
0.288
730256
158056
2650
3.30
208.3
1.65
1.251
696555
157612
2528
7.19
42.6
1.59
0.279
697627
157324
2437
8.11
36.6
1.53
0.618
no-name
690725
157333
2592
0.35
61.1
1.32
0.449
33
Lago della Piazza
686418
156733
2210
3.54
98.3
1.50
0.439
35
Lago di Stabiello
694522
156589
2257
0.94
46.0
1.60
3.493
36
no-name
686888
156462
2213
1.57
120.5
1.63
0.494
37
Lago di Tom
695942
156218
2221
9.32
195.6
1.59
1.528
38
Lago di dentro
699560
156280
2420
6.58
55.3
1.18
0.866
41
no-name
729006
156001
2841
0.62
62.8
1.68
1.137
43
no-name
729872
155945
2840
2.87
39.4
1.75
0.319
44
di Lago
693972
155382
2127
3.37
55.9
1.55
1.451
46
Lago dei Campanit
702522
155105
2467
0.83
23.4
1.92
0.406
47
Lago dei Canali
703424
154277
2383
0.75
266.1
1.81
0.883
48
Lago Pécian
701205
154023
2483
1.35
24.4
1.62
0.814
49
Lago Chiera Grande
701371
153091
2499
9.46
73.4
1.63
0.436
50
no-name
727832
153046
2696
2.30
49.9
1.99
0.472
51
Lago di Cari
705817
152275
2383
1.35
49.4
1.37
0.554
53
Laghetto Moesola
732995
150652
2212
6.80
122.2
1.62
0.571
54
Lago di Ravina
691715
150374
2140
1.84
96.8
1.71
1.135
55
no-name
694101
149816
2202
0.89
118.6
1.34
1.911
62
Critical Loads of Acidity for Alpine Lakes FOEN 2007
ID
NAME
X [m]
Y [m]
Z [m]
AL [ha] AC [ha]
OBS_ID
Q [m]
BCw,C
57
Lago di Prato
693223
148322
2222
2.73
55.5
1.13
2.014
60
Lago di Val Sabbia
686313
148699
2512
1.40
49.3
1.43
0.862
63
Laghetto Inferiore
688630
147849
2230
5.59
57.2
1107
1.39
0.861
1108
1.59
1.038
1.67
0.844
1.80
0.341
1.93
0.533
64
Laghetto Superiore
688009
147804
2314
8.30
124.5
65
Lago del Naret Piccolo
685894
147552
2522
2.32
118.0
66
Lago Cristallina
685651
146884
2474
0.68
19.9
67
Lago della Capannina Leit
698541
146795
2405
2.72
52.4
68
Lago Sfundau
683405
146255
2584
12.91
196.9
1.65
0.950
70
Lago Laiozz
685767
146299
2566
1.46
111.2
1.65
3.612
71
Lago del Corno
673049
145945
2608
2.54
53.2
1.66
2.031
72
Lagh di Stabi
730155
146025
2502
3.47
70.7
1.38
0.507
73
Lago della Zota
687160
145916
2373
1.04
31.6
1.81
0.401
74
Lagh Doss
735695
145754
1696
1.75
41.9
1.52
0.701
76
Lago di Morghirolo
698192
145205
2462
11.89
166.1
1303
1.67
0.797
77
Lago Nero
684556
144804
2507
12.70
72.3
1116
1.76
0.419
78
Lago dei Matörgn
680115
143823
2654
2.47
92.6
1.71
0.513
79
Lago della Froda
686004
143772
2542
1.98
67.3
1.66
0.453
80
Lago del Zött
681832
143034
2569
14.60
929.9
1.73
1.211
81
Lago di Mognola
696084
142870
2386
5.41
197.3
1106
1.63
1.244
84
Lago Barone
701005
139849
2516
6.62
50.8
1205
1.85
0.576
85
Lagh de Trescolmen
733606
139968
2383
1.95
153.9
1.60
1.132
86
Laghetto
704731
139197
2082
16.00
183.3
1.65
0.744
88
Laghetti d’Antabia
681055
137671
2337
6.85
81.7
1120
1.46
0.527
89
Lago dei Porchieirsc
700433
136895
2370
1.46
43.1
1204
1.63
0.914
92
Laghi della Crosa
680335
136082
2366
16.95
193.8
1121
1.47
0.830
93
Lago di Tomè
696320
135380
2098
5.76
294.3
1104
1.71
1.109
94
Lago
721787
134679
2223
1.52
29.1
1.83
0.290
95
Lago di Cava
722737
134548
2276
0.52
65.7
1.95
0.737
98
Lago d Orsalia
683514
132567
2299
2.63
40.7
1.68
0.631
99
Lago d’Efra
708248
132520
2144
1.84
97.9
1.85
0.810
100
Lago Coca
697367
129325
2083
0.62
18.5
1.47
0.317
101
Lago di Canee (Claro)
723905
128569
2378
2.47
32.9
1.84
0.367
102
Lago da Sascòla
687569
126239
1979
3.19
89.7
1130
1.75
0.801
104
L. del Starlaresc da Sgi
702923
125632
1979
1.07
23.4
1202
1.85
0.496
106
Lago d’Alzasca
688387
124656
1989
10.42
110.3
1131
1.74
0.760
109
Laghi dei Pozzöi
679620
124198
2092
1.11
33.3
1125
1.58
0.677
110
Lago Gelato
678268
123460
2243
0.76
25.2
1.58
0.505
201
Lago di Fieud
686361
154780
2316
0.26
36.6
1.59
0.587
202
Lago Tremorgio
698324
148301
2199
38.54
495.1
1.64
1.950
1304
1115
1123
203
Lago Chiera Piccolo
701658
152770
2381
1.26
11.9
1.55
0.208
204
Lago Cadagno
697688
156123
2118
26.22
209.8
1.44
1.568
205
Laghetti di Taneda
696382
156996
2364
0.22
8.4
1.59
0.489
63
> Annexes
ID
>
NAME
X [m]
Y [m]
Z [m]
AL [ha] AC [ha]
OBS_ID
Q [m]
BCw,C
206
Lago di Formazzöö
680094
133423
2483
2.58
70.1
1.66
0.663
207
Lago del Piatto
696509
141769
2346
0.48
31.2
1.42
0.528
208
Schwarzsee (Melo/Poma)
681966
132180
2442
0.32
23.6
1.72
0.568
209
Lago della Cavegna
680642
122505
2059
0.54
20.4
1.79
0.477
210
Lago di Sfille
681508
124206
2079
2.82
62.9
1.55
0.599
211
Lago del Pèzz
682686
124272
2126
1.30
31.0
1.82
0.596
212
Lago di Spluga
694948
130757
2083
0.36
27.9
1.84
0.532
213
Laghetto Pianca
701532
125847
2009
0.71
22.3
1.52
0.389
214
no-name
673821
149063
2710
0.56
50.6
1.80
0.861
215
no-name
675960
157309
2761
1.84
36.8
1.98
0.906
216
no-name
677469
149365
2507
0.58
27.4
1.41
0.670
217
no-name
680624
155144
2711
0.70
246.8
1.92
218
Lago del Forna
687075
149091
2468
0.71
52.3
1.47
1.402
1124
1128
219
Lago Scuro
687522
148094
2306
3.11
18.5
1.81
0.371
220
no-name
689678
155930
2396
0.41
9.7
1.51
1.413
221
no-name
700965
141831
2582
0.76
59.1
2.04
0.677
222
Laghetto Gardiscio
701275
142678
2629
1.14
12.1
1.93
0.336
223
no-name
680728
138042
2238
0.78
35.8
1.48
0.851
224
no-name
681050
136350
2369
9.43
209.2
1.47
1.252
225
Laghi di Motella
708790
151128
2339
0.93
35.3
1.79
0.320
1302
A2 FORTRAN subroutine genFAB
In Chapter 2.2 a critical load function has been derived. The computation of the distinct
nodes of that critical load function with the generalised FAB model for a catchment
with given characteristics can be carried out with the aid of following the FORTRAN
subroutine:
subroutine genFAB (numLC,LCfrc,sfac,nfac,rhoS,rhoN,Niv,Nuv,fdev,
&
Lcrit,nCL,CLNv,CLSv)
!
!
Returns the nCL distinct(!) nodes of the piecewise linear CL function
!
in (CLNv(n),CLSv(n),n=1,nCL) computed with the generalised FAB model.
!
Note: CLNv(1)=0,CLSv(1)=CLmaxS and CLNv(nCL)=CLmaxN,CLSv(nCL)=0.
!
!
Input:
!
numLC … number of land cover (LC) classes (incl. lake!)
!
LCfrc(j) … fraction of LC j (LCfrc(1)+..+LCfrc(numLC)=1)
!
sfac(j) … S-deposition factor on LC j; sfac(j)*Sdep=Sdep,j
!
nfac(j) … N-deposition factor on LC j; nfac(j)*Ndep=Ndep,j
!
rhoS … S in-lake retention fraction (0<=rhoS<=1)
!
rhoN … N in-lake retention fraction (0<=rhoN<=1)
!
Niv(j) … net N immobilisation on LC j
!
Nuv(j) … net N uptake (N removal) on LC j
!
fdev(j) … denitrification fraction on LC j
Critical Loads of Acidity for Alpine Lakes FOEN 2007
!
!
!
!
!
!
!
Lcrit … ‘critical’ term (containing BC fluxes and ANClim)
Output:
nCL … number of distinct nodes (<=numCL+2)
CLNv(l) … N-values of nodes (l=1(1)nCL)
CLSv(l) … S-values of nodes (l=1(1)nCL)
implicit
none
!
integer, intent(in) :: numLC
real, intent(in) :: LCfrc(*), sfac(*), nfac(*), Niv(*), Nuv(*)
real, intent(in) :: fdev(*), rhoS, rhoN, Lcrit
integer, intent(out) :: nCL
real, intent(out) :: CLNv(*), CLSv(*)
!
integer
:: i, k
real
:: x0, Nold, Nk, aS
integer, allocatable :: indx(:)
real, allocatable :: NiNuv(:), aNv(:), LNv(:)
!
allocate (indx(numLC),NiNuv(numLC))
do k = 1,numLC
NiNuv(k) = (Niv(k)+Nuv(k))/nfac(k)
end do
call indexr (numLC,Ninuv,indx)
!
allocate (aNv(0:numLC),LNv(0:numLC))
aS = 0.; aNv(0) = 0.; LNv(0) = 0.
do k = 1,numLC
aS = aS+LCfrc(k)*sfac(k)
i = indx(k)
aNv(k) = aNv(k–1)+LCfrc(i)*(1.–fdev(i))*nfac(i)
LNv(k) = LNv(k–1)+LCfrc(i)*(1.–fdev(i))*(Niv(i)+Nuv(i))
end do
aS = (1.–rhoS)*aS
aNv = (1.–rhoN)*aNv
LNv = (1.–rhoN)*LNv
!
CLNv(1) = 0.
CLSv(1) = Lcrit/aS ! = CLmaxS
nCL = 1
Nold = NiNuv(indx(1))
if (Nold > 0.) then ! lake Nu+Ni> 0!
CLNv(2) = Nold
CLSv(2) = CLSv(1)
nCL = 2
end if
do k = 1,numLC
if (k < numLC) then
Nk = NiNuv(indx(k+1))
else
Nk = 1.e30 ! infinity
end if
if (Nk <= Nold)
cycle ! skip identical node
x0 = (LNv(k)+Lcrit)/aNv(k)
nCL = nCL+1
if (x0 <= Nk) then
CLNv(nCL) = x0 ! = CLmaxN
CLSv(nCL) = 0.
exit
else
CLNv(nCL) = Nk
CLSv(nCL) = (x0-Nk)*aNv(k)/aS
end if
Nold = Nk
end do
deallocate (indx,NiNuv,aNv,LNv)
return
end subroutine genFAB
The above routine calls the subroutine indexr, which indexes a vector vec(1:n), i.e.
returns the vector indx(1:n) such that vec(indx(j)) is in ascending order for j=1,…,n.
64
> Annexes
This routine is identical to the subroutine indexx in Press et al. (1992). If the inputs are
such that (Ni,j+Nu,j)/nj (see Equation 2.17 in Chapter 2.2) is in ascending order for
j=1,…, numLC, then the routine indexr is not needed and indx(j) can be replaced by j
everywhere in the above subroutine.
65
66
Critical Loads of Acidity for Alpine Lakes FOEN 2007
> Indexes
Glossary
ANC
acid neutralising capacity (= sum of base cation minus
strong
acid anions)
Bc
(sum of) base cations taken up by vegetation
(= Ca2+ + Mg2+ + K+)
BC
(sum of) base cations
2+
2+
+
+
(= Bc + Na+ = Ca + Mg + K + Na )
release of BC by weathering of minerals in the soil or
BCw
bedrock
average BCw of a catchment
BCw,C
CCE
Coordination Centre for Effects
CL(A)critical loads of acidity
CLmax(S) maximum critical load of sulphur
CLmax(N) maximum critical load of nitrogen
eq
equivalents = moles of charges (=molc)
EMEP
Co-operative Programme for Monitoring and Evaluation of the
Long-range Transmission of Air Pollutants in Europe
FAB
First-order Acidity Balance model
LRTAP
(Convention on) Long-range Transboundary Air Pollution
SMB
Simple Mass Balance (model)
SSWC
Steady-State Water Chemistry (model)
UNECE
United Nations Economic Commission for Europe
Figures
Figure 1
Differences in the distribution of catchment weathering rates
and critical loads of acidity of 45 high-alpine lakes in the Ticino
area (EKG, 1997).
Figure 2
Map of the 100 lakes modelled with genFAB. The 19 lakes with
water chemistry measurements during 2000–2003 are shaded
in blue color.
13
15
Figure 3
Flowchart of the main procedural steps in this study.
17
Figure 4
Piece-wise linear critical load function of S and acidifying N for a
lake as defined by catchment properties.
23
Figure 5
Head distribution isolines and three particle paths in the Lago
Superiore (left) and Lago Inferiore (right) area. The coloured
areas represent lithology classes: red = gneiss, blue =
amphibolite, green = quarterny cover.
31
Figure 6
General scheme of the rock-water interaction model MPATH.
34
Figure 7
Ion concentrations in rock-water for Leucocratic Crystalline
Rocks (top) and Melanocratic Crystalline Rock Types (bottom). Y
is the best-fit function for BC (dotted line).
36
Figure 8
Ion concentrations in rock-water for Amphibole Bearing Rocks
(top) and Carbonate Rock Types (bottom). Y is the best-fit
function for BC (dotted line).
37
Figure 9
Ion concentrations in rock-water for quarternary cover. y is the
best-fit function for BC.
38
Figure 10
Scheme of the simplified flow path calculation (left)as well as
the calculated total areas (AREAL) and the mean flow path
lengths (DISTL) per lithology-class in catchment No. 64 (Lago
Superiore) (right).
40
Figure 11
Map of modelled N deposition for the year 1995.
43
Figure 12
Cumulative frequency distributions of S and N deposition for the
100 catchments in 1980, 1995 and 2010. Bc is the timeindependent deposition of base cations.
45
Figure 13
Map of precipitation rates, average 1961–1999 (FOWG 2000).
46
Figure 14
Cumulative frequency distributions of mean precipitation (P),
evapotranspiration (ET) and runoff (Q) for the 100 catchments.
47
Figure 15
Different types of geological maps (supplied by swisstopo,
2006). Geological Atlas (top), special geological maps (middle)
and original geological maps (bottom).
48
Figure 16
Digitized lithological units in the catchment of lake No 77 (Lago
Nero).
49
67
> Verzeichnisse
Figure 17
Cumulative frequency distribution of the average weathering
rates (BCw,C) for the 100 catchments. Units: eq ha–1 a–1.
Figure 18
Critical load functions of acidifying N and S for 100 lakes as
computed with the generalised FAB model. Also shown are the
respective pairs of N and S depositions (points) in the 100
catchments for the year 1995.
Figure 19
Cumulative distribution functions of CLmax(S) (left) and CLmax(N)
(right) of the 100 lakes.
Figure 20
Cumulative distribution functions of the exceedances of the
acidity critical loads for the 100 lakes shown in Figure 18 for the
years 1980 (dashed line), 1995 (solid line) and 2010 (thin solid
line).
33
Table 7
Maximum total daily flow and travel times through gneiss layer
for different gradients.
33
Table 8
Travel times through gneiss layer for different porosities.
34
Table 9
Input parameters for the Model MPATH.
35
Table 10
Mean values of area (AREAL), distance of the flow path (DISTL)
and hydraulic gradient (dhL/dlL) per lithology-class (L) in the
catchment No. 77 (Lago Nero).
41
Table 11
Linear regression models for calculating ion concentrations in
precipitation in the canton Ticino, based on measurements from
1993 to 1998 (SAEFL 2001).
42
Table 12
Deposition of S, NOy and NHx in 1980, 1995 and 2010 for the
EMEP-cell 24/13 (from Schöpp et al. 2003) and derived
deposition ratios normalised to 1995.
44
Table 13
Mean values of area (AREA), distance of the flow path (DIST) and
hydraulic gradient (dh/dl) per lithology-class, averaged over the
100 mapped catchments.
49
Table 14
Statistics of the land-use categories occurring in the 100
mapped catchments.
51
Table 15
Values for uptake, immobilization and denitrification used in the
FAB-model application for alpine lakes.
51
Table 16
Critical loads and element net in and output fluxes for 19 lakes
for which FAB-results and measurements are available (Barbieri
2004).
55
Table 17
List of lakes.
61
50
52
53
53
Figure 21
Comparison of the acidity critical load values obtained with the
SSWC model and CLmax(S) output from the FAB model for 19
sites for which water chemistry is available (see also Table 16).
54
Figure 22
Comparison between net base cation input flux and average
measured BC output flux for the 19 lakes studied.
56
Figure 23
Net (modelled) input and measured average output fluxes of
sulphate and total inorganic nitrogen for the 19 lakes studied
(averages 2000–2003).
Table 6
Travel times through gravel layer for different porosities.
56
Tables
Table 1
Workflow for calculating and mapping critical loads.
14
Table 2
Hydrological characteristics of three distinct lithology units.
27
Table 3
Calculation of infiltrations for a one-layer system.
Units are m³ d–1.
29
Table 4
Estimated infiltrations for a three-layer system. Units are m³ d–1.
30
Table 5
Maximum total daily flow through gravel layer for different
gradients.
33
68
Critical Loads of Acidity for Alpine Lakes FOEN 2007
References
Baker LA, Brezonik PL (1988) Dynamic model of in-lake alkalinity
generation. Water Resources Research 24: 65-74
Barbieri A, and Pozzi S (2001) Acidifying deposition. Southern
Switzerland, Environmental Documentation - Air, Vol. 134, Swiss
Agency for the Environment, Forests and Landscape (SAEFL), Bern, 113
pp
Barbieri A (2004) Results of water chemistry measurements for 20
alpine lakes in the canton of Ticino, pers. comm, 29.1.2004
Baumgartner A, Reichel E, Weber G (1983) Der Wasserhaushalt der
Alpen. Oldenbourg Verlag, München, Wien
Brakke DF, Henriksen A, Norton SA (1990) A variable F-factor to explain
changes in base cation concentrations as a function of strong acid
deposition. Verh. Internat. Verein. Limnol. 24: 146-149
Boggero A, Marchetto A, Barbieri A, Sassi A, Conedera M, Tartari GA,
Mosello R (1996) Idrochimica dei laghi alpini del canton Ticino (alpi
centrali) in relazione con la chimica delle precipitazioni. Volume 57,
Documenta dell’ Istituto Italiano di Idrobiologia, Pallanza, Italy
De Jong JE (1996) The methodology for the calculation of critical loads
of acidity for high altitude lakes – application on lakes in Canton Ticino
(Switzerland). Technical Report: 44, Istituto Italiano di Idrobiologia,
Pallanza, Italy
Dillon PJ, Molot LA (1990) The role of ammonium and nitrate retention
in the acidification of lakes and forested catchments. Biogeochemistry
11: 23-43
EKG (1997) Reevaluation kritischer Säureeinträge für
Oberflächengewässer – Konzeptstudie. Eggenberger & Kurz GeoScience, Interim Report, Bern
Fetter CW (1994) Applied Hydrogeology. Macmillan, New York
FOEFL (ed) (1994) Critical loads of acidity for forest soils and alpine
lakes – steady-state mass balance method. Federal Office of
Environment, Forests and Landscape Berne, Switzerland, Environmental
Series Air, 238: 68pp
FOWG (1999) Mean Annual Actual Evaporation 1973–1992. Hydrological
Atlas of Switzerland, Federal Office for Water and Geology (FOWG), Bern
FOWG (2000) Precipitation Maps 1961–1999. Hydrological Atlas of
Switzerland, Federal Office for Water and Geology (FOWG), Bern, based
on monitoring data from MeteoSwiss, Zürich
Freeze RA, Cherry JA (1979) Groundwater. Englewood Cliffs: PrenticeHall
Henriksen A (1984) Changes in base cation concentrations due to
freshwater acidification. Verh. Internat. Verein. Limnol. 22: 692-698
Henriksen A, Lien L, Traaen TS (1990) Critical loads for surface waters –
chemical criteria for inputs of strong acids. Norwegian Institute for
Water Research Oslo, Norway, Acid Rain Research Report 22: 45pp
Henriksen A, Forsius M, Kämäri J, Posch M, Wilander A (1993)
Exceedance of critical loads for lakes in Finland, Norway and Sweden:
Reduction requirements for nitrogen and sulfur deposition. Norwegian
Institute for Water Research Oslo, Norway, Acid Rain Research Report
32: 46 pp
Henriksen A, Posch M (2001) Steady-state models for calculating
critical loads of acidity for surface waters. Water, Air and Soil Pollution:
Focus 1: 375-398
Hettelingh J-P, De Vries W (1991) Mapping Vademecum. RIVM Report
No. 259101002, Coordination Center for Effects, National Institute of
Public Health and Environmental Protection, Bilthoven, The Netherlands
Hettelingh J-P, Downing RJ, De Smet, PAM (eds) (1991) Mapping
Critical Loads for Europe. CCE Technical Report No. 1, RIVM Report No.
259101001, Coordination Center for Effects, National Institute of Public
Health and Environmental Protection, Bilthoven The Netherlands
Hindar A, Posch M, Henriksen A, Gunn J, Snucins E (2000) Development
and application of the FAB model to calculate critical loads of S and N
for lakes in the Killarney Provincial Park (Ontario, Canada). Report SNO
4202-2000, Norwegian Institute for Water Research, Oslo, Norway, 40
pp
ICP-Waters (ed) (2000) The 12-year Report: Acidification of Surface
Water in Europe and North America; Trends biological recovery and
heavy metals. Norwegian Institute for Water Research (NIVA), Oslo, ICP
Waters Report 52/2000, 115pp
Kaste Ø, Dillon PJ (2003) Inorganic nitrogen retention in acid-sensitive
lakes in southern Norway and southern Ontario, Canada – a comparison
of mass balance data with and empirical N retention model.
Hydrological Processes 17: 2393-2407
Kelly CA, Rudd JWM, Hesslein RH, Schindler DW, Dillon PJ, Driscoll CT,
Gherini SA, Hecky RE (1987) Prediction of biological acid neutralization
in acid-sensitive lakes. Biogeochemistry 3: 129-140
Lichtner PC (1985) Continuum model for simultaneous chemical
reactions and mass transport in hydrothermal systems. Geochim.
Cosmochim. Acta 49: 779-800
Lichtner PC (1988) The quasi-stationary state approximation to coupled
mass transport and fluid-rock interaction in a porous medium. Geochim.
Cosmochim. Acta 52: 143-165
69
> Verzeichnisse
Lichtner PC (1992) Time–space continuum description of fluid/rock
interaction in permeable media. J. Geophys. Res. 28, 3135-3155
LSA (1999) COLumn Alpine Lake Chemistry - COL-ALC 1997 –
Chemistry, physics and hydrobiology. Laboratorio Studi Ambientali
(LSA), Lugano/Bellinzona, Switzerland and Federal Office of
Environment, Forests and Landscape (FOEFL), Bern, Switzerland,
Interim Report, February 1999
Nilsson J, Grennfelt P (1988) Critical Loads for Sulfur and Nitrogen.
Nordic Council of Ministers, Miljørapport 1988:15, 418 pp
Posch M, Kämäri J, Forsius M, Henriksen A, Wilander A (1997)
Exceedance of critical loads for lakes in Finland, Norway and Sweden:
Reduction requirements for acidifying nitrogen and sulfur deposition.
Environmental Management 21(2): 291-304
Press WH, Teukolsky SA, Vetterling WT, Flannery BP (1992) Numerical
Recipes in FORTRAN (2nd ed.) Cambridge University Press, 963 pp
Rapp L, Bishop K (2003) Modeling surface water critical loads with
PROFILE: Possibilities and challenges. Journal of Environmental Quality
32: 2290-2300
Rihm B, Kurz D (2001) Deposition and Critical Loads of Nitrogen in
Switzerland. Water, Air and Soil Pollution 130, 1223-1228
Steingruber S, Colombo L (2006) Impacts of Air Pollution on Alpine
Lakes and Rivers – Monitoring Results from 1980 to 2004. Ed: Federal
Office for the Environment (FOEN), State of the environment No. …,
Berne, in print.
Sverdrup H, De Vries W, Henriksen A (1990) Mapping Critical Loads: A
guidance manual to criteria, calculations, data collection and mapping.
In: UN ECE Annex to chapter 4 of the Mapping Manual. Also published
as Miljörapport 1990: Nordic Council of Ministers, Copenhagen
swisstopo (ed) (1984) Atlas of Switzerland 1:500’000 (map number 7A:
soils, overview). Federal Office of Topography, Wabern-Bern,
Switzerland, 2nd Edition
swisstopo (2006) Geological Atlas of Switzerland, Special Geological
Maps and Original Geological maps. Maps supplied by the Federal Office
of Topography (swisstopo)
Thimonier A, Schmitt M, Waldner P, Rihm B (2005) Atmospheric
deposition on Swiss Long-term Forest Ecosystem Research (LWF) plots.
Environmental Monitoring and Assessment 104: 81-118
Thöni L, Brang P, Braun S, Seitler E, Rihm B (2004) Ammonia
monitoring in Switzerland with passive samplers: patterns, determinants
and comparison with modelled concentrations. Environmental
Monitoring and Assessment 98: 95-107
Schöpp W, Posch M, Mylona S, Johansson M (2003) Long-term
development of acid deposition (1880-2030) in sensitive freshwater
regions in Europe. Hydrology and Earth System Sciences 7(4): 436-446
UBA (ed) ( 2004) Manual on methodologies and criteria for Modelling
and Mapping Critical Loads & Levels and Air Pollution Effects, Risks and
Trends. Convention on Long-range Transboundary Air Pollution.
Umweltbundesamt Berlin, UBA Texte 52/04, distributed at
SAEFL (ed) (2001) Acidifying Deposition – Southern Switzerland.
Environmental Documentation No. 134. Swiss Agency for the
Environment, Forests and Landscape (SAEFL), Berne, 113 pp
http://www.icpmapping.org
SAEFL (ed) (2003) Modelling of PM10 and PM2.5 ambient concentrations in Switzerland 2000 and 2010. Environmental Documentation
No. 169, Swiss Agency for the Environment, Forests and Landscape
(SAEFL), Berne
SAEFL (ed) (2004) Modelling of NO2 and benzene ambient concentrations in Switzerland 2000 to 2020. Environmental Documentation No.
188, Swiss Agency for the Environment, Forests and Landscape
(SAEFL), Berne
Spitz K, Moreno J (1996) A Practical Guide to Groundwater and Solute
Transport Modeling. John Willey and Sons, New York
Sposito G (1989) The chemistry of soils. New York, Oxford University.
277p.
Steingruber S (2001) Nutrient transformations in a wetland pond. DISS
ETH No. 13939, Zürich. http://e-collection.ethbib.ethz.ch/ecol-pool/diss/
fulltext/eth13939.pdf
UNECE (1994) Protocol to the 1979 Convention on Long-range
Transboundary Air Pollution on Further Reduction of Sulphur Emissions.
United Nations Economic Commission for Europe, Geneva, Switzerland,
ECE/EB.AIR/40
Wolery TJ, Jackson KJ, Bourcier WL, Bruton CJ, Viani BE, Knauss KG,
Delany JN (1990) Current status of the EQ3/6 software package for
geochemical modelling. In: DC Melchior and RL Bassett (eds): Chemical
Modeling of Aqueous Systems II: Washington D. C., American Chemical
Society Symposium Series 416, pp. 104-116.
Zobrist J, Drewer JJ (1990) Weathering processes in Alpine watersheds
sensitive to acidification. In: M Johannessen, R Mosello and H Barth
(eds): Acidification Processes in Remote Mountain Lakes. Proc. EEC
Workshop, Pallanza, Italy, 20-22 June 1989, Air Pollution Research
Report 20: 149-161
© Copyright 2026 Paperzz