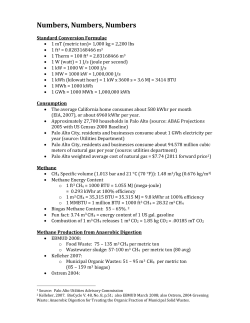
Impact of Differing Cost Recovery Methods: Hypothetical Example Docket No. 4545 Place your chosen image here. The four corners must just cover the arrow tips. For covers, the three pictures should be the same size and in a straight line. Presentation at the Rhode Island Public Utilities Commission Review of Electric Rates Issues Meeting May 14, 2015 Agenda Hypothetical Example of the Impact of Differing Cost Recovery Methods – Jeanne Lloyd Principles of Cost Allocation – Peter Zschokke Update on Non-Wires Alternative DemandLink Pilot – Lindsay Foley 2 Hypothetical Example of the Impact of Differing Cost Recovery Methods 3 Example of the Impact of Differing Cost Recovery Assumptions: $10 million cost recovery amount The cost is eligible for recovery through either the Company’s Energy Efficiency Program or its Infrastructure, Safety, and Reliability (ISR) Plan based on the cost’s characteristics. For Discussion: Does it matter how the Company recovers the cost? From a cost recovery perspective, the cost can be recovered through either mechanism. But from a bill impact perspective, it does matter under what tariff mechanism the cost is recovered. 4 Example of the Impact of Differing Cost Recovery Why does it matter? Because a cost recovered through the Energy Efficiency Program Charge is allocated to rate classes differently than a cost recovered through the ISR Factor. Because the rate design of the Energy Efficiency Program Charge is different than the rate design of the ISR Factor. These two differences will result in differing bill impacts to customers. 5 Comparison: Recovery via EE vs. ISR SUMMARY OF ALLOCATION METHODS Total A-16/60 C-06 G-02 B/G-32 B/G-62 S X-01 Allocation Factors Energy Efficiency (Energy, or kWhs) 40.8% 7.7% 16.3% 26.3% 7.8% 0.9% 0.3% ISR O&M (O&M Allocator) 48.0% 9.8% 15.5% 15.3% 3.7% 7.5% 0.3% ISR CapEx (Rate Base Allocator) 52.8% 9.7% 14.7% 13.8% 3.5% 5.2% 0.3% Allocated Revenue Requirement Energy Efficiency ($000) $10,000 $4,082.1 $766.6 $1,629.3 $2,629.3 $777.2 $85.3 $30.3 ISR-O&M Factor ($000) $10,000 $4,802.2 $982.9 $1,545.5 $1,525.8 $366.4 $748.6 $28.6 ISR-CapEx Factor ($000) $10,000 $5,278.1 $971.0 $1,467.9 $1,382.3 $347.9 $521.4 $31.4 Energy Efficiency (Uniform Charge) $0.00129 $0.00129 $0.00129 $0.00129 $0.00129 $0.00129 $0.00129 ISR-O&M Factor (Class-Specific kWh Charge) $0.00152 $0.00166 $0.00123 $0.00075 $0.01138 $0.00122 $0.00792 $0.00134 Rate Design ISR-O&M Factor (Class-Specific kW Charge) ISR-CapEx Factor (Class-Specific kWh Charge) ISR-CapEx Factor (Class-Specific kW Charge) $0.26 $0.00167 $0.00164 $0.41 $0.44 $0.25 6 Monthly Bill Impacts Rate Class A16- Monthly Usage Increase (EE) Increase (O&M) Increase (Capex) 500 kWh $0.65 0.7% $0.76 0.8% $0.84 0.9% 500 kWh $0.65 0.8% $0.76 0.9% $0.84 1.0% 1,000 kWh $1.29 0.8% $1.66 1.1% $1.64 1.1% 150 kW and 30,000 kWh $38.70 0.7% $36.90 0.7% $57.40 1.1% 60 kW and 30,000 kWh $38.70 0.8% $36.90 0.8% $20.50 0.4% 2,500 kW and 500,000 kWh $645 1.2% $375 0.7% $1,012 1.9% 1,000 kW and 500,000 kWh $645 1.4% $375 0.8% $352 0.8% G62- 15,000 kW and 3,000 MWh $3,870 1.2% $3,900 1.3% $3,750 1.2% Opt Lg Demand 6,000 kW and 3,000 MWh $3,870 1.4% $1,560 0.6% $1,500 0.5% Residential A60Low Income C06Small C&I G02General C&I G32Lg Demand 7 Comparison: Bill Impacts of Recovery through EE vs. ISR Rate Class A16- Monthly Usage EE Impact More (Less) than ISR CapEx Impact EE Impact More (Less) than ISR O&M Impact 500 kWh ($0.19) (0.2%) ($0.11) (0.1%) 500 kWh ($0.19) (0.2%) ($0.11) (0.1%) 1,000 kWh ($0.35) (0.2%) ($0.37) (0.2%) 150 kW and 30,000 kWh ($18.70) (0.3%) $1.80 0.0% 60 kW and 30,000 kWh $18.20 0.4% $1.80 0.0% 2,500 kW and 500,000 kWh ($367.00) (0.7%) $270.00 0.5% 1,000 kW and 500,000 kWh $293.00 0.6% $270.00 0.6% G62- 15,000 kW and 3,000 MWh $120.00 0.0% ($30.00) 0.0% Opt Lg Demand 6,000 kW and 3,000 MWh $2,370.00 0.8% $2,310.00 0.8% Residential A60Low Income C06Small C&I G02General C&I G32Lg Demand 8 Principles of Cost Allocation 9 Principles of Public Utility Rates by James C. Bonbright Rate attributes: simplicity, understandability, public acceptability, and feasibility of application and interpretation Effectiveness of yielding total revenue requirements Revenue (and cash flow) stability from year to year Stability of rates themselves, minimal unexpected changes that are seriously adverse to existing customers Fairness in apportioning cost of service among different consumers (rates based on cost causation) Avoidance of “undue discrimination” Efficiency, promoting efficient use of energy by the customer (e.g. such that utility’s infrastructure and resources are not strained) 10 Allocation of Costs Classifications Demand Energy Demand Allocation Factors Residential Small Commercial & Industrial Customer Energy Allocation Factors Medium Commercial & Industrial Direct Assignment Customer Allocation Factors Large Commercial & Industrial Lighting 11 Recovery and Stability of Revenue Requirement Effectiveness of Yielding Total Revenue Requirement Implications of recovering capital investment through Energy Efficiency Program Company assets not typically recovered through EE Program Recovery of on-going maintenance/replacement of capital investment is complicated if through EE Revenue Stability 12 Fairness/Equity Appropriate cost allocation Comparison of Primary Cost Drivers Customer Demand Energy No undue discrimination 13 Comparison of “Typical Allocators” SUMMARY OF ALLOCATION METHOD Total Allocation Factors Energy (Based on a measure of kWh) Demand (Based on measures of kW) Customer (Based on customer counts) Allocated Revenue Requirement Energy ($000) Demand ($000) Customer ($000) Rate Design Energy (Uniform per kWh Charge) Demand (Converted to Class-Specific kWh Charge) Demand (Class-Specific kW Charge) Customer (Per Customer Charge) A-16/60 40.82% 52.78% 88.05% $10,000 $10,000 $10,000 C-06 B/G-32 B/G-62 S X-01 16.29% 14.68% 1.63% 26.29% 13.82% 0.21% 7.77% 3.48% 0.00% 0.85% 5.21% 0.08% 0.30% 0.31% 0.00% $4,082.10 $5,278.08 $8,805.43 $766.57 $1,629.34 $970.95 $1,467.94 $1,002.81 $162.97 $2,629.25 $1,382.34 $20.82 $777.17 $347.94 $0.24 $85.31 $521.35 $7.71 $30.27 $31.40 $0.02 $0.00129 $0.00129 $0.00129 $0.00167 $0.00164 $1.69 7.67% 9.71% 10.03% G-02 $1.69 $0.00129 $0.00129 $0.00129 $0.00129 $0.00792 $0.00134 $0.41 $0.44 $0.25 $1.69 $1.69 $1.69 $1.69 $1.69 14 Efficiency/Rate Attributes Rates must be designed to yield total revenue requirement. Price signals: Rates should reflect marginal cost Marginal cost is the cost of producing one additional unit of output, other things remaining the same. Rates should be simple and easy to understand Gradualism: rate changes should be gradual and predictable. 15 Illustrative Monthly Bill Impacts Rate Class A16- Monthly Usage Increase (Energy) Increase (Demand) Increase (Customer) 500 kWh $0.65 0.7% $0.82 0.9% $1.69 1.8% 500 kWh $0.65 0.8% $0.82 1.0% $1.69 2.1% 1,000 kWh $1.29 0.8% $1.64 1.1% $1.69 1.1% 150 kW and 30,000 kWh $38.70 0.7% $57.40 1.1% $1.69 0.0% 60 kW and 30,000 kWh $38.70 0.8% $20.50 0.4% $1.69 0.0% 2,500 kW and 500,000 kWh $645.00 1.2% $1,012 1.2% $1.69 0.0% 1,000 kW and 500,000 kWh $645.00 1.4% $352 0.8% $1.69 0.0% G62- 15,000 kW and 3,000 MWh $3,870 1.2% $3,750 1.2% $1.69 0.0% Opt Lg Demand 6,000 kW and 3,000 MWh $3,870 1.4% $1,500 0.5% $1.69 0.0% Residential A60Low Income C06Small C&I G02General C&I G32Lg Demand 16 Additional Information for Reference 17 Description of Unit Charges Customer Charges Generally, fixed monthly charge designed to collect costs related to being a customer; for example, metering, billing, and customer service. Demand (per kW) Charges Demand (per kW) Charges are designed to collect fixed costs (i.e., costs that do not vary with throughput) associated with the distribution and/or transmission systems, such as transformers, conductor, poles, towers, and substations. Variable (per kWh) Charges Variable Charges (per kWh) are designed to collect costs that vary with throughput. Generally, these are costs that can be avoided by reducing kWh deliveries, for example, Standard Offer Service costs increase or decrease directly with kWh deliveries. 18 Example: Customer Usage Profiles 160 140 Demand (kW) 120 100 80 High Load Factor Customer 60 Low Load Factor Customer 40 20 0 1 3 5 7 9 11 13 15 17 19 21 23 Hour 19 Class Contribution to Peak Demand 20
© Copyright 2026 Paperzz