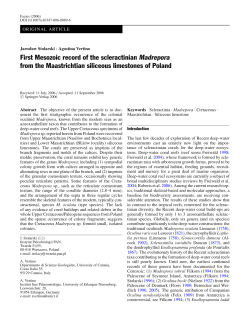
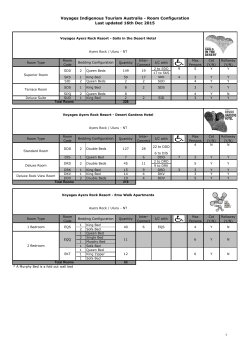
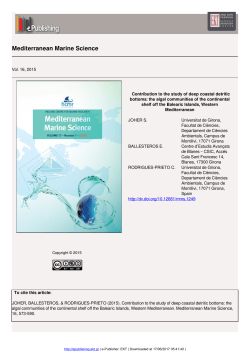
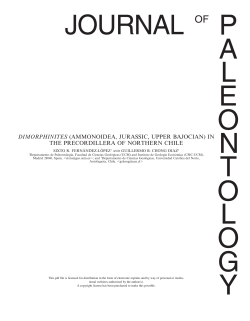
Earth and Planetary Science Letters 206 (2003) 587^600
www.elsevier.com/locate/epsl
Paleomagnetism of Upper Jurassic to Lower Cretaceous
volcanic and sedimentary rocks from the western Tarim Basin
and implications for inclination shallowing and
absolute dating of the M-0 (ISEA?) chron
Stuart Gilder a; , Yan Chen b , Jean-Pascal Cogne¤ a , Xiaodong Tan a ,
Vincent Courtillot a , Dongjiang Sun c , Yongan Li c
a
c
Institut de Physique du Globe de Paris, Laboratoire de Pale¤omagne¤tisme, 4 place Jussieu, 75252 Paris Cedex 05, France
b
De¤partement des Sciences de la Terre, Universite¤ d’Orle¤ans, P.O. Box 6759, 45067 Orle¤ans Cedex 02, France
Institute of Geology and Mineral Resources, Bureau of Geology and Mineral Resources of Xinjiang Uygur Autonomous Region,
16 Youhao Beilu, Urumqi, PR China
Received 24 July 2002; received in revised form 4 November 2002; accepted 7 November 2002
Abstract
Stepwise demagnetization isolates a stable magnetic component in 13 sites of basalt flows and baked sediments
dated at 113.3 : 1.6 Ma from the Tuoyun section, western Xinjiang Province, China. Except for one flow from the
base of the V300 m thick section, the rest have exclusively reversed polarity. The sequence correlates with chron M-0
in some geomagnetic polarity time scales, which potentially places the section just before the start of the Cretaceous
Long Normal polarity superchron. Five of 11 sites of Early Cretaceous red beds that underlie the basalts possess
coherent directions that pass both fold and reversals tests. Six sites of Upper Jurassic red beds have a magnetic
component that was likely acquired after folding in the Tertiary. The mean paleolatitude of the Lower Cretaceous red
beds is 11‡ lower than that of the Lower Cretaceous basalts suggesting the red beds underestimate the true field
inclination. We further test this result by calculating the paleolatitudes to a common point of the available Early
Cretaceous to Present paleomagnetic poles from red beds and volcanic rocks from central Asian localities north of the
Tibetan Plateau. We find that paleolatitudes of volcanic rocks roughly equal the paleolatitudes calculated from the
reference Eurasian apparent polar wander path (APWP) and that paleolatitudes of red beds are generally 10^20‡
lower than the paleolatitudes of volcanic rocks and those predicted from the reference curve. Our study suggests that
central Asian red beds poorly record the Earth’s field inclination, which leads to lower than expected paleolatitudes.
Good agreement in paleolatitudes from volcanic rocks and the Eurasian APWP argues against proposed canted and
non-dipole field models.
D 2002 Elsevier Science B.V. All rights reserved.
Keywords: paleomagnetism; Asia; inclination shallowing; magnetostratigraphy; magnetic ¢eld; magnetic recording; basalt;
red beds; Cretaceous; Jurassic
* Corresponding author. Tel.: +33-1-44272432; Fax: +33-1-44277463.
E-mail address: [email protected] (S. Gilder).
0012-821X / 02 / $ ^ see front matter D 2002 Elsevier Science B.V. All rights reserved.
PII: S 0 0 1 2 - 8 2 1 X ( 0 2 ) 0 1 0 7 4 - 9
EPSL 6483 22-1-03
588
S. Gilder et al. / Earth and Planetary Science Letters 206 (2003) 587^600
1. Introduction
The exceptional topographic relief and high
strain rates in central Asia provide an excellent
opportunity to quantify geologic e¡ects of intracontinental deformation related to the India^Asia
collision (Fig. 1). As paleomagnetism provides a
means to constrain shortening amounts, this technique has been widely applied in the region. Early
paleomagnetic studies concentrated on Cretaceous
rocks, which produced a coherent picture of systematically increasing paleolatitudes and diminished shortening from south to north. The Cretaceous data suggested some 2700 km of total
shortening occurred between India and Asia, of
which 1700 : 600 km was absorbed within Asia,
with more than 1000 km of shortening taken up
between the Tarim Basin and Siberia, north of the
Tibetan plateau [1].
When Cenozoic paleomagnetic results became
available, however, the picture grew more complicated. Although the Cretaceous and Cenozoic paleolatitudes were virtually the same, the Eurasian
apparent polar wander path (APWP), with which
the poles from central Asia were compared, required about twice the amount of shortening for
the Cenozoic data as for the Cretaceous data.
Such quantities were incompatible with geologic
observations and topographic constraints. Several
hypotheses were proposed to explain this discrepancy such as poor age control, syn-sedimentary or
compaction-induced inclination shallowing, tilted
axial dipole, non-dipolar geomagnetic ¢eld geometry, tectonic shortening, tectonic escape, remagnetization, a poorly constrained APWP for Eurasia, and non-rigidity of the Eurasian plate [2^10].
Two magnetostratigraphic studies have recently
placed tight constraints on the ages of Upper Tertiary rocks and leave little doubt that tectonic
shortening cannot explain the observed inclina-
Fig. 1. Topographic map of central Asia showing distribution of volcanic and red bed localities used to construct Fig. 7.
EPSL 6483 22-1-03
S. Gilder et al. / Earth and Planetary Science Letters 206 (2003) 587^600
589
Fig. 2. Simpli¢ed cross-section of the Tuoyun section from ¢eld notes. K1 is Early Cretaceous and J3 is Upper Jurassic. Depth
projection of gabbro dike is hypothetical.
tions, which are some 15‡ shallower than at
present [8,11]. The paleolatitudes of these Neogene data would require central Asia to have
moved nearly 1000 km farther north than India
in the past 20 Ma, a notion incompatible with all
geologic observations. Gilder et al. [8] found that,
among 25 studies carried out on Upper Jurassic
to Neogene red beds in central Asia (Fig. 1), the
paleolatitudes were the same regardless of age.
Syn-sedimentary inclination shallowing, which
produces lower than expected paleolatitudes, was
identi¢ed as the most probable cause. However, it
is strange that the expected paleolatitudes change
with time yet the observed paleolatitudes remain
constant. This leads one to question, for example,
if inclination shallowing has a¡ected the Cenozoic
rocks more than the Cretaceous ones, or if the
Eurasian reference APWP is valid.
One way to test whether the paleolatitudes
measured in red beds are real or artifactual is to
compare them with paleolatitudes derived from
volcanic rocks, which are largely immune from
shallowing e¡ects. A drawback of volcanics, however, is that enough £ows must be sampled in
order to average out geomagnetic secular variation to yield a time-averaged pole, equivalent to
the geocentric axial dipole ¢eld direction acting
when the £ows were emplaced. Often only a few
£ows are available for sampling and it is not clear
whether secular variation has been su⁄ciently
averaged. For example, Otofuji et al. [12] sampled
two Pleistocene basalt £ows and found inclinations near the expected inclination from the reference APWP ; whereas Thomas et al. [2] found
much shallower than expected inclinations from
two sites from a single V50 Ma basalt £ow and
two sites of sediments baked by that £ow. Recently, Bazhenov and Mikolaichuk [13] reported
18 sites drilled in a minimum of ¢ve Paleogene
£ows. The mean direction shows no shallowing
with respect to the synthetic Siberian APWP. To
better understand the origin of the shallow inclinations in central Asia, we undertook a paleomagnetic study of a V300 m thick pile of basalt
£ows, of which we sampled a minimum of 11
£ows in the Tuoyun section in western Xinjiang
Province, China (Fig. 1). Moreover, we sampled
red beds that underlie, and are intercalated with,
the basalts in order to compare the directions of
the two rock types. Paleomagnetic data from the
Tuoyun basalts were previously reported by Li et
al. [14] and Meng et al. [15] and are discussed in
light of our new ¢ndings.
2. Geologic setting, sampling and methods
Tuoyun village lies near the border of Kyrgyzstan at the westernmost limit of the Tarim Basin,
in the southeastern Tianshan Mountains (Fig. 1).
The section we sampled concerns a V300 m thick
pile of olivine-bearing basalts that are intercalated
with sediments, as well as red beds of the Lower
Cretaceous Kezilesu Group and the Upper Jurassic Kuzigongsu Formation that underlie the basalts [16] (Fig. 2). The sediments were dated by
regional correlation and we know of no direct
fossil control. Geochemistry and 40 Ar/39 Ar dating
of the basalts are described in Sobel and Arnaud
[17] who reported weighted mean 40 Ar/39 Ar dates
for whole rock and a plagioclase fraction from
one £ow (sample 91T111) as 113.3 : 1.6 (1c)
and 119.7 : 8.1 Ma, respectively. Biotite extracted
from gabbro and from diabase sills that intrude
the series yielded weighted mean ages ranging
from 46 to 67 Ma.
A simpli¢ed structural pro¢le of the Tuoyun
section is shown in Fig. 2. Altogether we sampled
EPSL 6483 22-1-03
590
Table 1
Paleomagnetic data from the Tuoyun section, western Xinjiang Province
Site
Lith.
Age
bas
K1
bas
K1
bas
K1
bas
K1
bas
K1
bas
K1
bas
K1
bas
K1
red-b
K1
bas
K1
red-b
K1
bas
K1
red
K1
red
K1
bas
K1
red
K1
red
K1
red
K1
red
K1
red
K1
red
K1
red
K1
red
K1
red
K1
red
J3
red
J3
red
J3
red
J3
red
J3
red
J3
red
J3
K1 basalts
K1 basalts
K1 basalts+red beds-b
K1 basalts+red beds-b
Mean K1 red beds
Mean K1 red beds
Mean J3 red beds
Mean J3 red beds
Slon
Slat
n/N
Dg
Ig
Ds
Is
k
K95
Strike
Dip
Plat
Plon
75‡20P02.4Q
75‡20P02.4Q
75‡20P02.4Q
75‡19P25.6Q
75‡19P25.6Q
75‡19P25.6Q
75‡19P25.6Q
75‡18P58.2Q
75‡18P58.2Q
75‡18P58.2Q
75‡18P58.2Q
75‡18P58.2Q
75‡18P30.7Q
75‡18P30.7Q
75‡18P32.3Q
75‡19P16.6Q
75‡19P16.6Q
75‡19P26.9Q
75‡19P26.9Q
75‡19P26.9Q
75‡19P26.9Q
75‡19P27.4Q
75‡19P02.6Q
75‡19P02.6Q
75‡18P42.5Q
75‡18P42.5Q
75‡18P42.5Q
75‡18P42.0Q
75‡18P42.0Q
75‡19P00.8Q
75‡19P00.6Q
40‡17P38.8Q
40‡17P38.8Q
40‡17P38.8Q
40‡15P53.5Q
40‡15P53.5Q
40‡15P53.5Q
40‡15P53.5Q
40‡14P52.2Q
40‡14P52.2Q
40‡14P52.2Q
40‡14P52.2Q
40‡14P52.2Q
40‡14P14.4Q
40‡14P14.4Q
40‡13P45.2Q
40‡12P51.4Q
40‡12P51.4Q
40‡12P47.2Q
40‡12P47.2Q
40‡12P47.2Q
40‡12P47.2Q
40‡11P54.2Q
40‡11P34.2Q
40‡11P34.2Q
40‡10P49.6Q
40‡10P49.6Q
40‡10P49.6Q
40‡10P30.8Q
40‡10P30.8Q
40‡11P05.4Q
40‡11P05.5Q
6/6
6/6
7/7
6/6
6/6
6/6
12/12
6/6
8/8
6/6
9/9
4/6
0/7
0/12
7/7
0/8
3/6
0/4
0/7
6/9
8/9
6/8
5/6
0/8
7/10
4/8
6/8
9/9
8/8
9/9
8/8
11/11
11/11
13/13
13/
13
5/11
5/
11
6/7
6/7
172.6
170.6
155.4
204.3
188.9
214.1
229.7
157.0
235.7
101.4
166.2
109.4
343.9
335.5
310.5
34.1
39.7
38.3
0.3
357.0
376.9
374.7
373.3
368.0
224.8
220.8
161.2
212.8
195.1
226.2
236.3
190.9
236.4
214.8
208.6
190.8
370.2
373.8
355.9
338.0
347.9
337.5
322.0
337.0
337.9
360.2
343.4
358.5
60.1
18.5
215.8
46.3
321.6
289.4
55.9
157.6
104.4
105.4
103.4
42.6
8.7
16.0
4.1
10.0
3.7
3.9
5.9
5.4
5.4
6.6
5.1
14.2
304.9
293.7
156.5
9.7
23.2
357.4
359.2
46.6
363.8
331.9
381.7
348.6
35.1
38.7
43.8
173.6
4.6
54.7
177.7
59.5
32.4
41.5
48.6
133.2
10.7
54.7
169.6
222.1
225.4
250.1
58.1
311.4
318.6
342.5
66.0
216.1
217.6
223.7
30.8
333.2
336.8
335.0
38.9
22.2
26.7
32.5
65.9
14.5
10.9
11.9
10.2
351.9
352.5
47.2
58.2
10.0
5.6
181.4
191.0
30.5
12.0
35.0
18.3
40.2
63.1
65.4
63.0
54.6
64.9
10.2
0.7
13.2
1.5
9.4
48.2
49.1
48.9
44.9
59.1
43.5
52.8
84.8
31.8
127.1
9.3
12.8
7.3
9.3
4.9
76.3
79.8
75.0
76.2
82.8
214.9
251.9
205.1
249.8
165.2
33.5
7.5
69.2
35.8
10.4
58.1
172.3
29.4
51.4
66.6
170.7
43.1
31.9
49.9
8.7
24.1
12.1
22.0
10.6
81.9
8.0
41.9
4.5
15.3
4.5
16.3
39.0
47.0
46.0
39.6
39.6
39.6
39.6
35.5
39.0
39.0
37.0
37.0
32.0
40.0
8.7
21.0
26.0
24.0
29.0
26.0
23.5
32.5
33.0
33.0
20.0
17.7
20.0
17.0
17.0
24.0
15.7
A95
13.6
357.2
359.1
374.8
356.4
373.3
346.4
332.9
368.3
38.6
55.0
62.0
57.7
86.1
86.1
86.1
86.1
322.2
326.7
326.7
319.3
319.3
95.0
92.0
128.1
215.0
193.1
198.0
199.0
162.4
169.6
249.6
276.6
272.0
247.2
252.3
247.8
223.9
224.0
251.0
245.9
12.0
64.1
172.1
37.9
38.6
12.1
127.4
22.9
6.8
6.1
53.2
183.4
5.7
5.5
68.9
141.0
51.5
140.9
148.1
7.9
7.3
53.6
27.7
34.5
63.7
Abbreviations: Lith., lithology; bas, basalt; red, red bed; red-b, baked red bed; Slat (Plat), latitude of site (pole); Slon (Plon), longitude of site (pole); n/N, number of samples used to calculate mean direction/number of samples demagnetized; D, declination; I, inclination; g, in situ (geographic) coordinates; s, tilt-corrected
(stratigraphic) coordinates (at 100% unfolding); K95 (A95 ), the radius that the mean direction (pole) lies within 95% con¢dence; k, the best estimate of the precision
parameter.
S. Gilder et al. / Earth and Planetary Science Letters 206 (2003) 587^600
EPSL 6483 22-1-03
c901
c902
c903
c904
c905
c906
c907
c908
c909
c910
c911
c912
c913
c914
c915
c916
c917
c918
c919
c920
c921
c922
c923
c924
c925
c926
c927
c928
c929
c930
c931
Mean
Mean
Mean
Mean
S. Gilder et al. / Earth and Planetary Science Letters 206 (2003) 587^600
591
Fig. 3. Orthogonal demagnetization diagrams of basaltic rocks (sample number and corresponding sites listed) in in situ coordinates. Demagnetization steps in ‡C in all plots except b and c which are in mT. NRM is the natural remanent magnetization.
11 basalt sites, two sites of sediments (c909 and
c911) intercalated in the basalt £ows, 11 Lower
Cretaceous red bed sites and seven Upper Jurassic
red bed sites (Table 1). Each basalt site represents
at least one discrete £ow. Paleomagnetic samples
were collected with a gasoline-powered drill and
oriented with magnetic and sun compasses, the
latter to check and correct for local declination
anomalies, which averaged 3.4 : 2.2‡ (1c). Samples cut from each core underwent stepwise (averaging 15 steps) thermal or alternating ¢eld (AF)
demagnetization. Magnetic remanences were measured with a 2G, three-axis DC SQUID magnetometer (red beds) or an AGICO JR-5 spinner magnetometer (basalts) housed in a magnetically
shielded room at the Institut de Physique du
Globe de Paris. Magnetic components were determined using principal component analysis [18],
and directions were analyzed using Fisher [19]
statistics and the Watson and Enkin [20] fold
test applying 1000 simulations and assuming a
5‡ uncertainty on bedding corrections. Data
were treated using software developed by Cogne¤
[21] and R. Enkin (unpublished).
3. Results
Thermal and AF demagnetization isolated a
single dominant magnetic component in all basalt
samples after removing a recent ¢eld or weak viscous magnetization (Fig. 3). In most cases, complete demagnetization occurred in peak ¢elds
from 60 to 140 mT or between 540 and 580‡C,
suggesting that titanomagnetite is the dominant
carrier of the magnetic remanence. Some samples,
especially from sites c905 and c912, were fairly
resistant to AF demagnetization and had about
EPSL 6483 22-1-03
592
S. Gilder et al. / Earth and Planetary Science Letters 206 (2003) 587^600
40% of their initial intensities unblocking from
580 to 680‡C, indicating the presence of hematite.
Thermoremanent magnetization experiments using an AGICO CS-2 Kappabridge show a steep
drop o¡ in the 550^580‡C range with a weak signal persisting thereafter that decreases with increasing temperature. Hysteresis parameters of
25 samples plot within the pseudo-single domain
region on a Day diagram [22]; however, the grain
sizes are probably pulled away from the single
domain ¢eld toward the multidomain ¢eld due
to the in£uence of hematite.
Remanent magnetization characteristics of the
sediments varied widely. Average initial magnetic
Fig. 4. Orthogonal demagnetization diagrams of sedimentary rocks (sample number and corresponding sites listed) in in situ coordinates. Demagnetization steps in ‡C in all plots. NRM is the natural remanent magnetization. Panels a and b from baked
sediments, c^f from Lower Cretaceous red beds and g^i from Upper Jurassic red beds.
EPSL 6483 22-1-03
S. Gilder et al. / Earth and Planetary Science Letters 206 (2003) 587^600
593
Fig. 5. Individual site mean directions in panels a^c and overall mean directions in panel d (data from Table 1).
intensities of sites c909 and c911 were about 100
times greater than the other Lower Cretaceous
red bed sites (7U1032 A/m vs. 9U1034 A/m)
and more than 10 times greater than the Upper
Jurassic sites (5U1033 A/m). The former two sites
exhibited linear demagnetization trajectories that
decayed toward the origin in a narrow range of
unblocking temperatures (Fig. 4a,b). Their strong
intensities and demagnetization behaviors are
consistent with the idea that they were baked
above hematite Curie temperatures, i.e., that their
magnetic remanences are thermal and not depositional or chemical in origin. We did not sample
the basalt £ows that immediately overlie sites c909
and c911. Sites c910 and c912, which overlie sites
c909 and c911 by 23 m and 4 m, respectively,
possess signi¢cantly di¡erent mean directions (Table 1). From our ¢eld observations and the de-
EPSL 6483 22-1-03
594
S. Gilder et al. / Earth and Planetary Science Letters 206 (2003) 587^600
magnetization characteristics, we conclude that
the mean directions of sites c901^c912 and c915
each represent an independent spot reading of the
¢eld.
The other Lower Cretaceous red bed samples
displayed quite variable demagnetization characteristics ranging from erratic or multiple component behavior (Fig. 4c,d) to a single, stable component at high temperatures (Fig. 4e,f). In
general, sample directions from ¢ve sites exhibited
a coherent, stable component pointing NNE and
down or SSW and up in tilt-corrected coordinates, with roughly equal proportions of normal
and reverse polarities. The other samples had unstable or quite scattered directions on the intrasite level. Samples from the Upper Jurassic red
beds were dominated by a single magnetic component of normal polarity in all sites except one
(c930) (Fig. 4g^i). However, individual directions
from this latter site, although well de¢ned, were
so dispersed that it was omitted from further consideration.
When applying the fold test we separated the
sites into three groups: (1) all basalt sites plus
baked sedimentary sites c909 and c911, (2) Lower
Cretaceous red bed sites and (3) Upper Jurassic
red bed sites (Table 1 and Fig. 5). For the ¢rst
group, the test statistic maximized at 102 : 8%
unfolding which clearly demonstrates a pre-folding remanence (Fig. 5a). We regard it as a primary magnetization. The mean tilt-corrected direction is similar to those reported by Li et al.
([14] ^ D = 19.6‡, I = 52.5‡, N = 11, k = 17,
K95 = 11.4‡) and Meng et al. ([15] ^ D = 12.7‡,
I = 44.8‡, N = 10, k = 14.9, K95 = 13.0‡). The test
statistic based on ¢ve of 11 sites of the Lower
Cretaceous red beds maximizes at 98 : 19% unfolding (Fig. 5b). The positive fold test and dual
polarities suggest the remanence is primary. The
bedding attitudes of the Upper Jurassic red beds
do not allow the fold test to be applied with any
signi¢cance although the test statistic maximizes
at 27% unfolding (Fig. 5c). If uncertainty on bedding attitude measurements is increased from 5‡
to 8‡ then the fold test excludes the case at 100%
unfolding with a maximum at 14 : 56%. It is
strange that the stable magnetization component
is only represented by normal polarity, yet the
reversal frequency was relatively high during
that time interval [23]. If the remanence was primary, one would have to explain why the Cretaceous basalts and red beds were rotated respectively 19.0 : 12.0‡ and 24.5 : 5.8‡ clockwise, yet
the Upper Jurassic red beds were rotated
312.2 : 8.9‡ counterclockwise compared to coeval
poles from the synthetic Eurasian APWP [24].
This would imply an about 334‡ counterclockwise rotation of the Upper Jurassic strata before
deposition of the Lower Cretaceous strata followed by a V22‡ clockwise rotation of the entire
sequence after the Lower Cretaceous. This is unlikely because we ¢nd no evidence for a deformation event (angular unconformity, etc.) between
the Upper Jurassic and the Lower Cretaceous.
On the other hand, comparing the in situ direction of the Upper Jurassic rocks with the 50 Ma
to Present poles from the Eurasian reference curve
shows signi¢cant clockwise rotations ranging
from 16‡ to 23‡, on the same order as the Lower
Cretaceous rocks (Fig. 5d). Thus, the simplest interpretation is that the Upper Jurassic rocks were
folded then overprinted in the Tertiary and the
entire section was subsequently rotated.
We also measured the anisotropy of magnetic
susceptibility of 84 Early Cretaceous red bed and
60 basalt samples with an AGICO KLY-3 Kappabridge. The basalts have a mean anisotropy degree (PP) of 2% with six samples having PP from 5
to 14% (Fig. 6). The anisotropy shape factor (T)
varies widely, independent of PP, with a mean of
0.1 : 0.5 (1c). The red beds have very small degrees of anisotropy (PP = 0.3 : 0.2%), with only
one sample exceeding 1% (Fig. 6). Anisotropy
shape is randomly distributed between prolate
and oblate forms. Although the principal anisotropy directions are relatively dispersed, the mean
maximum anisotropy (k1 ) directions of the basalt
(D = 318‡, I = 4‡) and red beds (D = 298‡, I = 34‡)
trend roughly parallel to the strike of the fold axis
de¢ned by the bedding attitudes of the basalts
(288‡N) and red beds (299‡N), respectively. Given
the low degrees of anisotropy and the large scatter
in the maximum susceptibility axis directions, neither the basalts nor the red beds have likely experienced signi¢cant strain due to compaction or
tectonic stress.
EPSL 6483 22-1-03
S. Gilder et al. / Earth and Planetary Science Letters 206 (2003) 587^600
595
Fig. 6. Anisotropy of magnetic susceptibility data from basalts and red beds.
4. Discussion
From the demagnetization data and ¢eld tests
we conclude that the Early Cretaceous volcanics
and baked red beds, as well as ¢ve of 11 sites of
Early Cretaceous red beds possess primary magnetizations. Interestingly, except for c915 which
comes from the very base of the section, all the
volcanic £ows and two sites of baked sediments
have reversed polarities. Sample 91T111, dated by
Sobel and Arnaud [17], was collected in the vicinity of sites c908^c912 (E. Sobel, personal communication, 2002). They found that the weighted
mean age of the whole rock sample compared
well with both the total fusion and inverse isochron ages. The plagioclase fraction yielded a discordant release spectrum and the individual steps
had large uncertainties due to small amounts of
released 39 Ar. They considered that the date de¢ned by the whole rock sample (113.3 : 1.6 Ma)
best represents the age of the basalt £ows, consistent with the common observation that basaltic
groundmass has much higher potassium concentrations and more reliable release spectra than
plagioclase. Assuming the whole rock age is correct, then the Tuoyun section helps constrain the
age of the reversed polarity chron near the start of
the Cretaceous Long Normal magnetic polarity
superchron. However, there is some confusion in
correlating the Tuoyun section with the geomagnetic polarity time scale (GPTS). According to
some GPTS, sites c901^c912 correlate well in
time with chron M-0 (called CM1 by Hallam et
al. [25] and M-1r by Gradstein et al. [26]), near
the base of the Aptian, between 113.4 and 114.0
Ma [27,28]. These GPTS include a younger reversed chron, sometimes referred to as ISEA,
after the site of reversed polarity discovered by
Vandenberg et al. [29] in the upper Aptian at
V108 Ma (e.g., [30,31]). Other GPTS place M-0
at V121 Ma and ISEA at V118 Ma (see references in Berggren et al. [32]). Although this ambiguity is not resolved here, what is important is
that: (1) we have clearly identi¢ed a reversed po-
EPSL 6483 22-1-03
596
S. Gilder et al. / Earth and Planetary Science Letters 206 (2003) 587^600
larity interval dated at 113 : 1.6 Ma and (2) as
both the M-0 and ISEA events are thought to
span about a half million years, the time represented by sites c901^c912 and c915 should be suf¢cient to average secular variation.
The overall mean directions of the basalt series
and red bed sites are not distinct at 95% con¢dence limits [33] (Fig. 5d). Although the mean
inclination of the red beds (38.6 : 6.8‡) lies within statistical uncertainty of that of the basalts
(49.9 : 10.6‡), the mean value remains the one
with maximum probability, hence the basalts
likely have steeper inclinations than the red
beds. Translated into paleolatitudes, the basalts
indicate a more temperate position at 32.8 : 9.6‡
versus the red beds at 22.0 : 4.9‡, amounting to a
di¡erence of 11.8 : 10.8‡. With respect to the 110
Ma Siberian reference pole of Besse and Courtillot [24], the basalts show insigni¢cant poleward
displacement (3.9 : 8.1‡) whereas the red beds
show signi¢cant poleward displacement (14.7 :
4.6‡). Thus, comparing these two results independently with the Siberian reference APWP, the interpretation would normally be that the red beds
underwent signi¢cant intracontinental shortening
whereas the basalts did not.
Finally we turn to the extensive central Asian
paleomagnetic database of red bed sediments
which was compiled by Gilder et al. [8] for 25
Early Cretaceous to Present studies demonstrating
positive fold tests that lie north of the Tibetan
plateau between 34.7‡N and 44.2‡N latitude and
Table 2
Paleomagnetic poles of Asian red beds and volcanic rocks north of the Tibetan Plateau
Slat
(‡N)
Red beds
38.6
39.8
37.5
38.3
38.2
38.5
38.7
38.1
39.4
38.4
37.5
40.2
39.9
Basalts
50.5
51.0
36.3
52.0
46.5
41.0
41.5
40.7
42.0
71.5
40.2
50.5
51.2
51.8
41.5
Slon
(‡E)
Age
Mean age
(Ma)
Plat
(‡N)
Plon
(‡E)
A95
No.
Reference
91.1
76.2
95.3
90.9
88.7
80.5
92.8
86.6
93.8
94.3
86.7
75.3
97.7
u. Neogene
u. Neogene
l. Pliocene
u. Miocene^Pliocene
Neogene
l. Neogene
l. Neogene
Paleogene^Neogene
Oligocene
Paleogene
Cretaceous^Paleogene
l. Cretaceous
l. Cretaceous
3.5
3.5
4.4
8.4
12.7
14.5
17.5
29.6
30.2
41.0
82.0
115.0
121.0
86.5
73.9
71.3
79.9
72.8
58.6
75.1
75.8
63.9
63.4
65.1
53.2
75.5
254.2
297.5
264.3
274.5
261.9
210.0
243.5
229.5
219.7
211.2
206.9
183.4
169.9
5.7
1.9
5.3
3.2
23.3
6.2
5.1
9.6
9.8
9.9
18.2
6.1
7.7
10
258s
20
19
3
30
16
7
6
7
6
5
9
[39]
[11]
[40]
[39]
[39]
[41]
[40]
[39]
[39]
[39]
[39]
This study
[42]
105.0
104.0
79.0
101.0
96.5
114.7
116.0
76.1
75.0
111.0
75.3
107.5
112.2
117.5
72.2
Quaternary
u. Pliocene
K^Ar 12.7 and 5.8 Ma
Between 23 and 2 Ma
Between 24 and 5 Ma
K^Ar from 26 to 4 Ma
K^Ar from 26 to 14 Ma
l. Eocene ca. 54 Ma
K^Ar 55 to 65 Ma
Cenomanian to Albian
Ar^Ar 113 : 1.6 Ma
K^Ar 110 to 130 Ma
K^Ar 118 to 128 Ma
Ar^Ar 125 to 133 Ma
Hauterivian
0.5
2.5
9.3
12.5
14.5
15.0
20.0
54.0
60.0
101.0
113.0
120.0
123.0
129.0
133.0
86.0
83.0
87.7
76.0
77.0
83.4
88.6
77.0
76.0
66.0
64.1
73.0
58.5
86.8
82.0
180.0
133.0
358.8
241.0
162.0
192.8
29.2
187.5
190.0
170.0
172.1
158.0
176.8
61.8
252.0
4.6
5.0
9.7
4.0
21.2
6.2
8.2
4.4
4.5
11.0
12.0
6.7
5.6
7.4
4.7
23s
42s
5
10
4
49
13
18
3
12
13
3
12
12
10
[43] ^ in [35]
[34] ^ in [35]
[14]
[34] ^ in [35]
[44] ^ in [35]
[45]
[46]
[13]
[43] ^ in [35]
[47] ^ in [35]
This study
[43] ^ in [35]
[48]
[48]
[49] ^ in [35]
Abbreviations: Slat (Plat), latitude of site (pole); Slon (Plon), longitude of site (pole); No., number of sites or samples (s) used
to calculate mean pole; u, upper; l, lower, 25 other red bed poles given in table 3 of Gilder et al. [8].
EPSL 6483 22-1-03
S. Gilder et al. / Earth and Planetary Science Letters 206 (2003) 587^600
597
Fig. 7. Paleolatitudes calculated from poles listed in Table 2 and Gilder et al. ([8], table 3) for a common site at 39‡N, 82‡E (center of Tarim Basin) for red beds, volcanic rocks and from the reference Eurasian APWP from Besse and Courtillot [24]. (a)
From localities lying west of 85‡E (see Fig. 1). (b) For all data in Table 2 and Gilder et al. ([8], table 3). Red beds are treated
using a sliding window of nine studies moved every four studies (last step is 11 studies).
66.9‡E and 103.5‡E longitude. The database is
complemented here with 13 new poles from continental sediments meeting the same criteria (Table 2). Although age uncertainties of continental
sediments can be large, most often they are constrained at the epoch level. We also compiled all
available paleomagnetic poles derived from volcanic rocks from the same region. As the database
is much smaller, we accepted poles distributed
over a broader area than that for the red beds,
but still north of the Tibetan Plateau (Table 2 and
Fig. 1). Because of the low number of studies, we
accepted results obtained from a minimum of
three discrete £ows. We note that several poles
were obtained from the Dragon database of
McElhinny and Smethurst [34] where details surrounding the data are limited, especially those
from Russian publications. For each pole, we cal-
culated the paleolatitude for a common point
(39‡N, 82‡E ^ center of Tarim Basin).
First we compared the paleolatitude data west
of 85‡E because the red bed and volcanic sites
there are relatively intermingled and come from
a similar tectonic setting. These data are shown in
Fig. 7a compared against the paleolatitudes calculated from the Besse and Courtillot [24] Eurasian
reference APWP at the same common point.
Although within uncertainty limits, the mean paleolatitudes de¢ned by the volcanic rocks are systematically 2^4‡ lower than those de¢ned by the
reference APWP. The paleolatitudes of the red
beds are signi¢cantly lower by 10^25‡ than those
predicted from the reference Eurasian APWP for
any given age, except for two studies around 120
Ma.
We then took the entire set of paleomagnetic
EPSL 6483 22-1-03
598
S. Gilder et al. / Earth and Planetary Science Letters 206 (2003) 587^600
poles and calculated the corresponding paleolatitude for the same common point as before (Fig.
7b). For the red beds, we determined the average
paleolatitude from 0 to 140 Ma via a sliding window with a width of nine studies moved every
four studies. As the volcanic data are much fewer,
we did not ¢t a sliding window but merely plotted
each individual datum on Fig. 7b, again versus
the paleolatitudes calculated from the reference
APWP. Although the data are not evenly spaced
in time, one notes a good correlation between the
reference APWP and volcanic data, with the exception of one point with a low paleolatitude of
26‡. This datum at 12.5 Ma reportedly comprises
10 sites, although the number of £ows that the
sites represent is unknown (Davydov et al. [35],
data obtained from [34]). Given the uncertainties
surrounding it, the soundest interpretation is that
paleolatitudes derived from volcanic rocks show
no signi¢cant deviation with respect to those calculated from the reference curve whereas the red
beds are shifted toward signi¢cantly lower paleolatitudes.
Because only two volcanic studies lie within the
period 20^100 Ma, comparison of volcanic and
sedimentary data in that window is clearly underdetermined. We thus calculated the average di¡erence in paleolatitude (platvolc 3platsed ) in two time
windows : 0^20 Ma and 110^133 Ma, which is
15.5 : 6.6‡ and 9.9 : 9.6‡, respectively. These results again indicate that Cretaceous to Present
red beds in central Asia have systematically lower
paleolatitudes than coeval volcanics. However,
the discrepancy is less for the Early Cretaceous
than for the Neogene, and the variance decreases
toward the present, both of which may suggest
that the process leading to shallow inclinations
has changed with time.
To explain the central Asian shallow inclinations, Tan et al. [10] conducted a paleomagnetic
and magnetic fabric study of Cretaceous red beds
from the Tarim Basin and concluded that shallowing occurs during deposition and compaction.
A similar study of the Subei section in the Qaidam basin suggested that shallowing was produced partly by imbrication during sedimentation
under northward-directed transport conditions
[8]. To explain how the Subei study could apply
to the whole of central Asia, we recall that rivers
eroding the east^west-trending mountain ranges
of central Asia £ow on average to the north, because the deformation front propagates northward as India penetrates Asia from the south
[36]. Because mountain building in central Asia
has probably intensi¢ed since the Cretaceous,
this could partially explain why the shallowing
e¡ect has ampli¢ed from the Cretaceous to
Present. Numerical experiments show that faster
sedimentation rates can produce more inclination
shallowing than slower rates [37], and given that
sedimentation rate in central Asia has increased
from the Cretaceous to Present [38], the shallowing problem can be exacerbated with time. This
leads to the possibility that systematic di¡erences
in deposition transport direction, rate and/or energy can explain why some red beds show no (or
little) evidence for shallowing, whereas others do.
For example, Cretaceous paleolatitudes of red
beds from the North and South China blocks
are not lower than expected ^ in most cases these
red beds were deposited in low energy environments, in north^south-trending basins formed
during east^west extension; thus, sedimentation
conditions in the Cretaceous in central Asia
were likely much di¡erent than in North and
South China. Finally, we note that, because the
Cretaceous and the Cenozoic paleolatitudes predicted from the synthetic APWP are not much
di¡erent (V5‡) (Fig. 7), £attening e¡ects due to
compaction should not be di¡erent from one time
to another, as amounts of compaction-induced
inclination shallowing are latitude-dependent.
One potential di¡erence could be that the magnetic remanences of Cretaceous rocks are chemical in origin whereas those of Neogene rocks are
detrital. Unfortunately, no data exist to test this
hypothesis.
The conclusion from our work is that the paleolatitudes of 140 Ma to Present volcanic rocks
coincide well with coeval paleolatitudes predicted
from the synthetic reference APWP. This suggests: (1) that the reference curve is likely representative of stable Eurasia, and (2) that no longstanding non-dipole ¢eld anomaly existed in the
region. This was the conclusion of Bazhenov and
Mikolaichuk [13] for their Paleocene result which
EPSL 6483 22-1-03
S. Gilder et al. / Earth and Planetary Science Letters 206 (2003) 587^600
we show to be true for the Cretaceous and the
entire Cenozoic. Finally, it should be clear that
the Neogene red beds in the part of central Asia
considered here systematically underdetermine
(15.5 : 6.6‡) predicted inclinations (paleolatitudes). This is also seen in Cretaceous red beds,
however, the e¡ect is smaller (9.9 : 9.6‡). We conclude that one cannot fully trust paleogeographic
reconstructions based on red bed studies alone,
especially during periods of high sedimentation
rate/energy. On the positive side, we ¢nd that volcanic data do provide correct estimates and that
non-dipole ¢eld models are not required, or even
supported by the data.
Acknowledgements
We thank R. Enkin for helpful comments.
IPGP contribution #1861.[AC]
References
[1] Y. Chen, V. Courtillot, J.P. Cogne¤, J. Besse, Z.Y. Yang,
R. Enkin, The con¢guration of Asia prior to the collision
of India: Cretaceous paleomagnetic constraints, J. Geophys. Res. 98 (1993) 21,927^21,941.
[2] J.C. Thomas, H. Perroud, P.R. Cobbold, M.L. Bazhenov,
V.S. Burtman, A. Chauvin, E. Sadybakasov, A paleomagnetic study of Tertiary formations from the Kyrgyz TienShan and its tectonic implications, J. Geophys. Res. 98
(1993) 9571^9589.
[3] J.C. Thomas, A. Chauvin, D. Gapais, M.L. Bazhenov, H.
Perroud, P.R. Cobbold, V.S. Burtman, Paleomagnetic evidence for Cenozoic block rotations in the Tadjik depression (central Asia), J. Geophys. Res. 99 (1994) 15141^
15160.
[4] M. Westphal, Did a large departure from the geocentric
axial dipole hypothesis occur during the Eocene? Evidence from the magnetic polar wander path of Eurasia,
Earth Planet. Sci. Lett. 117 (1993) 15^28.
[5] J.P. Cogne¤, N. Halim, Y. Chen, V. Courtillot, Resolving
the problem of shallow magnetizations of Tertiary age in
Asia: insights from paleomagnetic data from the Qiangtang, Kunlun, and Qaidam blocks (Tibet, China), and a
new hypothesis, J. Geophys. Res. 104 (1999) 17,715^
17,734.
[6] A. Chauvin, H. Perroud, M.L. Bazhenov, Anomalous low
paleomagnetic inclinations from Oligocene^Lower Miocene red beds of the south-west Tien Shan, Central
Asia, Geophys. J. Int. 126 (1996) 303^313.
599
[7] S.A. Gilder, X.X. Zhao, R.S. Coe, Z.F. Meng, V. Courtillot, J. Besse, Paleomagnetism, tectonics and geology of
the southern Tarim basin, northwestern China, J. Geophys. Res. 101 (1996) 22015^22031.
[8] S. Gilder, Y. Chen, S. Sen, Oligo^Miocene magnetostratigraphy and rock magnetism of the Xishuigou section,
Subei (Gansu Province, western China), and implications
for shallow inclinations in central Asia, J. Geophys. Res.
106 (2001) 30,505^30,521.
[9] N. Halim, J.P. Cogne¤, Y. Chen, R. Atasiei, J. Besse, V.
Courtillot, S. Gilder, J. Marcoux, R.L. Zhao, New Cretaceous and Early Tertiary paleomagnetic results from Xining-Lanzhou basin, Kunlun and Qiangtang blocks, China: Implications on the geodynamic evolution of Asia,
J. Geophys. Res. 103 (1998) 21,025^21,045.
[10] X. Tan, K.P. Kodama, H. Chen, D. Fang, D. Sun, Y. Li,
Paleomagnetism and magnetic anisotropy of Cretaceous
red beds from the Tarim basin, northwest China: Evidence for a rock magnetic cause of anomalously shallow
paleomagnetic inclinations from central Asia, J. Geophys.
Res. (2002) in press.
[11] J. Chen, D.W. Burbank, K.M. Scharer, E. Sobel, J.H.
Yin, C. Rubin, R.B. Zhao, Magnetochronology of the
Upper Cenozoic strata in the Southwestern Chinese
Tian Shan: rates of Pleistocene folding and thrusting,
Earth Planet. Sci. Lett. 195 (2002) 113^130.
[12] Y. Otofuji, T. Itaya, H.C. Wang, S. Nohda, Palaeomagnetism and K^Ar dating of Pleistocene volcanic rocks
along the Altyn Tagh Fault, northern border of Tibet,
Geophys. J. Int. 120 (1995) 367^374.
[13] M.L. Bazhenov, A.V. Mikolaichuk, Paleomagnetism of
Paleogene basalts from the Tien Shan, Kyrgyzstan: rigid
Eurasia and dipole geomagnetic ¢eld, Earth Planet. Sci.
Lett. 195 (2002) 155^166.
[14] Y.A. Li, Q. Li, H. Zhang, D.J. Sun, Y.D. Cao, S.Z. Wu,
Paleomagnetic study of Tarim and its adjacent area as
well as the formation and evolution of the basin, Xinjiang
Geol. 13 (1995) 293^376.
[15] Z.F. Meng, Y.S. Deng, T.H. Ding, C.P. Guang, Y.A. Li,
D.J. Sun, Mesozoic^Cenozoic paleomagnetic results of
volcanic rocks from the southern Tarim Basin, Sci. China
(Ser. D) 28 (1998) 79^89.
[16] Chinese Bureau of Geology, Stratigraphic Tables for Xinjiang Autonomous Region, 1981, 496 pp.
[17] E.R. Sobel, N. Arnaud, Cretaceous^Paleogene basaltic
rocks of the Tuyon basin, NW China and the Kyrgyz
Tian Shan: the trace of a small plume, Lithos 50 (2000)
191^215.
[18] J.L. Kirschvink, The least-square line and plane and the
analysis of paleomagnetic data, Geophys. J. R. Astron.
Soc. 62 (1980) 699^712.
[19] R.A. Fisher, Dispersion on a sphere, Proc. R. Soc. London A 217 (1953) 295^305.
[20] G.S. Watson, R.J. Enkin, The fold test in paleomagnetism
as a parameter estimation problem, Geophys. Res. Lett.
20 (1993) 2135^2137.
[21] J.P. Cogne¤, PaleoMac: a Macintosh1 application for
EPSL 6483 22-1-03
600
[22]
[23]
[24]
[25]
[26]
[27]
[28]
[29]
[30]
[31]
[32]
[33]
[34]
[35]
[36]
[37]
S. Gilder et al. / Earth and Planetary Science Letters 206 (2003) 587^600
treating paleomagnetic data and making plate reconstructions, Geochem. Geophys. Geosyst. (2002) in press.
R. Day, M. Fuller, V.A. Schmidt, Hysteresis properties of
titanomagnetites: Grain size and composition dependence, Phys. Earth Planet. Inter. 13 (1977) 260^267.
N.D. Opdyke, J.E.T. Channell, Magnetic Stratigraphy,
Academic Press, San Diego, CA, 1996, 346 pp.
J. Besse, V. Courtillot, Apparent and true polar wander
and geometry of the geomagnetic ¢eld over the last 200
Myr, J. Geophys. Res. 107 (B11) (2002) doi: 10.1029/
2000JB000050.
A. Hallam, J.M. Hancock, J.L. La Brecque, W. Lowrie,
J.E.T. Channell, Jurassic to Paleogene; Part 1, Jurassic
and Cretaceous geochronology and Jurassic to Paleogene
magnetostratigraphy, Geol. Soc. London 10 (1985) 118^
140.
F.M. Gradstein, F.P. Agterberg, J.G. Ogg, J. Hardenbol,
P. van Veen, J. Thierry, Z.H. Huang, A Mesozoic time
scale, J. Geophys. Res. 99 (1994) 24,051^24,074.
J.E.T. Channell, W. Lowrie, F. Medizza, Middle and
Early Cretaceous magnetic stratigraphy from the Cismon
section, northern Italy, Earth Planet. Sci. Lett. 42 (1979)
153^166.
W. Lowrie, J.G. Ogg, A magnetic polarity time scale for
the Early Cretaceous and Late Jurassic, Earth Planet. Sci.
Lett. 76 (1986) 341^349.
J. Vandenberg, C.T. Klootwijk, A.A.H. Wonders, Late
Mesozoic and Cenozoic movements of the Italian Peninsula; further paleomagnetic data from the Umbrian Sequence, Geol. Soc. Am. Bull. 89 (1978) 133^150.
W. Lowrie, W. Alvarez, I. Premoli-Silva, S. Monechi,
Lower Cretaceous magnetic stratigraphy in Umbrian pelagic carbonate rocks, Geophys. J. R. Astron. Soc. 60
(1980) 263^281.
J.A. Tarduno, Brief reversed polarity interval during the
Cretaceous normal polarity superchron, Geology 18
(1990) 683^686.
W.A. Berggren, D.V. Kent, M.P. Aubry, J. Hardenbol,
Time Scales and Global Stratigraphic Correlation, SEPM
Spec. Publ. No. 54, 1995.
P.L. McFadden, F.J. Lowes, The discrimination of mean
directions drawn from Fisher distributions, Geophys. J.
R. Astron. Soc. 67 (1981) 19^33.
M.W. McElhinny, M.A. Smethurst, The global paleomagnetic database: current status, EOS 82 (2001) 436.
V.F. Davydov, A.Y. Kravchinsky, Paleomagnetic directions and pole positions: Data for the USSR ^ Issue 1,
Soviet Geophysical Committee, World Data Center-B,
Moscow, Catalogue, 1971.
P. Tapponnier, Z.Q. Xu, F. Roger, B. Meyer, N. Arnaud,
G. Wittlinger, J.S. Yang, Oblique stepwise rise and
growth of the Tibet plateau, Science 294 (2001) 1671^
1677.
J. Jezek, S. Gilder, Competition of magnetic and hydro-
[38]
[39]
[40]
[41]
[42]
[43]
[44]
[45]
[46]
[47]
[48]
[49]
dynamic forces on ellipsoidal particles under shear: potential in£uence on the recording process of the Earth’s
magnetic ¢eld in sediments, EGS Abstract volume, 2002.
F. Me¤tivier, Y. Gaudemer, Mass transfer between eastern
Tien Shan and adjacent basins (central Asia): constraints
on regional tectonics and topography, Geophys. J. Int.
128 (1997) 1^17.
Y. Chen, S. Gilder, N. Halim, J.-P. Cogne¤, V. Courtillot,
New paleomagnetic constraints on central Asian kinematics: Displacement along the Altyn Tagh fault and rotation
of the Qaidam Basin, Tectonics 21 (2002) 1042.
G. Dupont-Nivet, R.F. Butler, A. Yin, X.H. Chen, Paleomagnetism indicates no Neogene rotation of the Qaidam
Basin in northern Tibet during Indo-Asian collision,
Geology 30 (2002) 263^266.
G. Dupont-Nivet, Z. Guo, R.F. Butler, C. Jia, Discordant
paleomagnetic direction in Miocene rocks from the central Tarim Basin: Evidence for local deformation and inclination shallowing, Earth Planet. Sci. Lett. 199 (2002)
473^482.
Y. Chen, H.N. Wu, V. Courtillot, S. Gilder, Large NS
convergence at the northern edge of the Tibetan plateau?
New Early Cretaceous paleomagnetic data from Hexi
Corridor, NW China, Earth Planet. Sci. Lett. 202 (2002)
293^307.
M.I. Rozinov, L.E. Sholpo, Paleomagnetic directions and
pole positions: Data for the USSR ^ Issue 1, Soviet Geophysical Committee, World Data Center-B, Moscow,
Catalogue, 1971.
E.S. Gorshkov, E.G. Gooskova, V.A. Starunov, T.S.
Tyuleneva, Z. Ganhuyach, P. Khosbayar, Paleomagnitnie
issledovaniya v zentralnoy Mongolii, in: IV All-Union
Congress on Geomagnetism, Vladimir-Suzdal, vol. 2
(1991) 116^117.
Z. Zheng, M. Kono, H. Tsunakawa, G. Kimura, Q. Wei,
X. Zhu, T. Hao, The apparent polar wander path for the
North China Block since the Jurassic, Geophys. J. Int.
104 (1991) 29^40.
X. Zhao, R.S. Coe, Y. Zhou, H. Wu, J. Wang, New paleomagnetic results from northern China collision and
suturing with Siberia and Kazakhstan, Tectonophysics
181 (1990) 43^81.
B.V. Gusev, Paleomagnetic directions and pole positions:
Data for the USSR ^ Issue 2, Soviet Geophysical Committee, World Data Center-B, Moscow, Catalogue, 1973.
N. Halim, J.P. Cogne¤, V.A. Kravchinsky, New Mesozoic
paleomagnetic results from the Mongol-Okhotsk suture
zone: clues on the late Jurassic oceanic closure and the
post-Cretaceous left-lateral shear of the Trans-Ba|«kal area
(Siberia), J. Geophys. Res. (2001) in review.
K.A. Abdullaev et al., Paleomagnetic directions and paleomagnetic pole positions: Data for the former USSR ^
Issue 8, VNIGRI Institute, St. Petersburg (unpublished),
Catalogue, 1993.
EPSL 6483 22-1-03
© Copyright 2026 Paperzz