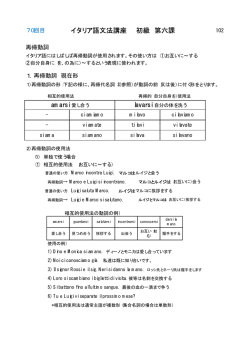
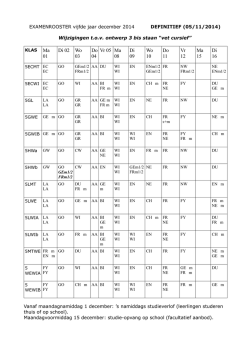
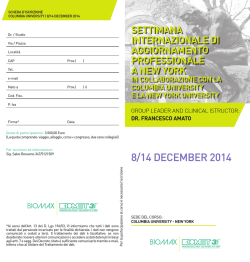
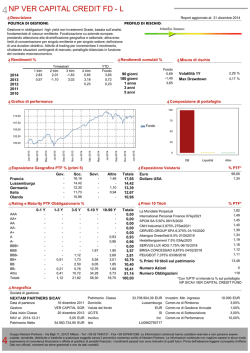
Book Chapter The eruptive activity of 28 and 29 December 2002 PIOLI, Laura, et al. Abstract At 1820 UT of 28 December 2002, an eruptive vent opened on the NE flank of the Sciara del Fuoco (SdF) at 600 m above sea level, marking the onset of the 2002–2003 eruptive crisis of Stromboli volcano. The first eruptive hours were characterized by mild spattering and effusive activity from the new vent and the summit vent at crater 1. Gravitational instability processes also determined the partial collapse of NE walls of the summit cone (crater 1). Pyroclastic material partly accumulated on the NE part of the SdF and partly flowed downslope and reached the sea at Spiaggia dei Gabbiani, forming a ~4-m-thick, reddish avalanche, that was soon covered by a lava flow emitted in the following hours. In this paper, we describe the first hours of activity through eyewitnesses’ reports, geophysical monitoring, field and laboratory studies, of the erupted pyroclastic material and lava flows. Daily temperature measurements were carried out on the avalanche deposit formed by the flow of scoria along the SdF, using a handheld thermal camera mainly during helicopter surveys. A fast cooling rate was typical of the deposit surface, [...] Reference PIOLI, Laura, et al. The eruptive activity of 28 and 29 December 2002. In: S. Calvari, S. Inguaggiato, G. Puglisi, M. Ripepe, M. Rosi. The Stromboli volcano: an integrated study of the 2002-2003 eruption. Washington, USA : American Geophysical Union, 2008. p. 105-115 Available at: http://archive-ouverte.unige.ch/unige:41228 Disclaimer: layout of this document may differ from the published version. The Eruptive Activity of 28 and 29 December 2002 Laura Pioli,1 Mauro Rosi,2 Sonia Calvari,3 Letizia Spampinato,3 Alberto Renzulli,4 and Alessio Di Roberto5 At 1820 UT of 28 December 2002, an eruptive vent opened on the NE flank of the Sciara del Fuoco (SdF) at 600 m above sea level, marking the onset of the 2002–2003 eruptive crisis of Stromboli volcano. The first eruptive hours were characterized by mild spattering and effusive activity from the new vent and the summit vent at crater 1. Gravitational instability processes also determined the partial collapse of NE walls of the summit cone (crater 1). Pyroclastic material partly accumulated on the NE part of the SdF and partly flowed downslope and reached the sea at Spiaggia dei Gabbiani, forming a ~4-m-thick, reddish avalanche, that was soon covered by a lava flow emitted in the following hours. In this paper, we describe the first hours of activity through eyewitnesses’ reports, geophysical monitoring, field and laboratory studies, of the erupted pyroclastic material and lava flows. Daily temperature measurements were carried out on the avalanche deposit formed by the flow of scoria along the SdF, using a handheld thermal camera mainly during helicopter surveys. A fast cooling rate was typical of the deposit surface, and a slow cooling rate was representative of its inner portion. 1. Introduction The Stromboli eruptive crisis of 2002–2003 started on the early evening of 28 December 2002, interrupting highfrequency and energetic Strombolian explosions at the summit vents [Bonaccorso et al., 2003; Tommasi et al., 2004; 1 Department of Geological Sciences, University of Oregon, Eugene, Oregon, USA. 2 Dipartimento di Scineze della Terra, Università di Pisa, Pisa, Italy. 3 Istituto Nazionale di Geofisica e Vulcanologia, Sezione di Catania, Catania, Italy. 4 Istituto di Scienze della Terra, Università di Urbino, Urbino, Italy. 5 Istituto Nazionale di Geofisica e Vulcanologia, Sezione di Pisa, Pisa, Italy. The Stromboli Volcano: An Integrated Study of the 2002–2003 Eruption Geophysical Monograph Series 182 Copyright 2008 by the American Geophysical Union. 10.1029/182GM10 Burton et al., this volume]. The eruptive phenomena were not preceded by significant geophysical precursors and were witnessed by local people. No direct information about fracture formation, deformation, and failure phenomena is available for these early phases; the Istituto Nazionale di Geofisica e Vulcanologia (INGV) optical cameras located on the Pizzo and pointing the summit craters only partially monitored the onset of the crisis, suggesting that at least part of the eruptive phenomena occurred below the crater terrace. The INGV permanent GPS network did not record any significant changes in benchmark position before and during the eruption [Bonaccorso et al., 2003]. The very initial phenomena included the proximal accumulation of a spatter and lithic agglutinate and the emission, from the NE crater, of an unusually fast-moving lava flow, which lined the agglutinate deposit and covered the hot avalanche apron, and the formation of a hot avalanche, which reached the sea in the northern corner of the Sciara del Fuoco (SdF, the unstable NW flank of the volcano, Figure 1). In this work, we present accounts of witnesses, field observation of the deposits carried out during early January 2003, grain size, component, petrography, and chemistry of 105 106 The eruptive activity of 28 and 29 December 2002 Figure 1. Map of the deposit erupted on 28 and 29 December 2002 compared with thermal image taken during a survey made in the morning of 29 December: (1) 1985 lava flow, (2) lava flow 1, (3) lava flow 2, and (4) spatter agglutinate. Numbers on the map indicate the summit craters. The star indicates the outcrop of the hot avalanche deposit. the material emitted in the initial phase of the eruption. The data are used to assess eruptive dynamics, and timing of the phenomena occurred on 28 and 29 December. 2. Methods Eyewitnesses’ observations were collected and crosschecked during interviews conducted in the month of January 2003. Images collected by the INGV video camera from 1600 to 2025 UT of 28 December were also analyzed. The first scientific direct observations (comprising visual and thermal inspection) of the eruption were conducted during a helicopter survey, on the morning of 29 December 2002. Several field surveys were conducted before the deposits were completely covered by lava flows in the upper SdF sector and completely eroded at the coast exposures. Proximal deposits produced during the first hours of the eruption were observed in the days following the onset of the eruption starting from 2 January 2003 during several field inspections conducted inside the SdF. Part of the deposits was displaced from its original position seaward, by slope movements of the northeasternmost sector of the SdF, which also formed a scarp that truncated the 28 December late afternoon deposits. The deposits above and below the scarp, eventually survived the major landslide event of 30 December, which instead affected the sector of the SdF located further west. Samples of the lava flows and pyroclastic fragments were collected from 600m above sea level (asl) outcrops and the coast area and further analyzed for chemical composition, componetry, grain size, and texture. Grain size analyses were performed partly in the field (for the fraction coarser than 5f) and partly in the laboratory with standard dry half sieving techniques. Chemical whole-rock analyses were performed at the Actlabs Laboratory Ltd (Ontario, Canada) by induc- tively coupled plasma–optical emission spectroscopy (ICPOES) for major elements and ICP–mass spectrometry (MS) for trace elements after crushing and powdering the samples in an agate mortar to avoid contamination. Samples for the ICP-OES-MS methods were mixed with a flux of lithium metaborate and lithium tetraborate and fused in an induction furnace. The molten melts were poured into a solution of 5% nitric acid containing an internal standard and mixed continuously until completely dissolved. Errors are ≤1% for major oxides and ≤3% for trace elements. Phenocryst contents were obtained through comparative charts for estimating volume percent of minerals in thin sections. Thermal monitoring was carried out using a TM 695 forward-looking infrared (FLIR) thermal camera. This is capable of acquiring a 320 ´ 240-pixel image every 2 s, and the 24º ´ 18° field of view of the lens equates to a 0.075º ´ 0.1º pixel. Over the typical 1–2 km line of sight distances considered in this study, the pixel size is 1.3–2.6 m. This thermal camera can record images according to three temperature ranges: -40° to 120°C; 0° to 500°C; 350° to 1500°C. To investigate the thermal behavior of the 28 December deposit, we generally used the middle range, taking care to avoid sun reflection or direct solar irradiation that increases apparent temperatures of several tens of Celsius degrees [Calvari and Pinkerton, 2004]. FLIR thermal cameras can automatically calibrate; in fact, if path length, air temperature and relative humidity, and emissivity are input, temperatures corrected for atmospheric and emissivity effects are output. For these purposes, distances were corrected on the basis of observed dimensions of the summit craters, measured during field surveys with a Leica range finder. 3. Results 3.1. INGV Camera Images Timing of the crisis onset was also inferred from the images collected by the INGV video camera, which was installed on the Pizzo Sopra la Fossa area (Figure 1), and was pointing directly toward the summit craters. The wind was blowing to the NE, and any gas plume was rapidly drifted to the same direction. The images revealed that just before the crisis onset, intermittent Strombolian explosions were visible above crater 3 vents, alternating with lower fountaining from craters 2 and 1 (Figure 2). Starting from 1720 UT, diffuse red glowing was visible from an area located below the craters’ rim, east of crater 1, rapidly increasing in intensity. Glowing intensity reached a climax from 1800 to 1900 UT, suggesting that, at least occasionally, the eruptive activity occurred very close to the field of view of the camera. At least four main glowing periods alternated to short pauses Pioli et al. 107 Figure 2. Sequence of Strombolian explosion that occurred at the summit craters from 1500 to 1700 UT (1600–1800 LT) on 28 December 2002. Dots indicate explosions. (~10–15 min) of no visible activity. After the onset of the eruption, the activity at the summit craters consisted of low fountaining mainly visible above the crater 2 area. After 1910 UT, only occasional, low-intensity, red glowing was visible from the main area. A very bright flash resembling lightning was visible in the sky at 1923 UT. Throughout all the observation period, degassing plumes were visible above the crater terrace, flowing to the east of the field of view. 3.2. Eyewitnesses’ Reports Several residents of Stromboli and Ginostra villages witnessed the early phenomena, which started late afternoon of 28 December 2002, making valuable observations on their timing. Description and timing reported by the different witnesses were fairly consistent and provided very useful and valuable information, which complement those started by the scientific personnel of the INGV in the morning of 29 December. Among the interviewed people were Pino Restuccia, Mario Pruiti, and Carlo Lanza. They all have good knowledge of the mountain and made observations from different spots on the SdF borders in the first 4 h after the onset of the eruption. People in both Stromboli and Ginostra villages noticed an intense, persistent glowing at the summit of the mountain between 1700 and 1800 UT. The onset of the glowing was followed minutes later by the raising of a white steam column from a location close to the SdF shoreline. For the residents of Stromboli village, this was immediately perceived as indicating that hot, fast-moving material had reached the sea. Pruiti reached the viewpoint of Punta dei Corvi on the west side of the SdF between 1730 and 1800 UT and observed two distinct fans of hot water originating from two points on the coastline of the SdF. Restuccia refers that, after the onset of the phenomena, he was hearing for sometime a sound like “a river of stone” from the SdF and that the sound was accompanied by the vertical rising of ashladen clouds from the whole northeastern side of the SdF. While reaching Punta Labronzo, he was engulfed in a dense ash cloud and hit by a shower of lapilli and sand. Because the wind was blowing from NW, the only possible source of the lapilli was from explosions that originated at the Spiaggia dei Gabbiani where the first hot material had reached the seashore. Between 1800 and 1900 UT, two lavas descending the SdF had also reached the sea. The one flowing along the northeastern border of the SdF was extremely fast and reached the Spiaggia dei Gabbiani between 1745 and 1800 UT, with an estimated speed of 4–9 km/h [Lodato et al., 2007]. As soon as the lava entered the sea, it produced a large mass of vapor carrying droplets of salty water. The westernmost one was slower and reached the sea a little later but within the same time interval. Between 1800 and 1830 GMT, Lanza, from a spot at 700 m asl, observed that the fastmoving lava flow originated by an overflow from the northeastern crater. Later on, between 1830 and 1900 UT, from this same place, Restuccia reported that the overflow was over, the NE cone was still intact, but two lava vents were active at the foot of the cone. One was located where the hornitos of May–June 2003 would have later formed; the other one was located more inside the SdF at higher elevation. The eruptive scene was clearly visible due to the glowing of the active lava flows. At about 1900 UT, when he was on his way back between 700 and 400 m asl along the pathway, he heard a loud sound. A few minutes later, he observed a flow moving at high speed along the SdF slope; it was “getting bigger as it advanced.” According to the witnesses who reached Punta Labronzo later between 2000 and 2100 UT, the lava flow activity had either substantially decreased or ceased. 108 The eruptive activity of 28 and 29 December 2002 Figure 3. (a) Aerial picture of the proximal deposits, (b) spatter agglutinate, (c) burnt vegetation on the hot avalanche path, (d) large lava block embedded in the spatter agglutinate in very proximal location, (e) lava flow 1, and (f) lava flows 1 and 2. A thin ash pyroclastic layer is separating the two flows. 3.3. Field Observations Products of the activity of December 28 and 29 consisted of pyroclastic deposits overlain by lava flows (Figures 1, 3a, and 3b). Pyroclastic deposits consisted of a spatter agglutinate (high portion of the SdF) and pyroclastic flow breccia (coast area, Spiaggia dei Gabbiani). Three lava flows, which originated from distinct vents in the high portion of the SdF and extending to the sea, were also visible from thermal images collected on the mornings of 29 and 30 December 2002 [Calvari et al., 2005, Figures 1 and 3]. A notch was visible on the east rim of crater 1, due to a collapse event. 3.3.1. Pyroclastic deposits. The spatter agglutinate was dispersed over an area of about 2–3 ´ 104 m2 and was partly covered by the overlying lava flows. A maximum thickness of 7 m was observed in cracks, but the total thickness in proximal areas wall was probably grater than 10–20 m. Downslope, it consisted of tens of meters wide and hundreds of meters of long slab spatter deposit bearing up to 2-m-diameter fresh lava blocks (Figure 3d). The deposit was roughly stratified, consisting from base to top of a loose breccia and spatter bed (1–2 m) overlain by moderately agglutinated spatter and lithic bed (2 m) followed upward by another bed of loose breccia and spatter. A cross section of the deposits was still visible on the Bastimento scarp in the first months of 2003. On higher areas on the east SdF rim, burnt vegetation and a thin ash layer likely marked the pyroclastic flow path (Figure 3c). Along the coast, progressive erosion of the lava flow uncovered a pyroclastic breccia apron, with maximum lateral extension of about 30 m and maximum thickness of about 5 m (Figure 4a). The deposit was marked by a sharp contact with the substrate, constituted by loose debris from old vol- Pioli et al. 109 Figure 4. (a) Hot avalanche deposit at the Spiaggia dei Gabbiani. (b) Breadcrust bombs. (c) Cored bomb. (d) Xenolith fragment on lava flow overlying the hot avalanche. canics. The deposit consisted of two units: a lower, reddish breccia and an upper, finer grained, light-colored, discontinuous layer up to 1.5 m thick. The lower breccia was massive, except for the occurrence of discontinuous, meter-sized clast-supported lenses occurring at different stratigraphic heights. It had a bimodal grain size distribution, with two main modes at +2 and -5/-6f. The upper layer is finer with a coarse mode at -4 and a fine mode at +1f (A. Solano, Interazione tra fenomeni eruttivi e gravitativi di versante durante la crisi del 28–30 Dicembre 2002 a Stromboli, Università di Pisa, unpublished thesis, 2005; hereinafter referred to as Solano, unpublished thesis, 2005); sorting is very poor ranging from 3.1 to 3.7 in the lower layer and from 2.7 to 2.8 in the upper one. Juvenile clasts constitute 36–71 wt % of the deposit and consist of poorly vesicular, contorted to bent, or stretched spatter, with cauliflower structure (Figure 4d; Solano, unpublished thesis, 2005). The fragments are porphyritic, with phenocryst assemblage closely matching that of the overlying lava flow. Groundmass is generally cryptocrystalline except the external, millimeter-thick rim that is glassy and unaltered. Olivine phenocrysts show deuteric alteration comparable to crystals in the overlying lava flow. Glassy (tachylite) fragments occur in the finer fraction (≤8 mm). Their concentration is maximum at the very base of the deposit (where glassy fragments >1 mm constitute 8 wt % of the bulk material) and is variable in the remaining samples (the same fraction constitutes from 0 to 0.5 wt % of the bulk sample). Some of the larger clasts have cored structure. The core consists of lithic, altered scoria fragments with diameters of between 10 and 3 cm (Figure 4c). Density of juvenile fragments with a diameter ranging from 6.4 to 1.1 cm was measured over a population of 162 specimens collected from nine different areas in the outcrop. Average density is 2360 ± 132 kg/m3, corresponding to a vesicularity of 18% ± 4% (for measured DRE density = 2880 kg/m3; Solano, unpublished thesis, 2005). Representative lithic blocks within the hot avalanche deposit show two distinct lavas composition: (1) basalts and (2) trachytes. The basaltic lithic blocks consist of highly porphyritic (35%–45%) lavas with seriate texture and pheno 110 The eruptive activity of 28 and 29 December 2002 crysts of plagioclase > clinopyroxene (up to 4 mm) ≥ olivine (Figure 5b); groundmass is mainly microcryptocrystalline, and accessory phases are represented by abundant opaque microlite grains. Olivine can be partially replaced by iddingsite, and all plagioclases phenocrysts show a strong sieve texture. Trachytes are characterized by a porphyritic index between 10% and 15%, with phenocrysts and micropheno crysts represented by plagioclase (up to 7 mm) > clinopy- Figure 5. Thin-section petrography of representative lithic lavas in the hot avalanche, (a) SDG1 and (b) SDG4, and the 28 December thin lava flow, (c) SDG3, were taken at the Spiaggia dei Gabbiani outcrops. roxene > biotite ≥ amphibole, set in a microcryptocrystalline groundmass (Figure 5a) with some pilotassitic domains. Quenched microlite laths of feldspar (swallow-tailed habitus) are abundant. Accessory phases consist of apatite and opaque minerals, whereas olivine xenocrysts and glomerophyres of plagioclase + clinopyroxene ± biotite ± opaque minerals. Modal mineralogy and textures of the basalt and trachyte lithic blocks closely match those of the lavas erupted during (1) recent to present-day Stromboli and (2) Upper Vancori volcanostratigraphic periods [Hornig-Kjarsgaard et al., 1993], respectively. Major and trace element compositions (Table 1 and Figure 6) further support the provenance of the lithic lavas mainly from the above volcanostratigraphic periods of Stromboli. A scoria flow deposit was also identified on the west of the lava/pyroclastic apron. The deposit was formed by centimeter- to decimeter-sized, stretched to twisted scoria fragments, in all similar to the juvenile components of the lower breccia. The flow was up to 15 m wide and comprised lateral levees up to 50 cm high. 3.3.2. Lava flows. Three lava flows were visible on the morning of 29 December (Figure 1); they fed two aprons located east and west of the old 1985 lava flow on the Spiaggia dei Gabbiani. These flows were not active on December 29 [Calvari et al., 2005]. The same flows were later covered above 450 m asl by further lava emission, which occurred during the eruptive crisis; by the end of which only the distal portion east of the 1985 lava apron was still preserved. Where overlapping, the two flows were separated by a fewmillimeters-thick ash layer (Figure 3e). Lava flows consisted of pahoehoe and subordinate a′a lavas either overlying preeruption material or the spatter and breccia deposits. Exceptionally smooth and horizontal lava surface formed close to the sidewall of the SdF where the lava pond due to the former presence of a local counter slope left by the 1985 lavas. With the exception of limited amount of a′a lavas formed in the inner part of small valleys, the pahoehoe lava formed a fairly large sheetlike lava leaving, on very inclined slopes, only a decimeter-thick lava veneer (Figure 3f). It is worth noticing, however, that the topography had limited control on the flow, suggesting very high thickness of the flow and thus high mass flow rate. The high mass flow rate had to be combined with an exceptionally low kinematic viscosity as the lava deposit showed features consistent with turbulent flow, determining the formation of spatter on the side of the channel. The lava consists of approximately 26% plagioclase, 8% olivine, and 6% clinopyroxene with a seriate texture and microcrystalline to cryptocrystalline groundmass. Accessory phases are mainly represented by opaque minerals. Chemical Pioli et al. 111 Table 1. Major and Trace Element Compositions of the Lithic Fragments Within the Hot Avalanche (SDG1, 2, 4, and 5) and the Thin Lava Flow (SDG3), Erupted on 29 December 2002 Sample SiO2 Al2O3 Fe2O3 MnO MgO CaO Na2O K2O TiO2 P2O5 L.O.I. Total V Cr Co Ni Rb Sr Y Zr Nb Ba La Ce Pr Nd Sm Eu Gd Tb Dy Ho Er Tm Yb Lu Hf Ta Tl Pb Th U SDG1 SDG2 SDG4 Major Elements (ICP-OES) 60.63 62.36 50.27 16.87 17.12 17.05 5.24 4.97 8.58 0.11 0.15 0.15 2.09 1.46 6.31 4.6 3.85 11.19 4.08 4.35 2.47 4.08 4.27 2.16 0.61 0.58 0.92 0.35 0.31 0.55 0.61 0.13 -0.12 99.26 99.55 99.52 Trace Elements (ICP-MS) 81 64 260 < 20 < 20 57 8.8 6.5 27.4 26 < 20 42 123 131 67 531 519 761 30 31 25 284 293 158 30 31 21 1380 1460 1070 63 68 45 128 138 98 12.7 13.4 10.2 47 49 41 8.4 8.8 8.3 2.0 2.0 2.2 6.5 6.3 6.6 1.01 1.04 1.02 5.7 5.9 5.3 1.09 1.14 0.94 3.3 3.5 2.7 0.49 0.51 0.36 3.2 3.4 2.3 0.49 0.52 0.33 6.7 6.9 3.9 1.7 1.8 1.1 0.16 0.25 < 0.1 21 15 14 28 30 16 7.1 7.6 4.1 SDG5 SDG3 50.42 17.54 8.61 0.15 6.05 11.02 2.56 2.26 0.93 0.57 -0.14 99.95 50.41 17.17 8.62 0.16 6.31 11.19 2.48 2.19 0.92 0.55 -0.01 99.9 236 51 26.8 41 67 755 24 157 21 1060 46 100 10.4 42 8.2 2.2 6.6 1.02 5.1 0.95 2.7 0.37 2.3 0.34 3.9 1.1 < 0.1 14 16 4.1 238 55 26.7 39 64 714 24 151 20 1010 44 96 10.2 41 8.2 2.1 6.5 0.94 5.2 0.95 2.6 0.36 2.3 0.33 3.8 1.1 < 0.1 17 16 4.0 composition (Table 1; Figure 6) is similar to the present-day Stromboli basalts. Texture, glass composition, and mineral chemistry [Landi et al., 2006; Bertagnini et al., this volume] of the 28 December lava flow do not show variations with respect to those of both the porphyritic basaltic scoria normally erupted during the mild explosions of past decades and the following effusive products of the whole 2002–2003 eruptive crisis. Also, Sr–Nd isotopic compositions of the 28 December lava flow [Landi et al., 2006] is in the range of the crystal-rich magmas of the present-day activity. Rounded, centimeter- to decimeter-size xenolithic fragments are dispersed in the massive portion of the lava flow (Figure 4d). They are reddish, macrovesicular scoria, similar to those usually ejected by the normal Strombolian activity. It is worth to note that olivine phenocrysts in the thin lava flow at Spiaggia dei Gabbiani shows a severe alteration under oxidizing conditions. They are mostly replaced by iddingsite and large pervasive Fe–Ti oxides only in this outcrop, where the thin lava flows covered the hot avalanche. By contrast, in the shelly pahoehoe lava in the upper flank of the volcano, olivine crystals are fresh. Olivine with reddish to opaque mineral patches in the lava outcrop of Spiaggia dei Gabbiani is therefore the result of deuteric intermediate temperature alteration [Baker and Haggerty, 1967] to subsolidus hightemperature reheating [Haggerty and Baker, 1967]. Due to thickness of 1–2 m, the lava flow underwent a rapid cooling but the underlying hot avalanche could have continued to release hot fluid for days, and therefore, continuous subsolidus reheating of the olivine in the overlying thin lava flows can be inferred. Northward, the lavas and underlying breccia and agglutinated deposits were truncated by seaward slope displacement that occurred in the late evening and night of 28 December. The same movements were likely responsible for the fracturing of the agglutinate downslope of the eruptive vent. Figure 6. K2O–SiO2 diagram (whole-rock analyses) of the lithic lavas found in the hot avalanche of the 28 December 2002 and the superimposed thin lava flow. 112 The eruptive activity of 28 and 29 December 2002 Figure 7. Photo on the left and thermal image on the right, both collected on 29 December 2002, of the hot avalanche that emplaced on Spiaggia dei Gabbiani on 28 December. The dotted line in the photo bounds the portion of the avalanche imaged on the right. 3.4. Thermal Surveys Thermal images of the 28 December hot avalanche (Figure 7) were regularly performed from 29 December 2002 to 29 September 2003 [Calvari et al., 2005]. After this date, the deposit was no longer visible because it was covered by the upper lava flow. In particular, between 29 December and the first half of February, thermal imaging was extremely useful in detecting the daily maximum apparent temperatures of the avalanche [Figure 8a; Calvari et al., 2005]. From the end of February, thermal measurements were irregular. On 29 December, after a day from the emplacement, the deposit had maximum apparent temperature of 368°C (Figure 8a). Through time, temperature showed a general declining trend characterized by a number of sudden, unexpected peaks. These anomalies were recorded on 2, 8, and 9 January, 6 and 14 February, 13 March, and 2 June 2003. In Figure 8a, these anomalies are represented with red dots numbered from 1 to 8, respectively. Dots 1, 2, and 7 in Figure 8a are not real temperature increases; they are simply associated with shorter path lengths from which thermal images were taken with respect to the other day measurements. Peaks 3 to 7 in Figure 8a were due instead to real increases of apparent temperatures produced by the occurrence of local collapses of the deposit front exposing hot deposit core (Figure 8b). The frequent exposures of the avalanche section allowed the clear discrimination between the cold external skin (crust) of the deposit, the crust, and the hot inner portion (core) of the deposit interior. Assuming that the temperature of 29 December (368°C) corresponded to the initial temperature of the deposit emplacement, it was possible to discriminate between the mean cooling trend of the external crust and that of the deposit core. In the period observed, crust apparent temperatures decreased from 368°C on 29 December 2002 to 25°C on 29 September 2003, whereas the lowest maximum apparent temperature recorded at the inner portion (96°C) was associated with the 13 March 2003 front collapse (dot 7 in Figure 8a). The lower temperature recorded on 13 January (dot 5 in Figure 8a) with respect to 14 February (dot 6 in Figure 8a) could be explained taking into account the width of the hot area exposed at the surface or/and to external features (e.g., presence of ash, steam, weather conditions) attenuating the radiance detected by the camera. 4. Data Interpretation 4.1. Eruptive Dynamics The 2002–2003 eruptive crisis of Stromboli volcano was preceded by several months of high intensity activity, related to a very high magma level in the shallow main summit con- Figure 8. (a) Graph showing the variability of the maximum apparent temperatures recorded at the avalanche deposit surface between 29 December 2002 and 29 September 2003. The black dots indicate thermal anomalies interrupting the gradual decreasing cooling trend. (b) Thermal image collected on 14 February 2003 showing the high temperature of the avalanche core (lighter colors), exposed to the surface by sea erosion, contrasting the cold avalanche crust (darker colors). The dotted line represents the new shape of the deposit foot as a result of the sea erosion processes and collapses. Pioli et al. 113 Figure 9. Main phases of the eruption: (a) magma intrusion along a shallow dike, (b) vent opening and onset of low fountaining, and (c) lava output from vent at crater 1. duit system, which culminated in the onset of the 2002–2003 effusive crisis on 28 December 2002 [Bonaccorso et al., 2003; Calvari et al., 2005; Burton et al., this volume]. Eyewitnesses’ observations and the INGV video camera (although not directly monitoring the eruptive activity) suggest that the crisis started around 1720 UT with the opening of an eruptive vent NE of the summit craters and that the first eruptive phase lasted approximately 3 h. Repeated glowing, as shown by the INGV camera and layering of the main welded deposit could be related to repeated eruptive pulses. The onset of a lateral eruption did not immediately “shut off” the main summit conduits system, but the activity at the summit vents strongly decreased in intensity; spattering and degassing were still occurring up to 1840 UT, likely during the spatter fountaining or flowing of the first lava. The crisis that started with an explosive event depositing a lithic-rich spatter agglutinate on the SdF and the hot avalanche are related to mild explosive activity and vent opening on the SdF (Figure 9). We interpret the unusual high lithic content of the deposit (Figure 3b) as related to explosive incorporation of wall rocks during the vent opening. Lateral thickness and grain size variations indicate that the source area for the spatter deposit was likely located close to the Bastimento scarf. Stratigraphic relationship and component also suggest that the hot avalanche on the Spiaggia dei Gabbiani was likely deposited by a secondary pyroclastic flow formed by gravitational instability of the peripheral portion of spatter deposit accumulating over the SdF. Another possibility for the formation of the agglutinate is through low fountaining at crater 1 associated to lava emission and collapse of the north cone walls, as suggested by Calvari et al. [2005]. However, abundant occurrence of fresh lava blocks up to several meters wide in the spatter agglutinate (Figure 3d) and in the hot avalanche deposits, likely originating from the fragmentation of old lavas preserved in the shallow portion of the volcano, but not part of the summit cone structure, better accord with the first hypothesis (i.e., initial vent at ~650 m at the east rim of SdF). The nature of these lithic clasts also differs from the xenoliths in the lower lava flow, exclusively constituted by rounded, highly vesicular, basaltic scoria fragments, eventually picked up by the lava while flowing out of the crater 1. Lava emission started after the emplacement of the hot avalanche; Calvari et al. [2005], using thermal monitoring data, also estimated the maximum lava flow rate (~280 m3/s). These flows likely determined significant drainage of magma from the summit conduits system, lowering of the magma level, ending the summit explosive activity. After this short-lived flow, an eruptive pause (likely marked by small phreatic explosions, covering the lava flow surface with lithic ash, as shown in Figure 3e) occurred. On the NW side, the uppermost lavas were sharply truncated by the scar formed on the NE flank of cone 1 making it difficult to unequivocally assess in the field from which vent they had been erupted. Some authors [Bonaccorso et al., 2003; Calvari et al., 2005; Acocella et al., 2006] suggest that they originated from an eruptive fracture extending from the rim of cone 1 to the NE, determined by a shallow dike intrusion and accompanied by partial collapse of the cone itself on the north side. Pompilio [2003] and Tommasi et al. [2004] suggested that the explosive activity occurred from a vent located at 650 m asl, at the east rim of the SdF [Tommasi et al., 2004, Figure 9, vent 1]; for the same authors, this vent also fed the first lava flow. A second lava flow issued from a vent located at 550 m asl in the SdF. This flow covered 114 The eruptive activity of 28 and 29 December 2002 the western branch of the first lava flow at the Spiaggia dei Gabbiani. 4.2. Thermal Surveys Daily thermal measurements enabled us the study of the thermal behavior of the 28 December hot avalanche. The range of maximum temperatures found for this deposit (250°–350°C, Figure 8a), a few hours after the emplacement, fitted within the range obtained with the thermal remnant magnetization technique on different types of pyroclastic density currents from the A.D. 79 eruption of Vesuvius [Cioni et al., 2004] and within the range of temperature for derived pyroclastic flows at Montserrat, measured within 72 h of deposit emplacement [Calder et al., 1999]. Between 29 December 2002 and 14 February 2003, regular daily measurements were carried out. The apparent temperatures recorded during this interval allowed us to estimate the cooling rate for the outer part of the deposit. This was significantly high, resulting in about 37.7°C/d. Conversely, although the exact timing of the front collapse of 14 February was unclear, the maximum apparent temperature recorded that day suggested a maximum cooling rate of 0.66°C/d for the inner portion of the deposit. Over a period of 9 months, this results in an estimated cooling rate of 1.25°C/d for the outer part. For the core, we could carry out this evaluation only until 13 March, resulting in a cooling rate of ≈0.31°C/d. Collapses of the front of the deposit proved the existence of an inner portion of the deposit characterized by high temperatures and still relatively low density (poor clast cohesion), which showed decrease in apparent temperatures of only 30°C after 30 d. As for pyroclastic density current deposits, the fast cooling of the outer part was mainly due to external parameters, such as rainfalls and external waters, air ingestion, deposit transport processes, and emplacement [Martí et al. 1991; Cioni et al., 2004]. The cooling of the inner portion might be strictly linked to the shape of the deposit, morphology, and thickness. On 14 February 2003, the combination of the still relatively high temperatures and the poor cohesion of the core, with the efficiency of sea erosion, allowed the drainage of an inner portion of the deposit with the formation of a small, short-lived secondary flow (Figure 8b). 5. Conclusions We have reconstructed the first day of the eruption through eyewitnesses’ observations, field studies, and thermal monitoring of the deposits. The onset was related to shallow lava intrusion in the SdF, eventually evolved in the opening of two vents located at 670 and 550 m asl. Intense fountaining from the upper vent determined local accumulation of spatter and the formation of a pyroclastic flow, likely related to gravitational instability due to accumulation on the SdF slope. We then propose this eruptive sequence for the 28 December 2002 events: (1) shallow-dike emplacement on the west SdF below the crater terrace, during energetic Strombolian activity and high magma level at the summit conduits; (2) opening of a vent at ~650 m asl (~1720 UT) and occurrence of repeated low fountaining events determining spatter agglutination in the proximal areas and formation of a hot avalanche due to gravitational instability of the deposit over steep slopes; (3) lava emission from a new vent; (4) lowering of magma level, end of lava flow; (5) cessation of eruptive activity at summit craters ~2000 UT; (6) collapse of the NE flank of cone 1 and formation of the crater notch; (7) opening of a new vent at 580 m asl and emission of a new lava flow. Acknowledgments. The authors are grateful to A. Solano for extensive help in field and laboratory activities and L. Lodato collecting the thermal images used in this paper. They also thank E. Boschi, A. Bonaccorso, and all their colleagues in INGV from Catania, Palermo, Naples, Rome, and Milan for their support and contribution to the monitoring of the eruption; G. Bertolaso and the Italian Civil Protection for their substantial support of our activities; M. Zaia (Zazà), M. Pruiti, and the Alpine Guides of Stromboli for their field assistance; the helicopter pilots of Air Walser and of the Italian Civil Protection, whose great expertise and courage allowed us to collect a huge amount of data. This work was financially supported by INGV and the Dipartimento di Protezione Civile through the project “Monitoring and Research Activity at Stromboli and Panarea” (V2/10 for M.R. and V2/18 for A.R.). L.P. was partly founded by NSF EAR0510493. References Acocella, V., M. Neri, and P. Scarlato (2006), Understanding shallow magma emplacement at volcanoes: Orthogonal feeder dikes during the 2002–2003 Stromboli (Italy) eruption, Geophys. Res. Lett., 33, L17310, doi:10.1029/2006GL026862. Baker, I., and S. E. Haggerty (1967), The alteration of olivine in basaltic and associated lavas. Part I. Intermediate and low temperature alteration, Contrib. Mineral. Petrol., 16, 258–273. Bertagnini, A., L. Francalanci, P. Landi, N. Metrich, and M. Pompilio (2008), Volcanology and petrology of the present day activity, this volume. Bonaccorso, A., S. Calvari, G. Garfì, L. Lodato, and D. Patanè (2003), Dynamics of the December 2002 flank failure and tsunami at Stromboli volcano inferred by volcanological and geophysical observations, Geophys. Res. Lett., 30(18), 1941, doi:10.1029/2003GL017702. Burton, M., S. Calvari, L. Lodato, L. Spampinato, S. Mangiagli, E. Pecora, N. A. Pino, E. Marchetti, and F. Muré (2008), The state of the volcano before the eruption onset, this volume. Pioli et al. 115 Calder, E. S., P. D. Cole, W. B. Dade, T. H. Druitt, R. P. Hoblitt, H. E. Huppert, L. Ritchie, R. S. J. Sparks, and S. R. Young (1999), Mobility of pyroclastic flows and surges at the Soufriere Hills Volcano, Montserrat, Geophys. Res. Lett., 26, 537–540. Calvari S., and H. Pinkerton (2004), Birth, growth and morphologic evolution of the “Laghetto” cinder cone during the 2001 Etna eruption, J. Volcanol. Geotherm. Res., 132, 225–239. Calvari, S., L. Spampinato, L. Lodato, A. J. L. Harris, M. R. Patrick, J. Dehn, M. R. Burton, and D. Andronico (2005), Chronology and complex volcanic processes during the 2002–2003 flank eruption at Stromboli volcano (Italy) reconstructed from direct observations and surveys with a handheld thermal camera, J. Geophys. Res., 110, B02201, doi:10.1029/2004JB003129. Calvari, S., L. Spampinato, and L. Lodato (2006), The 5 April 2003 vulcanian paroxysmal explosion at Stromboli volcano (Italy) from field observations and thermal data, J. Volcanol. Geotherm. Res., 149, 160–175. Cioni, R., L. Gurioli, R. Lanza, and E. Zanella (2004), Temperatures of the A.D. 79 pyroclastic density current deposits (Vesuvius, Italy), J. Geophys. Res., 109, B02207, doi:10.1029/ 2002JB002251. Haggerty, S. E., and I. Baker (1967), The alteration of olivine in basaltic and associated lavas. Part I. High temperature alteration, Contrib. Mineral. Petrol., 16, 233–257. Harris, A., J. Dehn, M. Patrick, S. Calvari, M. Ripepe, and L. Lodato (2005), Lava effusion rates from hand-held thermal infrared imagery: An example from the June 2003 effusive activity at Stromboli, Bull. Volcanol., 68, 107–117. Hornig-Kjarsgaard, I., J. Keller, U. Koberski, E. Stadlbauer, L. Francalanci, and R. Lenhart (1993), Geology, stratigraphy and volcanological evolution of the island of Stromboli, Aeolian arc, Italy, Acta Vulcanol., 3, 21–68. Landi, P., L. Francalanci, M. Pompilio, M. Rosi, M. A. Corsaro, C. M. Petrone, I. Cardini, and L. Miraglia (2006), The December 2002–July 2003 effusive event at Stromboli volcano, Italy: In- sights into the shallow plumbing system by petrochemical studies, J. Volcanol. Geotherm. Res., 155, 263–284. Lodato, L., L. Spampinato, A. J. L. Harris, S. Calvari, J. Dehn, and M. R. Patrick (2007), The morphology and evolution of the Stromboli 2002–03 lava flow field: An example of a basaltic flow field emplaced on a steep slope, Bull. Volcanol., 69, 661–679. Martí, J., J. L. Diez-Gil, and R. Ortiz (1991), Conduction model for the thermal influence of lithic clasts in mixtures of hot gases and ejecta, J. Geophys. Res., 96, 21,879–21,885. Pompilio, M. (2003), Cronologia dell’eruzione, localizzazione emigrazione delle bocche eruttive, INGV Internal Report (in Italian), 16 pp. Tinti, S., A. Mannucci, G. Pagnoni, A. Armigliato, and F. Zaniboni (2005), The 30 december 2002 landslide-induced tsunamis in Stromboli: Sequence of events reconstructed from the eyewitnesses accounts, Nat. Hazards Earth Syst. Sci., 5, 763–775. Tommasi P., F. Chiocci, M. Marsella, M. Coltelli, and M. Pompilio, Preliminary analysis of the December 2002 instability phenomena at Stromboli volcano. Proceedings of the Int Symp Flows, Sorrento, 15–16 May 2004. S. Calvari and L. Spampinato, Istituto Nazionale di Geofisica e Vulcanologia, Sezione di Catania, Catania, Piazza Roma 2, 95123 Catania, Italy. A. Di Roberto, Istituto Nazionale di Geofisica e Vulcanologia, Sezione di Pisa, Via della Faggiola 32, 56123 Pisa, Italy. L. Pioli, Department of Geological Sciences, University of Oregon, 1272 University of Oregon, Eugene, OR 97403, USA. (pioli@ dst.unipi.it) A. Renzulli, Istituto di Scienze della Terra, Università di Urbino, Campus Scientifico, 61029 Urbino, Italy. M. Rosi, Dipartimento di Scienze della Terra, Università di Pisa, Via Santa Maria 53, 56126 Pisa, Italy.
© Copyright 2026 Paperzz