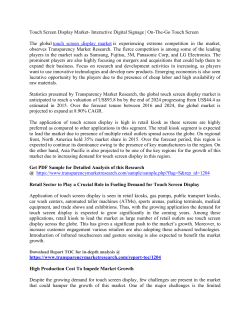
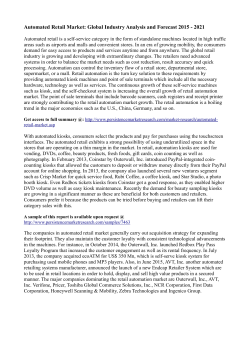
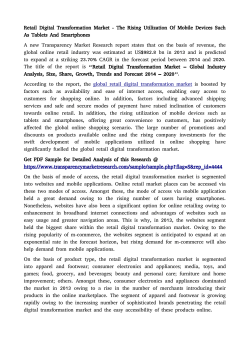
Statistical release
P6201
Retail trade industry, 2009
(Preliminary)
Embargoed until:
07 December 2010
11:00
Enquiries:
User Information Services
012 310 8600/8351
Statistics South Africa
1
P6201
Table of contents
1
Summary of findings for the year 2009...................................................................................................................................................................................................... 2
Figure 1 − Income in the retail trade industry, 2009....................................................................................................................................................................................... 2
Figure 2 − Income by enterprise size in the retail trade industry, 2009 .......................................................................................................................................................... 2
Figure 3 − Composition of expenditure in the retail trade industry, 2009 ....................................................................................................................................................... 3
Figure 4 – Profit margin in the retail trade industry, 2009 .............................................................................................................................................................................. 3
Figure 5 – Capital expenditure on new assets in the retail trade industry, 2009 ............................................................................................................................................ 4
Figure 6 – Employment in the retail trade industry, 2009............................................................................................................................................................................... 4
Figure 7 – Employment by enterprise size in the retail trade industry, 2009 .................................................................................................................................................. 5
Figure 8 – Gender ratios in the retail trade industry, 2009 ............................................................................................................................................................................. 5
2
Tables ........................................................................................................................................................................................................................................................... 6
Table 1 – Principal statistics in the retail trade industry, 2009 ....................................................................................................................................................................... 6
Table 2 – Income in the retail trade industry, 2009 ........................................................................................................................................................................................ 7
Table 3 – Income by enterprise size in the retail trade industry, 2009 ........................................................................................................................................................... 8
Table 4 – Expenditure in the retail trade industry, 2009................................................................................................................................................................................. 9
Table 5 – Carrying value of assets at the end of financial year in the retail trade industry, 2009 ................................................................................................................. 12
Table 6 – Details of assets in the retail trade industry, 2009........................................................................................................................................................................ 13
Table 7 – Detail of liabilities and equity in the retail trade industry, 2009..................................................................................................................................................... 14
Table 8 – Capital expenditure on new assets in the retail trade industry, 2009 ........................................................................................................................................... 15
Table 9 – Employment in the retail trade industry, 2009 .............................................................................................................................................................................. 16
Table 10 – Employment by enterprise size in the retail trade industry, 2009 ............................................................................................................................................... 17
Explanatory notes............................................................................................................................................................................................................................................ 18
Table A – Size groups for the retail trade industry ............................................................................................................................................................................................. 19
Table B – Income in the retail trade industry within 95% confidence limit: 2009 ................................................................................................................................................ 20
Glossary ........................................................................................................................................................................................................................................................... 22
General information......................................................................................................................................................................................................................................... 25
Retail trade industry, 2009
2
Statistics South Africa
1.
P6201
Summary of findings for the year 2009
Figure 1 − Income in the retail trade industry, 2009
Sum of all other
retail trade
R146 730m (30%)
Figure 2 − Income by enterprise size in the retail trade industry, 2009
Non-specialised
stores with food,
beverages and
tobacco
predominating
R153 368m (32%)
Medium enterprises
R35 466m (7%)
Micro enterprises
R36 234m (7%)
Small enterprises
R55 000m (11%)
Other
non-specialised
stores
R43 943m (9%)
Food, beverages
and tobacco in
specialised stores
R44 912m (9%)
Textiles, clothing,
footwear and leather
goods
R97 984m (20%)
The total income for the retail trade industry in 2009 was R486 937 million. The
largest contributor to the total income was ‘non-specialised stores with food,
beverages and tobacco predominating’ (R153 368 million or 32%), followed by
‘textiles, clothing, footwear and leather goods’ (R97 984 million or 20%) and
‘food, beverages and tobacco in specialised stores’ (R44 912 million or 9%)
(Figure 1 and Table 2, pages 7).
Large enterprises
R360 237m (75%)
Large enterprises (those with turnover equal to or greater than R39 million)
generated 75% or R360 237 million of the total income of the retail trade industry
in 2009 (Figure 2 and Table 3, page 8).
Retail trade industry, 2009
3
Statistics South Africa
Figure 3 − Composition of expenditure in the retail trade industry, 2009
P6201
Figure 4 – Profit margin in the retail trade industry, 2009
0,4
Food, beverages and tobacco in specialised stores
Sum of all other
expenditure items
R47 932m (10%)
Depreciation
R6 360m (1%)
Rental of land
R15 242m (3%)
Salaries and wages
R46 457m (10%)
Other retail sale not in stores
1,7
Non-specialised stores with food, beverages and tobacco
predominating
1,9
Pharmaceutical and medical goods, cosmetic and toilet
articles
2,6
Other non-specialised stores
2,7
Household furniture, appliances, articles and equipment
2,8
3,2
Second-hand goods in stores
Purchases
R351 141m (76%)
Repair of personal and household goods
3,8
Total
3,9
Other specialised stores
3,9
Hardware, paints and glass
4,0
Textiles, clothing, footwear and leather goods
10,8
0.0
Expenditure in the retail trade industry in 2009 amounted to R467 132 million.
The expenditure consisted primarily of ‘purchases’ (R351 141 million or 76%),
followed by ‘salaries and wages’ (R46 457 million or 10%), ‘rental of land’
(R15 242 million or 3%) and ‘depreciation’ (R6 360 million or 1%) (Figure 3
and Table 4, pages 9–11).
2.0
4.0
6.0
8.0
10.0
12.0
The profit margin for the retail trade industry was 3,9% in 2009. ‘Textiles,
clothing, footwear and leather goods’ had the highest profit margin at 10,8%,
followed by ‘hardware, paints and glass’ at 4,0% and ‘other specialised stores’ at
3,9% (Figure 4 and Table 1, page 6).
Retail trade industry, 2009
4
Statistics South Africa
Figure 5 – Capital expenditure on new assets in the retail trade industry,
2009
Other capital
expenditure
Computer
equipment and R582m (8%)
software
R550m (7%)
P6201
Figure 6 – Employment in the retail trade industry, 2009
Non-specialised
stores with food,
beverages and
tobacco
predominating
142 560 (24%)
Sum of all other
retail trade
207 488 (35%)
Land, buildings and
construction
R787m (10%)
Vehicles
R1 072m (14%)
Plant, machinery
and other office
equipment
R4 553m (61%)
The total capital expenditure on new assets in the retail trade industry in 2009
was R7 544 million. The largest category of capital expenditure was ‘plant,
machinery and other office equipment’ (R4 553 million or 61%), followed by
‘vehicles’ (R1 072 million or 14%) and ‘land, buildings and construction’ (R787
million or 10%) (Figure 5 and Table 8, page 15).
Food, beverages
and tobacco in
specialised stores
54 789 (9%)
Textiles, clothing,
footwear and leather
goods
130 781 (22%)
Household furniture,
appliances, articles
and equipment
61 752 (10%)
The total number of persons employed in the retail trade industry at the end of
June 2009 was 597 370. ‘Non-specialised stores with food, beverages and
tobacco predominating’ had the largest number of employees (142 560 or 24%),
followed by ‘textiles, clothing, footwear and leather goods’ (130 781 or 22%) and
‘household furniture, appliances, articles and equipment’ (61 752 or 10%)
(Figure 6 and Tables 9, pages 16).
Retail trade industry, 2009
5
Statistics South Africa
Figure 7 – Employment by enterprise size in the retail trade industry,
2009
P6201
Figure 8 – Gender ratios in the retail trade industry, 2009
Non-specialised stores with food, beverages and tobacco predominating
Medium enterprises
61 770 (10%)
Other non-specialised stores
Food, beverages and tobacco in specialised stores
Micro enterprises
72 448 (12%)
Pharmaceutical and medical goods, cosmetic and toilet articles
Textiles, clothing, footwear and leather goods
Household furniture, appliances, articles and equipment
.
Small enterprises
90 458 (15%)
Large enterprises
372 694 (63%)
Hardware, paints and glass
Other specialised stores
Second-hand goods in stores
Other retail sale not in stores
Repair of personal and household goods
Total
0%
20%
Female employees
Employment by enterprise size indicates that the large enterprises (those with
turnover equal to or greater than R39 million) had the highest number of
employees (372 694 or 63%), followed by small enterprises (90 458 or 15%),
micro enterprises (72 448 or 12%) and medium enterprises (61 770 or 10%)
(Figure 7 and Table 10, page 17).
40%
60%
80%
100%
Male employees
The proportion of females out of the total persons employed was 53% and that of
males was 47%. The industry with the highest proportion of females employed
was ‘pharmaceutical and medical goods, cosmetic and toilet articles’ (65%),
whilst ‘repair of personal and household goods’ had the highest proportion of
males employed (68%) (Figure 8 and Table 9, page 16).
PJ Lehohla
Statistician-General
Retail trade industry, 2009
6
Statistics South Africa
P6201
2. Tables
Table 1 – Principal statistics in the retail trade industry, 2009
Total
income
Total
expenditure
Total value
of opening
inventories
Total value
of closing
inventories
Type of retail trade
Net
profit or
loss
before
tax
Capital
expenditure
on new
assets
Carrying
value of
assets
at the
beginning
of
the
financial
year
Carrying
value of
assets
at the end
of the
financial
year
R million
Non-specialised stores with food, beverages and
tobacco predominating
Profit
margin
%
153 368
151 026
9 907
11 697
4 132
2 807
9 249
10 715
1,9
43 943
42 385
5 053
5 221
1 725
308
2 742
2 998
2,7
44 912
44 465
2 613
2 480
314
568
2 633
2 803
0,4
22 545
22 128
1 804
2 197
810
120
3 140
3 231
2,6
Textiles, clothing, footwear and leather goods
97 984
86 563
12 378
13 721
12 765
1 435
31 389
30 287
10,8
Household furniture, appliances, articles and
equipment
36 613
35 485
4 350
4 790
1 567
487
1 777
2 020
2,8
Hardware, paints and glass
32 842
31 411
3 906
4 101
1 626
729
3 004
3 357
4,0
Other specialised stores
29 269
28 495
5 113
5 934
1 595
474
2 629
2 710
3,9
Second-hand goods in stores
2 692
2 593
263
268
103
28
121
121
3,2
Other retail sale not in stores
20 255
20 170
1 768
2 158
475
566
1 431
1 661
1,7
2 514
2 411
175
185
113
22
274
282
3,8
486 937
467 132
47 330
52 752
25 225
7 544
58 389
60 185
3,9
Other non-specialised stores
Food, beverages and tobacco in specialised
stores
Pharmaceutical and medical goods, cosmetic
and toilet articles
Repair of personal and household goods
Total
Retail trade industry, 2009
7
Statistics South Africa
P6201
Table 2 – Income in the retail trade industry, 2009
Sales
Services
Interest
Dividends
Profit on
revaluation
of assets
Royalties
Type of retail trade
Profit
on
foreign
loans
Other
income
Total
income
R million
Non-specialised stores with food, beverages and
tobacco predominating
150 552
215
274
110
57
48
0
2 112
153 368
Other non-specialised stores
43 039
79
320
46
4
4
0
451
43 943
Food, beverages and tobacco in specialised stores
43 798
582
171
13
13
2
0
333
44 912
Pharmaceutical and medical goods, cosmetic and
toilet articles
22 102
34
80
9
6
0
0
314
22 545
Textiles, clothing, footwear and leather goods
92 280
659
3 208
1 340
153
32
0
312
97 984
Household furniture, appliances, articles and
equipment
28 632
4 756
1 866
153
338
6
20
842
36 613
Hardware, paints and glass
32 239
21
153
39
21
77
6
286
32 842
Other specialised stores
28 574
355
153
17
26
15
6
123
29 269
Second-hand goods in stores
2 644
0
23
0
4
0
0
21
2 692
Other retail sale not in stores
19 608
46
479
1
43
0
1
77
20 255
1 894
570
33
0
4
0
0
13
2 514
465 362
7 317
6 760
1 728
669
184
33
4 884
486 937
Repair of personal and household goods
Total
Retail trade industry, 2009
8
Statistics South Africa
P6201
Table 3 – Income by enterprise size in the retail trade industry, 2009
Large
enterprises
Medium
enterprises
Small
enterprises
Micro
enterprises
Total of all
enterprises
Type of retail trade
R million
Non-specialised stores with food, beverages and
tobacco predominating
136 608
9 518
4 728
2 514
153 368
Other non-specialised stores
32 427
3 191
3 707
4 618
43 943
Food, beverages and tobacco in specialised stores
18 433
6 743
13 970
5 766
44 912
Pharmaceutical and medical goods, cosmetic and toilet
articles
12 127
2 381
6 156
1 881
22 545
Textiles, clothing, footwear and leather goods
88 273
1 822
3 483
4 406
97 984
Household furniture, appliances, articles and
equipment
28 579
1 746
3 485
2 803
36 613
Hardware, paints and glass
19 080
4 044
5 936
3 782
32 842
Other specialised stores
16 876
3 640
5 812
2 941
29 269
Second-hand goods in stores
1 345
162
479
706
2 692
Other retail sale not in stores
6 178
1 831
6 108
6 138
20 255
311
388
1 136
679
2 514
360 237
35 466
55 000
36 234
486 937
Repair of personal and household goods
Total
Retail trade industry, 2009
9
Statistics South Africa
P6201
Table 4 – Expenditure in the retail trade industry, 2009
Purchases
Salaries
and
wages
Rental
of land
Depreciation
Advertising
Losses
on
assets
Motor
vehicle
running
expenditure
Type of retail trade
R million
Non-specialised stores with food, beverages
and tobacco predominating
123 868
12 140
3 111
1 720
223
102
323
Other non-specialised stores
34 041
3 632
1 301
477
78
106
115
Food, beverages and tobacco in specialised
stores
37 585
2 528
1 005
541
162
31
270
Pharmaceutical and medical goods,
cosmetic and toilet articles
16 979
2 592
631
123
55
10
61
Textiles, clothing, footwear and leather
goods
57 554
11 283
4 873
1 996
759
1 203
234
Household furniture, appliances, articles and
equipment
18 791
5 566
1 770
374
1 032
1 427
559
Hardware, paints and glass
24 309
2 743
564
359
193
82
344
Other specialised stores
19 843
3 401
1 222
360
340
23
182
Second-hand goods in stores
2 048
200
83
28
17
2
18
Other retail sale not in stores
14 559
1 959
644
348
137
43
206
1 564
413
38
34
13
7
56
351 141
46 457
15 242
6 360
3 009
3 036
2 368
Repair of personal and household goods
Total
Retail trade industry, 2009
10
Statistics South Africa
P6201
Table 4 – Expenditure in the retail trade industry, 2009 (continued)
Bank
charges
Type of retail trade
Containers
and
packaging
materials
Computers
Excise
and
customs
duty
Insurance
Interest
Total
paper,
printing
and
stationery
R million
Non-specialised stores with food, beverages
and tobacco predominating
438
262
58
1
240
482
274
75
106
15
0
56
259
15
202
124
23
16
150
191
35
94
13
34
28
59
46
36
Textiles, clothing, footwear and leather
goods
269
106
118
1 042
561
711
155
Household furniture, appliances, articles and
equipment
207
5
478
45
213
661
108
Hardware, paints and glass
147
3
33
0
117
240
35
Other specialised stores
225
16
49
131
133
246
48
Second-hand goods in stores
12
1
1
2
11
20
6
Other retail sale not in stores
130
15
26
41
90
176
41
17
0
4
0
24
14
5
1 816
651
839
1 306
1 654
3 046
758
Other non-specialised stores
Food, beverages and tobacco in specialised
stores
Pharmaceutical and medical goods,
cosmetic and toilet articles
Repair of personal and household goods
Total
Retail trade industry, 2009
11
Statistics South Africa
P6201
Table 4 – Expenditure in the retail trade industry, 2009 (concluded)
Type of retail trade
Railage
and
transportout
Operational
leasing
and hiring
of plant,
machinery
equipment
Repair and
maintenance
Security
services
(including
IT
security
services)
Telecommunication
services
Water
and
electricity
Other
expenditure
Total
expenditure
R million
Non-specialised stores with
food, beverages and
tobacco predominating
Other non-specialised
stores
Food, beverages and
tobacco in specialised
stores
Pharmaceutical and medical
goods, cosmetic and toilet
articles
Textiles, clothing, footwear
and leather goods
Household furniture,
appliances, articles and
equipment
Hardware, paints and glass
Other specialised stores
Second-hand goods in
stores
Other retail sale not in
stores
Repair of personal and
household goods
Total
48
709
981
685
305
1 094
3 962
151 026
34
148
86
25
56
88
1 672
42 385
40
159
213
111
96
296
687
44 465
30
33
41
33
72
35
1 123
22 128
412
651
265
193
301
257
3 620
86 563
117
296
212
142
388
198
2 896
35 485
421
383
88
48
103
56
1 143
31 411
71
359
60
63
155
60
1 508
28 495
4
16
10
3
16
7
88
2 593
87
50
98
24
123
88
1 285
20 170
4
8
15
4
32
18
141
2 411
1 268
2 812
2 069
1 331
1 647
2 197
18 125
467 132
Retail trade industry, 2009
12
Statistics South Africa
P6201
Table 5 – Carrying value of assets at the end of financial year in the retail trade industry, 2009
Type of retail trade
Land, buildings
and
construction
Motor
vehicles
Computers
and
other IT
equipment
Plant,
machinery and
equipment
Intangible
assets
Other
assets
Total
carrying
value
R million
Non-specialised stores with food, beverages and
tobacco predominating
2 781
139
353
5 786
1 016
640
10 715
Other non-specialised stores
765
140
244
1 235
447
167
2 998
Food, beverages and tobacco in specialised
stores
629
73
536
1 071
387
107
2 803
Pharmaceutical and medical goods, cosmetic
and toilet articles
60
40
91
292
2 660
88
3 231
Textiles, clothing, footwear and leather goods
3 752
610
357
3 685
10 990
10 893
30 287
838
55
313
417
342
55
2 020
1 353
50
530
664
702
58
3 357
184
70
222
702
1 479
53
2 710
Second-hand goods in stores
15
3
55
28
12
8
121
Other retail sale not in stores
327
29
602
419
199
85
1 661
Repair of personal and household goods
129
6
101
30
13
3
282
10 833
1 215
3 404
14 329
18 247
12 157
60 185
Household furniture, appliances, articles and
equipment
Hardware, paints and glass
Other specialised stores
Total
Retail trade industry, 2009
13
Statistics South Africa
P6201
Table 6 – Details of assets in the retail trade industry, 2009
Current assets
Bank
Debtors
Inventory
Type of retail trade
Non-current assets
Other
current
assets
Total
current
assets
Fixed
non-current
assets
Goodwill
Long-term
investment
Other
non-current
assets
Total
non-current
assets
Total
assets
R million
Non-specialised stores
with food, beverages and
tobacco predominating
Other non-specialised
stores
Food, beverages and
tobacco in specialised
stores
Pharmaceutical and
medical goods, cosmetic
and toilet articles
Textiles, clothing, footwear
and leather goods
Household furniture,
appliances, articles and
equipment
Hardware, paints and
glass
Other specialised stores
Second-hand goods in
stores
Other retail sale not in
stores
Repair of personal and
household goods
Total
3 244
2 758
11 697
891
18 590
9 497
1 185
3 276
4 151
18 109
36 699
1 153
1 221
5 221
4 065
11 660
2 647
351
7 319
529
10 846
22 506
650
1 109
2 480
340
4 579
2 435
322
263
561
3 581
8 160
921
640
2 197
216
3 974
1 284
1 903
378
1 906
5 471
9 445
6 280
14 450
13 721
2 832
37 283
19 443
10 844
4 660
3 023
37 970
75 253
1 402
12 065
4 790
1 727
19 984
1 674
324
2 306
1 057
5 361
25 345
1 939
2 006
4 101
176
8 222
2 611
660
199
776
4 246
12 468
1 811
1 755
5 934
1 048
10 548
1 695
932
330
346
3 303
13 851
57
120
268
22
467
112
9
14
126
261
728
638
2 108
2 158
100
5 004
1 471
195
105
326
2 097
7 101
74
328
185
45
632
268
14
80
20
382
1 014
18 169
38 560
52 752
11 462
120 943
43 137
16 739
18 930
12 821
91 627
212 570
Retail trade industry, 2009
14
Statistics South Africa
P6201
Table 7 – Detail of liabilities and equity in the retail trade industry, 2009
Current liabilities
Creditors
Overdraft
Type of retail trade
Non-current liabilities
Other
current
liabilities
Total
current
liabilities
Long-term
loan
Other
non-current
liabilities
Total
non-current
liabilities
Total
liabilities
Owners'
equity
Equity and
liabilities
R million
Non-specialised stores
with food, beverages and
tobacco predominating
Other non-specialised
stores
Food, beverages and
tobacco in specialised
stores
Pharmaceutical and
medical goods, cosmetic
and toilet articles
Textiles, clothing,
footwear and leather
goods
Household furniture,
appliances, articles and
equipment
Hardware, paints and
glass
Other specialised stores
Second-hand goods in
stores
Other retail sale not in
stores
Repair of personal and
household goods
Total
18 727
556
4 549
23 832
2 185
2 755
4 940
28 772
7 927
36 699
6 863
403
3 566
10 832
4 031
457
4 488
15 320
7 185
22 505
2 660
493
939
4 092
2 038
573
2 611
6 703
1 457
8 160
2 093
151
479
2 723
2 002
725
2 727
5 450
3 995
9 445
21 676
327
3 652
25 655
25 379
6 435
31 814
57 469
17 784
75 253
4 482
1 072
6 054
11 608
3 919
803
4 722
16 330
9 015
25 345
3 916
393
453
4 762
1 673
645
2 318
7 080
5 388
12 468
4 315
513
918
5 746
3 473
598
4 071
9 817
4 034
13 851
145
31
73
249
266
21
287
536
193
729
1 479
187
988
2 654
1 856
981
2 837
5 491
1 610
7 101
242
35
88
365
154
149
303
668
346
1 014
66 598
4 161
21 759
92 518
46 976
14 142
61 118
153 636
58 934
212 570
Retail trade industry, 2009
15
Statistics South Africa
P6201
Table 8 – Capital expenditure on new assets in the retail trade industry, 2009
Type of retail trade
Land,
buildings and
construction
Computer
equipment
and
software
Vehicles
Plant,
machinery
and other
office
equipment
Other capital
expenditure
Total capital
expenditure
on new assets
R million
Non-specialised stores with
food, beverages and
tobacco predominating
225
51
90
2 367
74
2 807
Other non-specialised stores
199
6
34
56
13
308
76
35
96
319
42
568
7
11
28
42
32
120
46
224
87
943
135
1 435
105
46
108
219
9
487
Hardware, paints and glass
87
74
207
169
192
729
Other specialised stores
41
83
36
303
11
474
2
17
9
0
28
1
17
357
117
74
566
0
1
12
9
0
22
787
550
1 072
4 553
582
7 544
Food, beverages and
tobacco in specialised
stores
Pharmaceutical and medical
goods, cosmetic and toilet
articles
Textiles, clothing, footwear
and leather goods
Household furniture,
appliances, articles and
equipment
Second-hand goods in
stores
Other retail sale not in
stores
Repair of personal and
household goods
Total
0
Retail trade industry, 2009
16
Statistics South Africa
P6201
Table 9 – Employment in the retail trade industry, 2009
Permanent employees
Female
Male
Temporary employees
Total
Female
Male
Casual employees
Total
Female
Male
Total employees
Total
Female
Male
Total
employees
Type of retail trade
Number of employees
Non-specialised stores with
food, beverages and tobacco
predominating
64 295
55 996
120 291
6 360
7 871
14 231
4 621
3 417
8 038
75 276
67 284
142 560
Other non-specialised stores
18 754
17 412
36 166
4 627
3 763
8 390
1 133
1 874
3 007
24 514
23 049
47 563
21 833
28 295
50 128
573
715
1 288
1 521
1 852
3 373
23 927
30 862
54 789
17 765
9 326
27 091
915
930
1 845
506
298
804
19 186
10 554
29 740
66 049
40 183
106 232
6 287
3 978
10 265
8 861
5 423
14 284
81 197
49 584
130 781
28 665
30 706
59 371
719
638
1 357
314
710
1 024
29 698
32 054
61 752
Hardware, paints and glass
10 496
21 974
32 470
145
962
1 107
557
1 176
1 733
11 198
24 112
35 310
Other specialised stores
13 506
16 860
30 366
584
278
862
2 864
2 777
5 641
16 954
19 915
36 869
927
1 458
2 385
54
113
167
126
70
196
1 107
1 641
2 748
29 104
17 914
47 018
73
992
1 065
1 227
437
1 664
30 404
19 343
49 747
1 670
3 549
5 219
39
128
167
38
87
125
1 747
3 764
5 511
273 064
243 673
516 737
20 376
20 368
40 744
21 768
18 121
39 889
315 208
282 162
597 370
Food, beverages and
tobacco in specialised
stores
Pharmaceutical and medical
goods, cosmetic and toilet
articles
Textiles, clothing, footwear
and leather goods
Household furniture,
appliances, articles and
equipment
Second-hand goods in
stores
Other retail sale not in stores
Repair of personal and
household goods
Total
Retail trade industry, 2009
17
Statistics South Africa
P6201
Table 10 – Employment by enterprise size in the retail trade industry, 2009
Large
enterprises
Medium
enterprises
Small
enterprises
Micro
enterprises
Total of all
enterprises
Type of retail trade
Number of employees
Non-specialised stores with food,
beverages and tobacco predominating
112 303
11 951
13 684
4 622
142 560
Other non-specialised stores
29 403
2 080
7 925
8 155
47 563
Food, beverages and tobacco in
specialised stores
18 846
7 695
16 501
11 747
54 789
Pharmaceutical and medical goods,
cosmetic and toilet articles
14 858
3 424
8 350
3 108
29 740
113 806
3 605
7 630
5 740
130 781
Household furniture, appliances, articles
and equipment
45 505
2 070
5 170
9 007
61 752
Hardware, paints and glass
15 703
4 800
9 759
5 048
35 310
Other specialised stores
20 666
2 368
8 165
5 670
36 869
Second-hand goods in stores
172
128
757
1 691
2 748
Other retail sale not in stores
1 362
22 955
9 831
15 599
49 747
70
694
2 686
2 061
5 511
372 694
61 770
90 458
72 448
597 370
Textiles, clothing, footwear and leather
goods
Repair of personal and household goods
Total
Retail trade industry, 2009
18
Statistics South Africa
P6201
Explanatory notes
Background
The results presented in this publication have been derived from the 2009 retail trade large sample survey. This is a periodic survey, which measures
economic activity in the retail trade industry of the South African economy. This survey is based on a sample of private and public enterprises operating in the
retail trade industry.
The sample was drawn from Stats SA’s business register. Stats SA continuously upgrades its business register, based on units registered for value added tax
(VAT) and income tax (IT) at the South African Revenue Service (SARS).
All figures exclude value added tax (VAT).
Reference period
The information was collected from enterprises for their financial year, which ended on any date between 1 July 2008 and 30 June 2009.
Purpose of the survey
Results of the survey are used within Stats SA for compiling South Africa’s national accounts, e.g. the gross domestic product (GDP) and gross fixed capital
formation. These statistics are also used by the private sector in analyses of comparative business and industry performance.
Scope and coverage
This survey covers the following income tax-registered private and public enterprises that are mainly engaged in the retail trade industry:
i. Retail sale in non-specialised stores with food, beverages and tobacco predominating (SIC 6211).
ii. Other retail sale in non-specialised stores (SIC 6219).
iii. Retail trade in food, beverages and tobacco in specialised stores (SIC 6220).
iv. Retail sale of pharmaceutical and medical goods, cosmetic and toilet articles (SIC 6231).
v. Retail sale of textiles, clothing, footwear and leather goods (SIC 6232).
vi. Retail trade in household furniture, appliances, articles and equipment (SIC 6233).
vii. Retail sale of hardware, paints and glass (SIC 6234).
viii. Other retail trade in specialised stores (SIC6239).
ix. Retail trade in second-hand goods in stores (SIC 6240).
x. Retail sale via mail-order houses (SIC 6251).
xi. Retail trade via stalls and markets (SIC 6252).
xii. Other retail sale not in stores (SIC 6259).
xiii. Repair of personal and household goods (SIC 6260).
Classification by industry
The 1993 edition of the Standard Industrial Classification of all Economic Activities (SIC), Fifth Edition, Report No. 09-09-02, was used to classify the
statistical units in the survey. The SIC is based on the 1990 International Standard Industrial Classification of all Economic Activities (ISIC) with suitable
adaptations for local conditions. Statistics in this publication are presented at 4-digit SIC level (group). Each enterprise is classified to an industry which
reflects its predominant activity.
Statistical unit
The statistical unit for the collection of the information is an enterprise. An enterprise is a legal unit (or a combination of legal units) that includes and directly
controls all functions necessary to carry out its activities.
Retail trade industry, 2009
19
Statistics South Africa
Size groups
P6201
The enterprises are divided into four size groups according to the value of their business register turnover. Large enterprises are enterprises with an annual
turnover of R39 million and more. Table A presents the size groups defined using the Department of Trade and Industry (DTI) cut-off points.
Table A – Size groups for the retail trade industry
Survey methodology and
design
Size group
Turnover
Large
≥ R39 000 000
Medium
R19 000 000 ≤ VAT turnover < R39 000 000
Small
R4 000 000 ≤ VAT turnover < R19 000 000
Micro
< R4 000 000
The survey was conducted by post, email, fax, telephone and personal visits.
A sample size of 3 009 enterprises was drawn using stratified simple random sampling. The enterprises were first stratified at 4-digit level according to the
SIC and then by size of enterprise. All large enterprises were completely enumerated. Business register turnover was used as the measure of size for
stratification.
Weighting methodology
For those strata not completely enumerated, the weights to produce estimates are the inverse ratio of the sampling fraction, modified to take account of nonresponse in the survey. Stratum estimates were calculated and then aggregated with the completely enumerated stratum to form group estimates. These
procedures, which are in line with international best practice, are described in more detail on the Stats SA website at
www.statssa.gov.za/publications/publicationsearch.asp.
Relative standard error
Data presented in this publication are based on information obtained from a sample and are, therefore, subject to sampling variability; that is, they may differ
from the figures that would have been produced if the data had been obtained from all enterprises in the retail trade industry in South Africa.
One measure of the likely difference is given by the standard error (SE), which indicates the extent to which an estimate might have varied by chance
because only a sample of enterprises was used. The relative standard error (RSE) provides an immediate indication of the percentage errors likely to have
accrued due to sampling.
Retail trade industry, 2009
20
Statistics South Africa
P6201
Table B – Income in the retail trade industry within 95% confidence limit: 2009
Type of retail trade
Lower
limit
Total
income
Upper
limit
R million
Non-specialised stores with food, beverages and
tobacco predominating
Relative
standard
error
%
148 257
153 368
158 478
1,7
Other non-specialised stores
37 483
43 943
50 402
7,5
Food, beverages and tobacco in specialised stores
40 158
44 912
49 665
5,4
Pharmaceutical and medical goods, cosmetic and
toilet articles
20 070
22 545
25 019
5,6
Textiles, clothing, footwear and leather goods
94 143
97 984
101 824
2,0
Household furniture, appliances, articles and
equipment
33 886
36 613
39 339
3,8
Hardware, paints and glass
26 340
32 842
39 343
10,1
Other specialised stores
26 228
29 269
32 309
5,3
Second-hand goods in stores
2 449
2 692
2 934
4,6
Other retail sale not in stores
15 610
20 255
24 899
11,7
2 055
2 514
2 972
9,3
473 575
486 937
500 298
1,4
Repair of personal and household goods
All retail trade industry
Non-sampling errors
Inaccuracies may occur because of imperfections in reporting by enterprises and errors made in the collection and processing of the data. Inaccuracies of this
kind are referred to as non-sampling errors. Every effort is made to minimise non-sampling errors by careful design of questionnaires, testing them in pilot
studies, editing reported data and implementing efficient operating procedures. Non-sampling errors occur in both sample surveys and censuses.
Rounding-off of figures
The figures in the tables have, where necessary, been rounded off to the nearest final digit shown. There may therefore be slight discrepancies between the
sums of the constituent items and the totals shown.
Retail trade industry, 2009
21
Statistics South Africa
Symbols and
abbreviations
DTI
Department of Trade and Industry
GDP
Gross domestic product
ISIC
International Standard Industrial Classification of all Economic Activities
IT
Income tax
RSE
Relative standard error
SARS
South African Revenue Service
SE
Standard error
SIC
Standard Industrial Classification of all Economic Activities
SNA
System of National Accounts
Stats SA
Statistics South Africa
VAT
Value added tax
0
Nil or less than half the final digit shown
P6201
Retail trade industry, 2009
22
Statistics South Africa
P6201
Glossary
Casual employees
Casual employees are employees who fall neither within the ‘permanent employees’ category nor the ‘temporary employees’ category. Such
employees are typically working daily or hourly.
Current assets
Assets on the balance sheet which are expected to be sold or otherwise used up in the near future, usually within one year. They include:
•
•
•
•
Current liabilities
trade and other receivables;
cash and bank;
inventories; and
other current assets.
Current liabilities are debts or obligations that are due within one year. They include:
•
•
•
trade and other payables;
bank overdraft; and
other current liabilities.
Enterprise
The enterprise is a legal entity or a combination of legal units that includes and directly controls all functions necessary to carry out its activities.
Industry
An industry consists of a group of enterprises engaged in the same or similar kinds of economic activity. Industries are defined in the System of
National Accounts (SNA) in the same way as in the Standard Industrial Classification of all Economic Activities, Fifth Edition, Report No. 09-90-02 of
January 1993 (SIC).
Labour brokers
Agents who recruit and administer workers on behalf of the enterprise. They do not provide any other service.
Net profit or loss after tax
Net profit or loss after tax is derived as:
Total income
plus closing value of inventories
minus total expenditure
minus opening value of inventories
minus company tax
Retail trade industry, 2009
23
Statistics South Africa
Net profit or loss before tax
P6201
Net profit or loss before tax is derived as:
Total income
plus closing value of inventories
minus total expenditure
minus opening value of inventories
Non-current assets
Non-current assets are assets which are not easily convertible to cash or not expected to become cash within the next year. They include:
•
•
•
Non-current liabilities
Non-current liabilities are liabilities not due to be paid within one year during the normal course of business. They include:
•
•
Other expenditure
long-term loans; and
other non-current liabilities.
Other expenditure includes:
•
•
•
•
•
•
•
•
Other income
property, plant and equipment and intangible assets;
long-term investments; and
other non-current assets.
containers and packaging materials;
excise and customs duty;
losses on liabilities;
losses on foreign exchange;
prices and payout;
severance, termination and redundancy payments;
skills development levy; and
other.
Other income includes:
•
•
•
•
leasing and hiring of motor vehicles and other transport equipment;
leasing and hiring of plant, machinery, equipment and vehicles;
profit for redemption, liquidation or revaluation of liabilities; and
other.
Owners’ equity
Owners’ equity is the residual interest in the entity’s assets after deducting its liabilities.
Permanent employees
Permanent employees are employees appointed on an open-ended contract with no stipulated termination date or a fixed-term contract for periods
of more than one year
Retail trade industry, 2009
24
Statistics South Africa
Profit margin
P6201
Profit margin is derived as:
Net profit after tax
divided by turnover
multiplied by 100
Statistical unit
A statistical unit is a unit about which statistics are tabulated, compiled or published. The statistical units are derived from and linked to the South
African Revenue Service (SARS) administrative data.
Stratum
A stratum is constructed by concatenating the SIC classification and size group variables.
Temporary employees
Temporary employees are employees appointed on a short-term contract basis with a stipulated termination date for periods not exceeding one year
Turnover
Turnover includes:
•
•
•
•
value of sales of goods;
amount received for services rendered;
rent and lease payments received for land and buildings; and
rent, leasing and hiring received for machinery, vehicles and other equipment.
Retail trade industry, 2009
25
Statistics South Africa
P6201
General information
Stats SA publishes approximately 300 different statistical releases each year. It is not economically viable to produce them in more than one of South Africa's eleven official languages. Since
the releases are used extensively, not only locally but also by international economic and social-scientific communities, Stats SA releases are published in English only.
Stats SA has copyright on this publication. Users may apply the information as they wish, provided that they acknowledge Stats SA as the source of the basic data wherever they process,
apply, utilise, publish or distribute the data; and also that they specify that the relevant application and analysis (where applicable) result from their own processing of the data.
Stats SA products
A complete set of Stats SA publications is available at the Stats SA Library and the following libraries:
National Library of South Africa, Pretoria Division
National Library of South Africa, Cape Town Division
Natal Society Library, Pietermaritzburg
Library of Parliament, Cape Town
Bloemfontein Public Library
Johannesburg Public Library
Eastern Cape Library Services, King William’s Town
Central Regional Library, Polokwane
Central Reference Library, Nelspruit
Central Reference Collection, Kimberley
Central Reference Library, Mmabatho
Stats SA also provides a subscription service.
Electronic services
A large range of data is available via on-line services, diskette and computer printouts.
For more details about our electronic data services, contact (012) 310 8600/ 8390/ 8351/ 4892/ 8496/ 8095.
You can visit us on the Internet at: www.statssa.gov.za
Enquiries
Telephone number:
(012) 310 8600/ 8390/ 8351/ 4892/ 8496/ 8095 (user information services)
(012) 310 8234/ 310 8191 (technical enquiries)
(012) 310 8358 (orders)
(012) 310 8490 (library)
Fax number:
(012) 310 8623 (technical enquiries)
Email address:
[email protected] (technical enquiries)
[email protected] (technical enquiries)
[email protected] (user information services)
[email protected] (orders)
Postal address:
Private Bag X44, Pretoria, 0001
Produced by Stats SA
Retail trade industry, 2009
© Copyright 2026 Paperzz