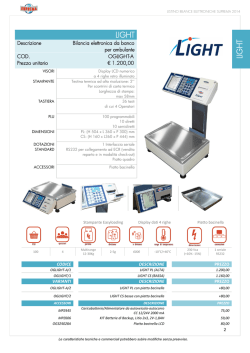
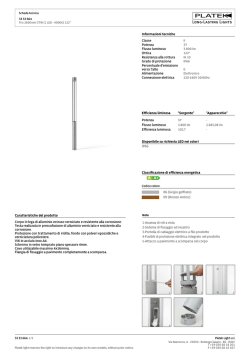
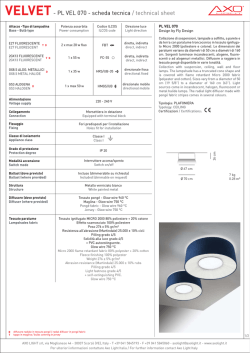
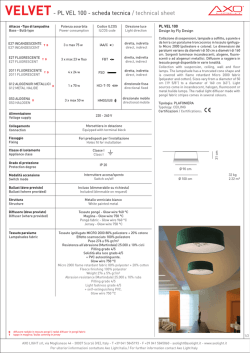
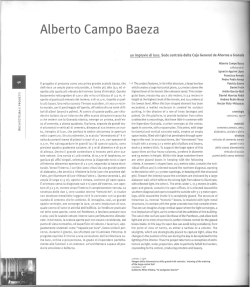
EPJ Web of Conferences 89, 03003 (2015)
DOI: 10.1051/epjconf/20158903003
c Owned by the authors, published by EDP Sciences, 2015
EUSO@TurLab: An experimental replica of ISS orbits
M. Bertaina1,2,a , A. Bowaire1,3 , S. Cambursano1 , R. Caruso4,5 , G. Contino4,5,b , G. Cotto1,2 , F. Crivello1 , R. Forza1,2 ,
N. Guardone4,5 , M. Manfrin1,2 , M. Mignone2 , R. Mulas1,2 , G. Suino1,2 , and P.S. Tibaldi1 for JEM-EUSO Collaboration
1
Dipartimento di Fisica, Università degli Studi di Torino, Italy
Istituto Nazionale di Fisica Nucleare – Sezione di Torino, Italy
3
Université de Nice Sophia Antipolis, France
4
Dipartimento di Fisica, Università degli Studi di Catania, Italy
5
Istituto Nazionale di Fisica Nucleare – Sezione di Catania, Italy
2
Abstract. The EUSO@TurLab project is an on-going activity aimed to reproduce atmospheric and luminous conditions that
JEM-EUSO will encounter on its orbits around the Earth. The use of the TurLab facility, part of the Department of Physics of
the University of Torino, allows the simulation of different surface conditions in a very dark and rotating environment in order to
test the response of JEM-EUSO’s sensors and sensitivity. The experimental setup currently in operation has been used to check
the potential of the TurLab facility for the above purposes, and the acquired data will be used to test the concept of JEM-EUSO’s
trigger system.
1. Introduction
In this work, we introduce the TurLab [1] laboratory
(defined TurLab in the following) as a facility in
preparatory steps of the JEM-EUSO project [2]. The
aim of JEM-EUSO is the detection of fluorescence and
Cherenkov light produced by Extensive Air Showers
(EAS) generated by Extreme Energy Cosmic Rays
(EECRs, energy E > 5 × 10¹⁹ eV) impinging the Earth’s
atmosphere.
The Atmosphere works as a detector for EECRs
and, at the same time, is the main source of JEMEUSO’s noise, namely the UV background. Possible
atmospheric conditions creating fluctuations in the
background luminosity are: a) variations of night glow
due to natural, slowly varying sources whose light
is being reflected through Earth albedo (e.g. Moon
in different phases, diffuse star light, airglow); b)
artificial sources, e.g. city lights; c) Transient Luminous
Events (TLE) in the lower and upper Atmosphere (e.g.
Lightnings, Elves and Sprites); d) luminous phenomena,
much slower than the speed of light, like meteors.
Recognising the highly-variable luminous conditions of
the Atmosphere is the main task of the trigger system,
and simulations of different background conditions have
been made to implement and improve the trigger logic
[see Sect. 2]. The use of TurLab gives the opportunity of
reproducing experimentally variable luminosity conditions
and different possible light sources, recreating orbit sights
and events on the JEM-EUSO scale. TurLab represents
an ideal condition for testing JEM-EUSO Focal Surface
(FS) elements, electronics and trigger system at real work
conditions.
The paper is organised as follows: in Sect. 2 we
present computer simulations; TurLab is described in
a
b
e-mail: [email protected]
e-mail: [email protected]
Sect. 3, while Sect. 4 gives a list of different possible
configurations presently tested; the actual set up is
described in Sect. 5 and obtained results are summarised
in Sect. 6. It will be shown that with TurLab we can
reproduce experimentally light patterns which have the
characteristics of those simulated, but with the advantage
of taking into account several effects (noise, fluctuations,
etc.) which are difficult to model in an appropriate way in
simulations.
2. Simulations
A preliminary and parallel work to reproduce the
variations of UV background was performed with
computer simulations. Starting from known data of the
lowest light emission from Earth in UV range [3]
(measured at night, in the middle of the ocean,
without Moon), and using data from DMSP (Defense
Meteorological Satellite Program) [4], we evaluated
the light intensity which is going to be seen by
JEM-EUSO due to artificial sources compared to the
expected nightglow background. More details are reported
in [5]. Knowing that the standard nightglow background
condition on oceans is 500 ph/(m2 ·ns·sr), and that it results
in 1.0 – 1.4 phe/pix/GTU1 depending on the pixel’s
location on the Focal Surface of JEM-EUSO, we produced
simulations of counts due to possible different scenarios.
Figure 1 shows the results of two simulations
recreating the expected counts: a) & b) crossing Central
Italy, with a series of urban areas, of different extension,
alternated with dark rural areas and the sea; c) & d) during
a passage over one of the Aeolian islands, i.e., an insulated
and very localised light source. The result is comparable to
real measurements obtained with the BABY balloon [6],
in which the luminosity level increases by 1–2 orders of
1
phe/pix/GTU is photoelectrons per pixel per Gate Time Unit
(GTU) of JEM-EUSO, see Sect. 5.
This is an Open Access article distributed under the terms of the Creative Commons Attribution License 4.0, which permits unrestricted use, distribution,
and reproduction in any medium, provided the original work is properly cited.
Article available at http://www.epj-conferences.org or http://dx.doi.org/10.1051/epjconf/20158903003
EPJ Web of Conferences
/GTU
duration [s]
/GTU
duration [s]
Figure 1. Simulations: the pictures on the left represent DMSP original data of the geographical areas considered in the simulation.
The plots on the right show the expected counts (light profile, expressed in Nphe /pix/GTU) for JEM-EUSO as a function of both spatial
extension and temporal duration, in the direction of the arrow in a) and across the circle in c).
Figure 2. Simulation of a light profile of a meteor of magnitude
M = 2 seen by JEM-EUSO [7]. The vertical axis shows the
detected counts per GTU on the full instrument.
Figure 3. Light profile of a 2 · 1020 eV proton EAS with zenith
angle 60◦ simulated with the ESAF code [9]. The vertical
axis indicates the detected photon-counts per GTU on the full
instrument.
software named Euso Simulation and Analysis Framework
(ESAF) [8].
magnitude. The saturation in luminosity visible on the
urban areas is an effect present in DMSP data.
Simulations were conducted in the past to recreate
light profiles of other types of physical phenomena that
will occur in the Atmosphere, namely meteors and EAS.
Figure 2 shows the typical light profile expected at JEMEUSO by a meteor of magnitude M = 2 obtained by a
dedicated simulation code [7]. Figure 3 shows the typical
light profile of a 2 · 1020 eV EAS detected by JEM-EUSO.
EASs are simulated in JEM-EUSO using a dedicated
3. The TurLab facility
TurLab is a laboratory, equipped with a 5 m diameter
rotating tank, located at the Department of Physics of
the University of Torino (see Fig. 4). The system has
been thought mainly for studying fluid-dynamics problems
where system rotation plays a key role in the fluid
behaviour, as happens in atmospheric and oceanic flows
03003-p.2
AtmoHEAD 2014
Table 1. Range of the tank speed. For the TurLab/ISS ratio, the ISS speed is assumed to be ∼8 km/s.
Rotation Speed
Minimum speed:
Intermediate speed:
Maximum speed:
1 rotation in 20 minutes
1 rotation in 2 minutes
1 rotation in 12 seconds
Figure 4. The TurLab rotating tank. The black tube on the ceiling
shows the collimator of the experimental setup used to mimic the
JEM-EUSO telescope. The floating cables at its left are used to
transfer the PMT signals to the electronics setup 25 m away from
the tank.
at different scales. The tank can be filled up to 70 cm of
water (both fresh or salty) and can rotate with periods that
span from about few seconds to several minutes. For fluiddynamics experiments, the facility is equipped with many
cameras and advanced systems for digital recording and
data processing.
TurLab is located 15 m underground. So it is possible
to work in extremely dark conditions and hence the room
light can be totally controlled by researchers.
The tank is used to study different phenomena. A few
examples are: a) it can be filled with fluids of different
density to study fluid behaviour in stratified conditions
both with or without rotation; b) convection can be
generated and studied with different approaches; c) two
fans can create an air flow, between about 1 m/s and 7 m/s,
inducing waves on fluid surface and allowing the study
of the air-water interaction or/and creating conditions of
infinite fetch that can be deeply analysed with fluiddynamics techniques or with two waves probes; d) the
possibility of recreating different surface roughness can
allow studies of fluid turbulent properties in the boundary
layer; e) the facility can be used as a model of the
rotating Earth system to simulate parts of terrestrial surface
reproducing different environments (snow, grass, ocean,
land as well as fog and clouds) and their albedo.
4. Experimental replica
The leading idea of the EUSO@TurLab project is
reproducing the variations of luminosity and possible
luminous events that JEM-EUSO will encounter during
its mission. To realize an emulation of the orbits
of the International Space Station (ISS) we use the
rotating tank of TurLab with a series of different
Speed at 2 m radius
m/s
10−2
10−1
1
TurLab/ISS ratio
10−6
10−5
10−4
Figure 5. The Arduino platform is shown in a). Pictures of the
electronic circuits employed so far to mimic EASs (b) and elves
(c) are displayed as well.
configurations to recreate the Earth views, and a MultiAnode Photomultiplier (MAPMT) hung from the ceiling
above the tank pointing towards nadir to mimic JEMEUSO telescope.
The possibility of changing the tank rotation speed
allows reproducing events of different temporal durations
with the same configuration, representing scenarios of
different spatial extensions as seen from the ISS rotating
around the Earth. In Table 1, three configurations that were
tested are shown with the corresponding speed of an object
placed on the tank at a radius of 2 m, approximately the
position of the MAPMT; this speed is then compared with
the ISS speed in the third column.
Most relevant possibility at TurLab is changing the
light conditions and light sources. The later can be
distinguished between:
• direct light emitting sources;
• materials reflecting room light.
As direct light emitting sources, a variety of materials
is used, with the intent of reproducing different kinds of
phenomena:
• Urban areas are reproduced by means of LEDs in the
visible range inside tubes of different dimension, so
to have extended and intense lights directly pointing
to the MAPMT.
• an oscilloscope producing Lissajous curves, for
events such as meteors;
• LEDs driven by a pulse generator, for fast luminous
events such as lightnings;
• LEDs peaked at ∼350 nm or optical fibers driven by
Arduino platform [10].
The Arduino platform (Fig. 5a) is used to control light
sources with timing too extreme for the tank dynamic
range or to recreate complicated luminous phenomena
(such as Elves, Sprites, etc.). For our purposes, the main
03003-p.3
EPJ Web of Conferences
Figure 6. Layout of the electronics circuit currently employed to
test the response of the PMT to the light scenes reproduced in the
tank.
characteristic of Arduino is the possibility of a fast control
of LEDs with a minimum timing of 2 µs. Till now we
have recreated EECRs with a strip of 10 LEDs (Fig. 5c),
and Elves with optical fibres arranged in a quarter circle
and illuminated by LEDs (Fig. 5b). For the EECRs, we
reproduce the variations of light intensity during the EAS
development by varying the intensity of each LED using
variable impedances.
Besides direct light sources we can use materials over
the tank surface to obtain a replica of Earth albedo. We
can change the illumination in the tank room so to have
different responses using the same material. Presently, our
room light sources are: a computer screen beside the tank
and a remote controlled LED over the tank. Examples of
used materials are: moss to mimic “green” regions such
as forests, glass dust for highly-reflectant surfaces such as
glaciers or snow, sand and bricks for land soils. Finally, it
is possible to use two fans to create waves when the tank
is filled with water, and white particles suspended in salty
water to mimic clouds and fog.
5. The current setup
At present EUSO@TurLab apparatus consists of:
• a 5 × 5 pixel MAPMT: Hamamatsu R8900-M25 [11],
hung from the ceiling and pointing towards nadir
covered by a BG3 filter to select the light in the
300–400 nm band such as in JEM-EUSO;
• a 1 diameter focusing lens in front of the MAPMT;
• 25 cables, 25 m long, connecting the MAPMT with
electronics;
• standard NIM and CAMAC electronics (see Fig. 6);
• a PC for acquiring measurements with LabView
software.
The electronic system, currently employed in the
measurement, is different from the JEM-EUSO one,
however, it is based on the same detection principle
of the single photon-counting. Therefore, it can give a
fair representation of the potentiality of EUSO@TurLab
to mimic the experimental situations that JEM-EUSO
is expected to encounter, and test, at a first level
approximation, the trigger system of JEM-EUSO. By
demonstrating this concept, in future it could host the
prototypes of JEM-EUSO under development, to test their
responses in a controlled environment.
The MAPMT, equipped with the lens, has a Field of
View (FoV) equivalent approximately to its physical size,
which is a squared inch, i.e., each pixel sees (5 × 5) mm2
at a 2 m distance. The solid angle is then of the order of
10−6 , the same magnitude of the FoV of one pixel in JEMEUSO. By comparing the linear extension of TurLab’s
and JEM-EUSO’s pixel FoV, it turns out that the ratio
TurLab/JEM-EUSO is (5 mm / 600 m) ∼ 10−5 , which has
the same magnitude of the ratio of speeds (see Table 1).
This means that in such a configuration it will be possible
to reproduce the evolution of the light source entering and
disappearing from the FoV of a pixel in very similar way
as seen from the ISS. On the other hand, if the tank rotates
at minimum speed, each rotation could mimic half of JEMEUSO orbit, testing many light situations inside the same
rotation. The two approaches complement themselves.
To measure luminosity the photon counting mode is
used. The 25 signals from the MAPMT are amplified,
discriminated and counted with NIM electronics, as shown
schematically in Fig. 6. At the moment we cannot
reproduce JEM-EUSO time scale, with a GTU of 2.5 µs
and a 25 ns double-pulse resolution. Therefore, we use
400 ns double-pulse resolution and a 40 µs GTU. In
this way we keep the same saturation characteristics
in photon-counting as in JEM-EUSO. A very unwanted
feature of the present electronics configuration is the delay
in PC acquisition: we have 30 ms dead time for each
measurement. Hence, for EUSO@TurLab, 1 GTU consists
of 40 µs sampled every 30 ms. However, if the data are
processed offline, this is not a major issue at this stage.
6. Results
Some of the configurations applied so far at TurLab are
discussed in the following. The plots refer to the integral
of the counts from all MAPMT pixels (left scale on the
vertical axis) as a function of time as well as the average
count/pixel (right scale on the vertical axis).
Time is expressed in GTU or seconds. We use seconds
when we want to represent the real duration of recreated
events; otherwise, using GTU, we consider the event as
consecutive snapshots of JEM-EUSO GTUs. In this way,
the 30 ms dead time between frames is not taken into
account. Results obtained at TurLab are being used to test
the JEM-EUSO trigger logic.
Figure 7 and Fig. 8 show the MAPMT counts during
a complete 10 minute rotation of the tank. Different
configurations are reproduced. In Fig. 7, the room light is
the same for the two curves, with the LED over the tank
ON. The green curve refers to the tank without any source
on it, while the blue one represents the tank covered with
a collection of different materials and direct light sources
that were described in Sect. 4.
In Fig. 8, the two curves refer to different room light
conditions with the tank covered with all the sources
shown in Fig. 7. The LED over the tank is ON or OFF in
blue or green curve, respectively. As predictable, the light
03003-p.4
AtmoHEAD 2014
700
28
600
24
24
500
20
20
400
16
300
12
200
8
100
4
400
16
(e)
(f)
300
12
200
8
(g)
(d)
(a)
100
0
150
200
Nphe /pix/GTU
(c)
4
250
300
350
t [s]
400
450
500
550
0
0
20
30
40
50
60
t [s]
70
80
90
100
0
Figure 9. Simulation of a passage through two large urban areas
of ∼50–60 km if rescaled to ISS speed.
phe/GTU
Figure 7. A 10 minutes rotation of the tank equipped without
(green) and with (blue) different sources: a) moss; b) Arduino
10 LED strip; c) mirror; d) bricks; e) glass dust; f) sand;
g) oscilloscope. See text for details.
10
600
24
500
20
400
16
300
12
200
8
100
4
0
10
20
30
t [s]
40
50
Nphe/pix
/GTU
phe
phe /GTU
500
phe /GTU
600
/GTU
Nphe/pix
phe
(b)
0
60
emitting sources results are not affected, while there is a
fundamental change in the response of different materials.
The inset in Fig. 8 is a zoom showing the minimum
level of luminosity obtainable at TurLab. We have
an average of 0.3 phe/pix/GTU, that is lower than
1.4 phe/pix/GTU expected for JEM-EUSO.
Comparing the different results in Fig. 7 and Fig. 8,
one can see how the tank itself represents a source of light
when it is sufficiently illuminated by room light, due to
structures that are part of the tank: there are metal bars,
a footbridge, and a wooden structure created for other
experiments. All of these structures can be covered/painted
with black to reduce their effect on luminosity. Some
of them can be removed if necessary to reach a more
uniform response. On the other hand they constitute natural
inhomogeneities useful to test the capability of the system
to adjust the thresholds for trigger purposes.
In the following, examples of isolated events recreated
at TurLab are presented. For all the results the light
intensity can be changed simply by changing LED power.
Figure 9 shows the results obtained by using two LEDs
illuminating the ceiling by means of small pinholes of
different dimensions; for this and next two examples, the
rotation speed is approximately 1 turn every 2 minutes.
The result is comparable to a passage over two isolated
metropolitan areas (see Fig. 1). The durations in time
phe /GTU
Figure 8. Response to different light conditions. The inset is a
zoom on the 170 – 270 s region. See text for details.
90
3.6
80
3.2
70
2.8
60
2.4
50
2
40
1.6
30
1.2
20
0.8
10
0.4
0
50
100
t [s]
150
200
/GTU
Nphe/pix
phe
Figure 10. Extended luminous area of 300–400 km if rescaled to
ISS speed.
0
Figure 11. Reflected light using wooden panels. The luminosity
variation is as expected from clouds.
are approximately of 7.5 s and 9 s, and the equivalent
extensions, considering for ISS a 7(8) km/s speed, is
55(68) km, respectively. In Fig. 10, the LED has a
much wider opening angle and produces a much more
extended light source, representing a wider region of
300–400 km, such as the North Plane in Italy, center of
Europe or US coastal areas.
Figure 11 shows the signal produced by light reflected
by wooden panels. The variations in the light intensity are
comparable with expectations from clouds.
Figure 12 shows a replica of an EECR event by means
of Arduino platform. We use a strip of ten LEDs, each
connected to an Arduino pin output, illuminated with a
03003-p.5
EPJ Web of Conferences
/GTU
Figure 13 shows the reproduction of a lightning area
by means of a blinking led. Presently the light is controlled
to avoid too intense pulses, however, the intensity can be
increased. Taking into account the speed of the tank and
the total duration of about 1 minute it would correspond
for the ISS to a 400 km area.
7. Conclusions
1200
48
1000
40
800
32
600
24
400
16
200
8
0
10
20
30
t [s]
40
50
Nphe/pix
/GTU
phe
phe/GTU
Figure 12. A replication with the Arduino platform of the signal
expected in JEM-EUSO by a 2 × 10²⁰ eV EECR. Top panel
shows the light profile in 128 GTUs with the light eccess due to
the fired LEDs. Bottom panel shows the snapshot of 3 different
GTUs during the event occurrence.
The measurements presented in this paper represent the
first successful steps of an on-going project aiming at using
TurLab as a facility to mimic experimentally transient
lights that JEM-EUSO is expected to see during its orbits
flying on the ISS. We plan to improve further our setup
in order to reach a more realistic representation of the
JEM-EUSO system and of the physical processes it will
monitor. TurLab could be used in future to test prototypes
and precursors of JEM-EUSO. The data taken so far will
be used to validate the logic of the 1st level of its trigger
system.
This work was partially supported by the Italian Ministry of
Foreign Affairs, General Direction for the Cultural Promotion
and Cooperation.
References
0
60
Figure 13. Reproduction of a lightning area.
60 ms period and 1 Hz repetition rate. Actual timing was
created considering the 30 ms dead time of electronics
configuration. It is possible to reach values between
2.5 µs and 25 µs when using JEM-EUSO electronics.
The intensity of the light profile and the event duration
is comparable to what is expected according to ESAF
simulation (Fig. 3) for a 2 × 10²⁰ eV EECR with 60◦ zenith
angle.
[1] http://www.turlab.ph.unito.it
[2] T. Ebisuzaki et al, Adv. Sp. Res. 53, 1499–1505
(2014)
[3] G.K. Garipov et al, Astrop. Phys. 24, 400–408
(2005)
[4] http://www.ngd.noaa.gov/dmsp
[5] J.H. Adams Jr. et al, Astrop. Phys. 44, 76–90 (2013)
[6] O. Catalano et al, NIM A 480, 547–554 (2002)
[7] M. Bertaina et al, Exp. Astronomy
DOI: 10.1007/s10686-014-9375-4, (2014)
[8] C. Berat et al, Astrop. Phys. 33, 221–247 (2010)
[9] M. Bertaina et al, Adv. Sp. Res. 53, 1515–1535
(2014)
[10] http://www.arduino.cc
[11] Y. Kawasaki et al, NIM A 564, 378–394 (2006)
03003-p.6
© Copyright 2026 Paperzz