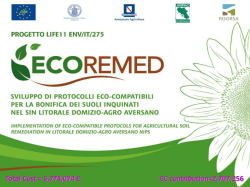
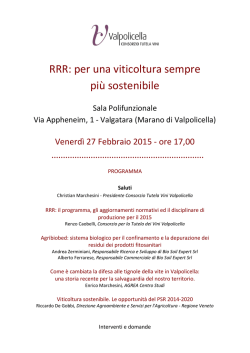
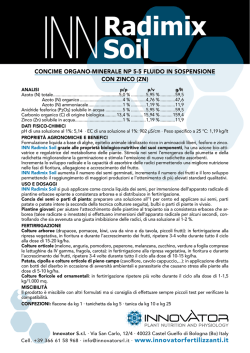
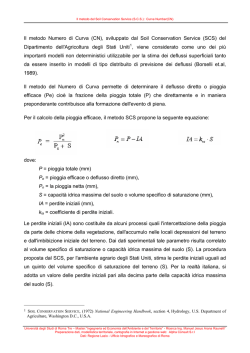
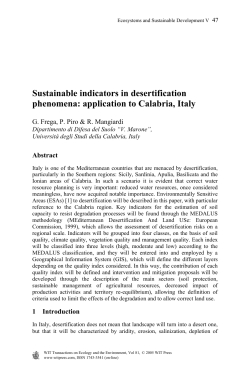
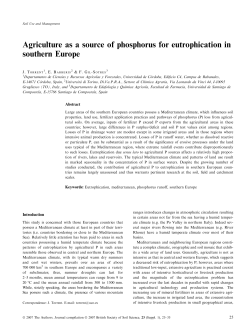
Solid Earth, 6, 783–797, 2015
www.solid-earth.net/6/783/2015/
doi:10.5194/se-6-783-2015
© Author(s) 2015. CC Attribution 3.0 License.
Volcanic soils and landslides: a case study of the island of Ischia
(southern Italy) and its relationship with other Campania events
S. Vingiani1 , G. Mele2 , R. De Mascellis2 , F. Terribile1 , and A. Basile2
1 Department
2 National
of Agricultural Sciences, University of Naples Federico II, Portici NA, Italy
Research Council, Institute of Agriculture and Forestry in the Mediterranean (CNR ISAFOM), Ercolano NA, Italy
Correspondence to: S. Vingiani ([email protected])
Received: 27 November 2014 – Published in Solid Earth Discuss.: 06 January 2015
Revised: 12 May 2015 – Accepted: 14 May 2015 – Published: 26 June 2015
Abstract. An integrated investigation was carried out on the
volcanic soils involved in the landslide phenomena that occurred in 2006 at Mt. Vezzi on the island of Ischia (southern
Italy). Chemical (soil pH, organic carbon content, exchangeable cations and cation exchange capacity, electrical conductivity, Na adsorption ratio and Al, Fe and Si forms), physical
(particle and pore size distribution, pore structure), hydrological (soil water retention, saturated and unsaturated hydraulic
conductivity), mineralogical and micromorphological analyses were carried out for three soil profiles selected in two of
the main head scarps.
The studied soils showed a substantial abrupt discontinuity
in all the studied properties at the interface with a buried fine
ash layer (namely, the 2C horizon), that was only marginally
involved in the sliding surface of the landslide phenomena.
When compared to the overlying horizons, 2C showed (i) fine
grey ash that is almost pumice free, with the silt content increasing by 20 %; (ii) ks values 1 order of magnitude lower;
(iii) a pore distribution concentrated into small (15–30 µm
modal class) pores characterised by a very low percolation
threshold (approximately 15–25 µm); (iv) the presence of expandable clay minerals; and (v) increasing Na content in the
exchange complex. Most of these properties indicated that
2C was a lower permeability horizon compared to the overlying ones. Nevertheless, it was possible to assume this interface to be an impeding layer to vertical water fluxes only
by the identification of a thin (6.5 mm) finely stratified ash
layer, on top of 2C, and of the hydromorphic features (e.g.
Fe / Mn concretions) within and on top of the layer. Although
Mt. Vezzi’s soil environment has many properties in common with those of other Campania debris-mudflows (e.g.
high gradient, north-facing slope, similar forestry, and vol-
canic origin of the parent material), the results of this study
suggest a more complex relationship between soil properties
and landslides and emphasise the role of vertical discontinuities as noteworthy predisposing factors.
1
Introduction
The Italian territory is vulnerable from a hydraulic and geological standpoint, owing to its distinctive geological, geomorphological and climatic factors, along with anthropic
pressures. Landslides are frequent and widespread (Guzzetti
et al., 1994; Guzzetti and Tonelli, 2004) and the damage
they cause is severe. In the last 50 years (1964–2013), all
20 Italian regions have suffered fatal events. Data from
CNR-IRPI (Italian National Council of Research-Research
Institute for Geo-Hydrological Protection), released by La
Stampa (2014), show floods in 989 municipalities, which
caused 1629 casualties (710 killed, 72 missing and 847 injured), and landslides in 1332 towns, which produced 3042
casualties (1297 killed, 15 missing and 1731 injured).
Campania is the region with the third-highest number of
landslide events (363) in Italy. In the ecosystems of this
region, the most dangerous types of landslide are debrismudflows, i.e. very rapid to extremely rapid flows of detritic and plastic materials with high water content (Hungr
et al., 2001). One of the most catastrophic historical events
occurred at Sarno on 5 and 6 May 1998: debris-mudflows
detached from the slopes of Pizzo D’Alvano and extended
3–4 km into the surrounding lowlands, causing the loss of
161 human lives and severe destruction. In addition, other
Published by Copernicus Publications on behalf of the European Geosciences Union.
784
S. Vingiani et al.: Volcanic soils and landslides: a case study of the island of Ischia
disastrous events struck the mountainous reliefs of this region before and after the Sarno event.
The soil properties and relationships between debrismudflows and soil types were investigated for 20 catastrophic landslides that occurred in Campania (Terribile et
al., 2000, 2007). The results showed that the most catastrophic events generally occurred on high gradient, northfacing slopes. The soils developed on pyroclastic materials,
covering the carbonatic reliefs of the Campania Apennines,
and belonged to the Andosols group, generally the MolliVitric and Pachi-Vitric Andosols (IUSS Working Group
WRB, 2014). In another study of the soils related to the
Sarno landslides, Basile et al. (2003) found an increase in
soil water storage, due to the occurrence of soil discontinuities (e.g. soil mantle cutting due to trackways), and
demonstrated that landslide susceptibility is also strongly affected by human-induced disturbances to forestry ecosystems. Therefore, these studies concluded that the main factors affecting the susceptibility of these types of soils to landslides were (i) slope gradient, (ii) aspect of the slope, (iii) soil
discontinuities, (iv) soil hydrological properties (i.e. water
retention and hydraulic conductivity) and (v) andic properties.
Hence, when five debris-mudflows were triggered on
30 April 2006, on the northern slope of Mt. Vezzi on the
island of Ischia, killing four people, an investigation to assess the presence of andic properties in Ischia’s soils was carried out, because of the close similarities of the environments
(volcanic), type of landslide (debris-mudflows) and aspect of
the slope (northern) with those of other Campania landslides
(Terribile et al., 2007). Thus, the principal aim of this work
was to investigate the properties (chemical, physical, hydrological, mineralogical and micromorphological) of the soils
at Mt. Vezzi to (i) define whether the soil properties may have
had a role in causing these landslides, (ii) verify whether the
relationship between andic properties and debris-mudflows,
such as that found for the most catastrophic landslides that
occurred in Campania, is also valid for Ischia; and (iii) carry
out a detailed micro-scale investigation of the horizon that
was marginally involved with the sliding surface, to understand the causes of the events that occurred.
1.1
Events and geomorphological data related to the
landslide area
Five landslides (namely f1–f5, following Ascione et
al., 2007) (Fig. 1a) occurred at 7–8 a.m. on 30 April 2006
along the northern slope of Mt. Vezzi. The source area is located in the uppermost Costa Ruscello hillslope in a narrow
belt (between 315 and 345 m a.s.l.) close to Mt. Vezzi’s summit and is characterised by a high slope gradient (35–45◦ )
and variable morphology: f1 initiated at the outer rim of an
access track, while f2–f5 started very close to the free face
of Costa Ruscello’s summit (Ascione et al., 2007; De Vita et
al., 2007). In this study, only f2 and f3 were examined. The
Solid Earth, 6, 783–797, 2015
landslides were classified by De Vita et al. (2007) as complex
debris slides–debris flows (according to Cruden and Varnes,
1996). Mazzarella and De Luise (2009) reported a very low
cumulative rainfall of 14 mm during the 24 h before the landslides were triggered, as measured by the nearest available
meteorological station (Forio d’Ischia) (Fig. 1b). The station
is located rather far (6 km) from Mt. Vezzi and at 150 m a.s.l.
Nevertheless, remarkable evidences of water runoff and reliable witnesses indicated that the landslides were preceded by
intense localised rainfall that was not detected by the Forio
d’Ischia station.
1.2
Geological and environmental setting
The island of Ischia represents the emerged part of a large
active volcanic complex rising to more than 1000 m a.s.l.,
located in the easternmost portion of the Naples city area
(Fig. 1c). Together with the island of Procida and the Campi
Flegrei caldera, Ischia constitutes the Phlegrean volcanic district (De Vita et al., 2010). Mt. Vezzi (392 m a.s.l.) is located in the south-eastern area of the island (Fig. 1b) and,
together with Mt. Torrione (375 m a.s.l.), belongs to a group
of relics of a major volcanic complex related to the second
of the five volcanic phases recorded on the island (Rittmann
and Gottini, 1980; Vezzoli, 1988, Civetta et al., 1991). The
top of Mt. Vezzi consists of a lava dome (Di Nocera et
al., 2007) covered by the Piano Liguori Formation, i.e. pyroclastic products of recent hydromagmatic explosive activity (about 5347–5807 years BP, 14 C calibrated) (Orsi et
al., 1996), which consists of trachytic ash and pumice layers. The dominant land use in Piano Liguori and the nearby
surrounding slopes consists of vineyards, whereas chestnut
coppice woodland characterises the high gradient northern
slopes. The woodland appears poorly managed in the head
scarps because of clear signs of unplanned cutting and evidence of anthropic disturbances, such as a dense trail network
and fire traces on tree barks.
2
Materials and methods
The first survey on the head scarps of Ischia’s landslides was
conducted in the period just after the landslides (on 12 May
2006), when two shallow soil profiles were analysed (Vingiani and Terribile, 2007). However, a detailed pedological
study was carried out only during the following summer,
due to the wet state of the deep soil horizons, which limited
digging. Soil profiles were studied in the main representative head scarps and were selected as representative pedons
of each detachment area. Two (f2 and f3) of the five head
scarps were studied (Fig. 1a). Two soil profiles (P1 and P2),
approximately 3 m apart, were described and sampled in f2
and one (P3) in f3, following the guidelines of FAO (2006).
Bulk and undisturbed soil samples were collected for chemical, physical (particle size distribution and hydraulic propwww.solid-earth.net/6/783/2015/
S. Vingiani et al.: Volcanic soils and landslides: a case study of the island of Ischia
Figure 1. (a) Northern slope of Mt. Vezzi, showing both the positions and names (by Ascione et al., 2007) of the five head scarps;
(b) topographic map of Ischia (1 : 50 000 scale), showing the locations of Mt. Vezzi and the Forio station, (c) location of the island of
Ischia ahead of the Golfo di Napoli (southern Italy).
erties), mineralogical, micromorphological and microtomographic analyses. The soils were classified using the WRB
system (IUSS Working Group WRB, 2014). Moreover, two
field sensitivity tests were used to estimate the soil’s andic
properties: (1) one test evaluates the thixotropy (smearing
upon pressure) of moist, undisturbed soil samples by applying a simple pressure between fingers (Wells and Furkert, 1972). When allophanes (therefore andic properties) are
present, the material becomes sensitive and suddenly shears
under increasing pressure. The other test (2) evaluates the
amount of non-crystalline (amorphous) material in the soil;
the action of sodium fluoride (NaF) upon non-crystalline soil
material induces the release of OH− into the soil solution and
increases the pH (Fields and Perrott, 1966).
2.1
Chemical analysis
The bulk soil samples were air-dried and sieved at 2 mm.
The percentage of coarse fragments (> 2 mm) was calculated
on a weight basis. Chemical analyses were carried out on
the fine earth fraction, according to the Soil Survey Laboratory Methods Manual (SSS, 2014). Soil pH was determined potentiometrically from soil-H2 O (1 : 2.5 ratio) and
soil solution (KCl 1 M and NaF 1 M, 1 : 2.5 and 1 : 5 ratios, respectively) suspensions. Organic carbon (OC) content
was determined following Walkley and Black’s (1934) procedure and the cation exchange capacity (CEC) was determined according to Mehlich (1938), with barium chloridetriethanolamine buffered at pH 8.2, and exchangeable cations
(Ca2+ , Mg2+ , Na+ , K+ ) were measured by the ICP-AES
Varian Liberty model 150. Phosphate retention was deterwww.solid-earth.net/6/783/2015/
785
mined according to Blakemore et al. (1987) and electrical
conductivity (EC) was measured from soil-H2 O (1 : 5 ratio)
suspensions. The sodium adsorption ratio (SAR) was calculated (Lesch and Suarez, 2009) as the square root of the ratio of the measured exchangeable sodium (Na+ ) to calcium
+ magnesium (Ca2+ + Mg2+ ), divided by two, and the exchangeable sodium percentage (ESP) was calculated as the
percentage ratio of the Na+ content to the CEC.
Due to the volcanic origin of the parent material, specific
analyses were also required to assess the presence of andic
properties. Selective extraction procedures were applied to
the soil samples, and the different Al, Fe and Si forms were
determined. The acid ammonium oxalate-extractable forms
(Alo , Feo and Sio ) were obtained according to Schwertmann
(1964) and Blakemore et al. (1987), and the Na-dithionite
citrate bicarbonate (DCB)-extractable components (Ald , Fed
and Sid ), also called the total “free iron oxides”, were obtained by the Mehra and Jackson (1960) procedure. The Napyrophosphate-extractable complexes (Alp and Fep ) were
obtained according to Bascomb (1968). The concentration
of the elements was then measured using the ICP AES Varian Liberty model 150. The allophane and ferrihydrite contents were calculated using Parfitt (Parfitt and Wilson, 1985;
Parfitt, 1990) and Childs’ (1985) formulae, respectively.
2.2
Hydrological analysis
Hydrological analyses were carried out on undisturbed soil
samples (diameter 86 mm, height 150 mm) collected from
selected horizons along soil profiles P2 (Bw1 , Bw2 , Bw4 ,
2CB, 2C) and P3 (Bw4 , 2C, 3Btb). The saturated hydraulic
conductivity, ks , was measured using a constant head permeameter (Reynolds and Elrick, 2003). The soil water retention
θ (h), which is the relationship between the water content θ
and water pressure head h, and the hydraulic conductivity
k(θ ), which is the relationship between the hydraulic conductivity k and water content θ, were both determined by
applying the evaporation method (Arya, 2002). The undisturbed soil samples were slowly saturated from the bottom.
Three tensiometers were installed at three different depths in
the samples and placed on a load cell; starting from saturation
and during 1-dimensional transient upward flow, the pressure
head and weight of the sample were automatically recorded
at these depths until air was observed in the circuit of the
uppermost tensiometer. Afterwards, the soil sample was dismantled and placed in an oven at 105 ◦ C for 24 h to determine the water content from the weight data set. An iterative
method was applied to obtain the θ (h) relationship (Basile
et al., 2012). The unsaturated hydraulic conductivity curve
was obtained by applying the method proposed by Watson
(1966). Details of the calculus procedure can be found in
Bonfante et al. (2010).
Solid Earth, 6, 783–797, 2015
786
2.3
S. Vingiani et al.: Volcanic soils and landslides: a case study of the island of Ischia
Physical and microtomographic analyses
The particle size distribution (PSD) of soil samples was determined after dispersion with Na-hexametaphosphate and
the measurements were carried out using the laser diffraction
technique with a Malvern Mastersizer 2000 system (Glendon
and Dani, 2002).
X-ray microtomography was performed to reconstruct 3D images of the inner structure of the soil samples collected from three subsurface contiguous horizons identified
in soil profile P2. The SKYSCAN 1172 desktop system
(www.skyscan.be), which is based on a microfocus cone
beam X-ray source, was used and an optimised inverse radon
transform (Kak and Slaney, 1988) was applied to the Xray attenuation coefficient data set for image reconstruction.
Then, the “successive opening” image analysis algorithm
(e.g. Serra, 1982; Horgan, 1998) was applied to the reconstructed 3-D images to obtain a pore size distribution (PoSD)
consisting of the pore space classification made according to
the wall spacing. Finally, the procedure of Lantuejoul and
Maisonneuve (1984) was applied to calculate the percolation
curves and evaluate the connectivity of the pore space.
The inter-aggregate PoSD of each horizon was calculated
by scanning undisturbed soil samples collected with polymethyl methacrylate (PMMA) cylinders that are 3.4 cm in
height and diameter, then a 3.5 cm3 cubic region of interest (ROI) was reconstructed at 30 µm pixel size (image resolution). The intra-aggregate 3-D pore structure was reconstructed and analysed for a 3.5 mm3 ROI at 1.5 µm image resolution by separately scanning two selected aggregates from
the bulk samples.
In addition, a pore size distribution was derived from the
hydrological analysis. Specifically, the scale of the soil water
pressure head on the axis of the soil water retention curve can
be replaced by that of the diameter of the capillaries according to the capillarity law |h| ≈ 0.3/d for length units in cm
(Jurin, 1718). This procedure supplies the cumulative pore
size distribution curve. The derivative of this curve is the
curve of the pore size density distribution. Such a schematisation, which assumes that a simple conceptual model of
the soil porous system as a bundle of parallel capillaries to
be correct, leads to the derivation of the “equivalent” pore
size distribution. In this manner, the equivalent diameters are
those of the bundle of capillary tubes, which behave, in functional terms, as the soil sample.
2.4
Mineralogical and micromorphological analyses
Mineralogical analyses were carried out by means of Xray diffractometry (XRD) on sand, silt and clay fractions.
The samples were dispersed with Na-hexametaphosphate
and separated into different sizes by means of sieving, for
the sand and silt fractions, and by centrifuge, for the clay
fraction. The clay fraction was saturated using CaCl2 and
washed with water and ethanol, until the chlorides were
Solid Earth, 6, 783–797, 2015
removed. The mineralogical spectra were acquired with a
Rigaku Geigerflex D/Max IIIC, with CuKa radiation and
Ni-filtered, at 35 kW and 35 mA. Powder samples of sand
(2 mm–50 µm) and silt (50–2 µm) were analysed to detect the
primary and secondary minerals, while clays (< 2 µm) were
analysed on oriented mounts.
Undisturbed samples collected by means of Kubiena boxes
for micromorphological studies were impregnated with crystic resin, and large (15 cm × 7.5 cm) thin sections were produced using FitzPatrick’s methodology (1984, 1993). The
micromorphological description followed the terminology
used by FitzPatrick (1993).
3
3.1
Results
Soil morphology
All the studied soils (Table 1) were very deep and characterised by the following sequence: shallow (approximately
5 cm) brownish surface horizons (A), dark yellowish to olive
brown Bw horizons, and greyish brown to light brownish grey 2C horizons. Both field tests for the identification of andic properties were negative, showing the absence
of thixotropy and andic properties. Carbonates were absent
from all the soil samples. The soil structure was generally
weakly to moderately developed in all the A and Bw horizons (see Table 1) but abruptly changed to massive structure
in 2C. Just after the landslide events, the soil horizons also
showed very different moisture statuses: the A and Bw horizons were slightly moist, whereas the massive 2C was wet,
which limited digging to a depth of 100 cm. The above described 2C horizon was found in all the studied soil profiles
and was only marginally involved with the sliding surface of
the recorded landslides (De Vita et al., 2007). In P1 and P3,
a buried yellowish red B horizon (named 3Btb in P1 and P3)
with a moderately developed structure was found below 2C.
Very few to few roots were found in the A and Bw horizons,
but they were always absent from 2C and 3Btb.
3.2
Main chemical properties
The results of the chemical analyses showed a large accumulation of OC (46.1–71.3 g kg−1 ) (Table 2) in all the
A horizons. As expected, the OC decreased rapidly with
depth (Bw1 horizons: 12.3–6.0 g kg−1 ; 2C horizons: 0.8–
1.2 g kg−1 ). A similar trend was followed by the CEC, whose
highest values – as expected – were found in the A horizons. The soils had a generally neutral reaction (pHH2 O ),
with the pH increasing weakly with depth until the 2C horizon (Table 2). pHKCl was 1–2.5 units lower than pHH2 O ,
which suggested a potential exchangeable acidity (due to H+
and Al3+ ions) that was particularly high for the 2C horizons (values between 2.0 and 2.5). Although the exchangeable complex was dominated by Ca2+ , high Na+ + Mg2+
contents (40–65 %) were measured in the deepest horizons
www.solid-earth.net/6/783/2015/
S. Vingiani et al.: Volcanic soils and landslides: a case study of the island of Ischia
787
Table 1. Field morphology description of the studied soil profiles.
Profile
Horizon
Depth (cm)
Moistness
Colour (moist)
P1
A
Bw1
Bw2
2CB
2C
3Btb
0–5
5–18
18–55
55–70
70/90–110/120
110/120–170+
sm
sm
m
sm
sm
sm
10YR 3/2
10YR 4/4
2.5Y 4/3
2.5Y 4/3
2.5Y 5/2
10YR 4/4
P2
A
Bw1
Bw2
Bw3
Bw4
2CB
2C
0–5
5–50
50–90/110
110–130/140
140–170
170–180/205
205–215+
sm
sm
sm
sm
sm
sm
sm
P3
A
Bw1
Bw2
Bw3
Bw4
2C
3Btb
0–5
15–50
50–85
85–135
135–190
190–220
220–260+
sm
sm
sm
sm
sm
sm
sm
Structure
Roots
Rock fragments
we to mo fi GR
we to mo me SB
we to mo SB
we SB me to MA
MA
mo me SB
vf F
fV
vf F
N
N
N
fA
mA
mM
mM
fV
fV
10YR 2/2
10YR 4/4
10YR 4/4
2.5Y 4/4
2.5Y 4/3
2.5Y 4/3
2.5Y 5/2
we fi GR
we me SB
we co SB
we co SB
we me SB
we SB me to MA
MA
vf F
fV
fF
cV
fV
fV
N
fF
fC
mA
fm A
mM
fV
N
10YR 2/2
10YR 4/4
10YR 4/4
2.5Y 4/3
2.5Y 4/3
2.5Y 6/2
10YR 5/4
mo fi GR
we me SB
we co SB
we me SB
we me SB
we SB me to MA
mo me SB
vf F
fF
vf V
vf V
vf F
N
N
mF
fm C
cA
mM
mM
N
N
Legend according to FAO (2006).
Soil structure:
grades: we: weak, mo: moderate, st: strong;
size classes: co: coarse, vc: very coarse, me: medium, fi: fine;
types: GR: granular, CR: crumbly, AB: angular blocky, PR: prismatic, SB: subangular blocky, MA: massive, SG: single grain.
Moistness:
sm: slightly moist, m: moist, w: wet.
Roots:
diameter: vf: very fine, f: fine, m: medium, c: coarse;
abundance: N: none, V: very few, F: few, C: common, M: many.
Rock fragments:
size classes: f: fine, m: medium, c: coarse, s: stones, b: boulders, l: large boulders;
abundance: N: none, V: very few, F: few, C: common, M: many, A: abundant, D: dominant, S: stone line.
of the three profiles, which showed a calculated exchangeable sodium percentage (ESP) that was generally higher than
15 %. Data from the selective extraction procedures showed
generally low % Alo + 0.5Feo , ranging from 0.1 to 0.7, and
low allophane (0.9–2.6 %) and ferrihydrite (0.1–0.6 %) contents (Table 3) for all of the soils. The low %Alo + 0.5Feo ,
which is associated with low phosphate retention – Pret –
(2–35 %) (Table 3), indicated that these soils generally did
not satisfy the requirements for Andosol classification (IUSS
Working Group WRB, 2014), except for soil profile P1,
which falls into the Andosols region around the boundary
with the Cambisols. Therefore, these soils were classified as
follows: P1,Vitric Andosol (loamic, novic, sodic); P2, Sodic
Cambisol (loamic, tephric) and P3, Sodic Cambisol (loamic,
colluvic, novic, tephric). Moreover, the Na-pyrophosphateextractable forms (Al and Fe-humus complexes) were always
negligible, according to the very low Alp / Alo ratios (< 0.4),
even in the most rich OC (71.3 g kg−1 ) horizon. The calculated Feo / Fed ratios showed values generally decreasing
with depth (from 0.7 to 0.1).
www.solid-earth.net/6/783/2015/
3.3
3.3.1
Physical properties
Particle size distribution (PSD)
The rock fragment (d > 2 mm) fraction showed the highest content of pumices in the A and B horizons (Table 4).
Medium size (5–20 mm) pumices ranged from few (3–4 %)
to many (18–22 %) in the A and B horizons, whereas only
few (approximately 1 % or less) and very fine (2–5 mm)
pumices were found in all the 2C horizons and in 3Btb in
both P1 and P3 (Table 4). The A horizons and most of the
Bw horizons were sandy loam; the former was coarser than
the latter. The Bw, 2CB and 2C horizons were silty loam
(Table 4), according to the higher silt content (greater than
50 %). All the horizons showed a more or less pronounced
bimodal PSD (Fig. 2). Generally, the A and Bw horizons
(Fig. 2a and c) exhibited a stronger bimodal distribution of
soil particles, one population having a peak at diameters of
approximately 30–50 µm and another at 600–900 µm. The
PSD of the 2C horizons (Fig. 2b and d) was revealed to be
very different, with a much less pronounced bimodal distriSolid Earth, 6, 783–797, 2015
788
S. Vingiani et al.: Volcanic soils and landslides: a case study of the island of Ischia
Table 2. Soil chemical properties.
Profile
Horizon
OC
pH
1pH
g kg−1
H2 O
KCl
NaF
CEC
Na
Ca
Mg
cmol(+) Kg−1
K
BS
ESP
EC
SAR
µS cm−1
%
P1
A
Bw1
Bw2
2CB
2C
3Btb
46.1
12.3
4.1
3.1
0.8
0.9
6.9
6.8
7.0
7.4
7.6
7.4
5.8
5.4
4.9
5.2
5.1
5.0
9.5
10.3
9.4
9.2
8.8
9.0
1.1
1.4
2.1
2.2
2.5
2.4
20.7
15.1
13.5
14.0
10.5
15.6
5.8
12.1
10.4
17.1
22.9
24.0
64.1
38.4
19.3
33.6
30.5
32.0
21.4
24.2
47.4
22.9
24.8
27.0
8.7
25.3
23.0
26.4
21.9
17.0
100
66
100
100
100
100
5.8
7.9
10.4
17.1
22.9
63.0
n.d.
n.d.
n.d.
75.8
50.7
102.2
0.4
0.7
0.7
1.2
1.4
1.4
P2
A
Bw1
Bw2
Bw3
Bw4
2CB
2C
71.3
5.9
5.6
4.7
2.7
1.3
1.2
6.7
7.1
7.4
7.1
7.3
7.2
7.3
6.0
5.7
5.9
5.1
5.4
5.0
4.8
9.5
9.9
10.1
10.0
9.7
9.5
9.0
0.7
1.4
1.5
2.0
1.9
2.2
2.5
36.8
10.7
9.4
13.0
10.8
12.4
9.9
3.3
10.0
12.9
14.5
17.8
18.5
34.8
73.1
46.0
48.2
46.2
43.9
34.7
4.5
19.3
23.0
20.0
14.5
13.1
23.4
30.3
4.3
21.0
18.8
24.8
25.2
23.4
30.3
100
94
90
90
100
100
90
3.3
9.3
11.7
13.1
17.6
18.5
31.3
n.d.
n.d.
n.d.
n.d.
73.6
59.6
64.8
0.3
0.5
0.6
0.9
1.1
1.2
2.5
P3
A
Bw1
Bw2
Bw3
Bw4
2C
3Btb
49.4
6.0
2.9
3.6
2.3
1.2
1.1
6.7
6.0
6.9
7.1
7.2
7.2
7.1
6.0
4.2
5.0
5.2
5.2
5.2
5.2
9.6
9.9
9.7
9.7
9.4
9.5
9.2
0.7
1.8
1.9
1.9
2.0
2.0
1.9
28.6
16.2
15.1
10.7
8.5
11.6
15.2
4.6
13.0
12.7
13.5
17.6
17.1
19.1
62.8
42.7
45.1
39.4
34.1
29.9
35.5
21.8
23.7
22.5
26.0
28.2
35.9
27.6
10.9
20.6
19.7
21.2
20.0
17.1
17.8
100
80
94
96
100
100
100
4.5
10.5
11.9
13.1
17.6
17.2
19.1
n.d.
n.d.
n.d.
n.d.
58.7
63.3
127.1
0.4
0.8
0.8
0.8
0.9
1.0
1.3
BS: base saturation calculated as
P
bases · 100/CEC. ESP: exchangeable sodium percentage. SAR: sodium adsorption ratio. 1pH: calculated as the difference between pH H2 O and pH KCl.
Table 3. Selectively dissolved elements (Al, Fe, Si) measured by ICP AES.
Profile
Horizon
Alo
Feo
Sio
Alp
Fed
Alo +0.5 Feo
g kg−1
Pret
Alp / Alo
Feo / Fed
Allophane
%
Ferrihydrite
%
P1
A
Bw1
Bw2
2CB
2C
3Btb
2.8
5.2
2.0
1.7
0.5
n.d.
2.3
3.5
1.8
1.2
0.3
n.d.
3.1
4.9
2.7
2.6
1.9
n.d.
0.4
0.5
0.1
0.1
0.1
n.d.
3.8
5.0
4.6
4.5
1.9
n.d.
0.4
0.7
0.3
0.2
0.1
n.d.
25
34
19
16
2
n.d.
0.2
0.1
0.1
0.0
0.3
n.d.
0.61
0.69
0.38
0.27
0.17
n.d.
1.6
2.6
1.4
1.3
0.8
n.d.
0.4
0.6
0.3
0.2
0.1
n.d.
P2
A
Bw1
Bw2
Bw3
Bw4
2CB
2C
3.5
3.3
3.9
1.8
1.6
0.8
0.5
2.5
2.0
1.8
1.5
1.0
0.4
0.3
3.6
4.6
5.0
2.5
2.4
2.2
2.0
0.7
0.1
0.1
0.1
0.0
0.2
0.2
3.9
3.5
3.3
3.8
3.7
2.6
2.2
0.5
0.4
0.5
0.3
0.2
0.1
0.1
32
22
20
17
15
8
4
0.2
0.0
0.0
0.0
0.0
0.2
0.4
0.65
0.58
0.54
0.40
0.27
0.17
0.15
1.8
2.3
2.6
1.3
1.2
1.0
0.9
0.4
0.3
0.3
0.3
0.2
0.1
0.1
P3
A
Bw1
Bw2
Bw3
Bw4
2C
3Btb
3.1
2.2
2.2
1.3
0.7
0.6
0.8
2.0
1.2
1.0
0.8
0.5
0.4
0.4
3.4
2.8
3.0
2.5
2.1
2.2
2.2
0.3
0.1
0.0
0.1
0.1
0.1
0.3
4.3
4.3
4.1
3.6
2.5
2.2
3.1
0.4
0.3
0.3
0.2
0.1
0.1
0.1
27
21
18
12
8
5
9
0.1
0.1
0.0
0.0
0.1
0.1
0.3
0.47
0.27
0.23
0.23
0.19
0.18
0.13
1.8
1.4
1.5
1.2
1.0
1.0
1.0
0.3
0.2
0.2
0.1
0.1
0.1
0.1
Alo , Feo , Sio : ammonium oxalate-extractable aluminium, iron and silicium. Alp : Na-pyrophosphate-extractable aluminium. Fed : Na-dithinite citrate-bicarbonate-extractable iron.
Pret: phosphate retention. Allophane: calculated following the Parfitt and Wilson (1985) formula = 100 · %Sio /{−5.1 · [(Alo − Alp )/Sio ] + 23.4}. Ferrihydrite: calculated
following Childs’ formula = % Feo · 1.7.
bution, or an overall unimodal distribution, in which the most
abundant population had a diameter of approximately 30 µm.
Solid Earth, 6, 783–797, 2015
The PSD of Bw4 showed an intermediate behaviour between
the Bw series and the underlying 2C horizons.
www.solid-earth.net/6/783/2015/
S. Vingiani et al.: Volcanic soils and landslides: a case study of the island of Ischia
789
Table 4. Particle size distribution (PSD) and saturated hydraulic conductivity (ks ).
Profile
Horizon
Sand
Silt
Clay
∗ Rock fragments
Textural classes
%
ks
cm h−1
cm s−1
P1
A
Bw1
Bw2
2CB
2C
3Btb
57.8
49.0
49.3
35.5
36.5
n.d.
39.0
45.4
44.8
55.8
56.6
n.d.
3.2
5.7
5.9
8.6
6.9
n.d.
16.0
13.4
6.2
20.3
0.9
n.d.
SL
SL
SL
SiL
SiL
P2
A
Bw1
Bw2
Bw3
Bw4
2CB
2C
57.7
53.8
55.3
43.9
36.1
28.4
24.6
39.9
40.9
39.7
50.2
54.5
63.9
68.8
2.4
5.2
5.0
5.9
9.4
7.7
6.6
3.1
11.1
25.5
8.9
4.2
1.0
0.1
SL
SL
SL
SL
SiL
SiL
SiL
1.03 × 10²
1.35 × 10²
2.86 × 10⁻²
3.75 × 10⁻²
8.07 × 101
2.33 × 101
5.50 × 100
2.24 × 10⁻²
6.47 × 10⁻³
1.53 × 10⁻³
A
Bw1
Bw2
Bw3
Bw4
2C
3Btb
50.7
51.0
46.7
41.3
48.5
33.1
38.9
45.8
43.1
47.3
50.6
44.7
59.2
55.2
3.5
5.9
6.1
8.1
6.9
7.7
5.9
8.0
20.9
10.5
11.1
8.0
1.3
0.7
SL
SL
SL
SiL
SL
SiL
SiL
2.00 × 10²
1.06 × 101
2.40 × 101
5.56 × 10⁻²
2.94 × 10⁻³
6.67 × 10⁻³
P3
∗ values are percentages of the total bulk soil; n.d.: not determined.
Figure 2. Particle size distribution (PSD) of (a) A and Bw horizons along soil profile P2 and (b) 2CB and 2C horizons along soil profile
P2, (c) A and Bw horizons along soil profile P3, and (d) the 2C horizon along the soil profile P3.
3.3.2
Hydraulic properties
As a whole, the investigated horizons showed high water
retention capacity. The saturated soil water content ranged
from 0.56 to 0.64 cm3 cm−3 , with a slight decrease from the
www.solid-earth.net/6/783/2015/
surface to the bottom of the soil profile. The water retention
curves and the equivalent pore size distributions of the selected horizons from P2 are shown in Fig. 3a and b, respectively. Due to the strong similarity between P2 and P3 hydrological data, the results of the P3 are not shown. The water reSolid Earth, 6, 783–797, 2015
790
S. Vingiani et al.: Volcanic soils and landslides: a case study of the island of Ischia
an equivalent pore dimension ranging between 1 and 10 mm.
This behaviour is common in many natural soils, where the
presence of aggregates frequently results in pore size distributions with two or more peaks, which is reflected in water
retention curves with at least two inflection points (Coppola
et al., 2009). The shape of 2C’s retention curve was different,
almost overlapping the others up to approximately 20 cm, but
decreasing sharply between 100 and 1000 cm. This trend is
related to a leptokurtic pore size distribution (Fig. 3b), with
the prevailing class at 10 µm. An intermediate trend between
the Bw and the 2C horizons was shown by the retention curve
of 2CB.
The unsaturated hydraulic conductivity curves of three
(Bw1 , 2CB and 2C) selected horizons from P2 are shown
in Fig. 3c. In the pressure head range where the measured
curves overlap (h between −190 and −330 cm), the 2C horizon showed higher unsaturated hydraulic conductivity with
respect to the upper horizons. This result is consistent with
the steeper slope shown by 2C’s water retention curve in
the same explored range. In fact, the relative hydraulic conductivity at a specific pressure head value is a function of
the slope of the water retention curve at the same point,
which is greater than its absolute value (Kutilek and Nielsen,
1994; Basile et al., 2006). Moreover, the saturated hydraulic
conductivity values decreased with depth (Table 4). Indeed,
the highest values were found along the upper Bw horizons
(k > 100 cm h−1 ), while they decreased by 1 order of magnitude for Bw4 and 2CB in P2 (k = 80.7 and 23.3 cm h−1 ),
2 orders of magnitude for 2C in P2 (k = 5.5 cm h−1 ), and 1
order of magnitude between Bw4 and 2C in P3 (k = 200 and
10.6 cm h−1 ). The different ranks along the depth of the saturated and unsaturated hydraulic conductivity are not surprising because these properties apply to different pore ranges.
3.4
Figure 3. Hydraulic properties of selected horizons along soil profile P2: (a) water retention curves, (b) equivalent pore size distributions and (c) hydraulic conductivity curves.
tention curves of the Bw horizons showed a smoothed shape
underlying a mesokurtic equivalent pore size distribution,
indicating the presence of a wide range of pore diameters
(Fig. 3b). Moreover, the Bw water retention curves exhibited
a slight bimodality, with a secondary porous system having
Solid Earth, 6, 783–797, 2015
Optical microscopy
Selected results from the micromorphological analyses of P2
are shown in Fig. 4. The surface of the A horizon showed
a very fine granular structure, the presence of living roots,
blackish granules and stains from decomposed plant residues
(Fig. 4a). The following Bw horizon, which was characterised by a granular microstructure, exhibited very abundant (from 25 to 50 %) and generally unweathered pumice
fragments enveloped by silty–fine sandy brown material
(Fig. 4b). A clear microstructure change was observed in the
deeper 2CB horizon, which was characterised by an incomplete sub-angular blocky microstructure that was less porous
than that of the overlying layers. Angular to sub-angular peds
(Fig. 4c1 and c2 ), which were made by pseudo-stratified materials, were found chaotically immersed in the soil matrix
and interpreted as fragments of the underlying horizon (2C).
The soil matrix and some aggregates from 2CB showed clay
coatings in pores and likely neogenetic clays in pumice fragments (Fig. 4d1 and d2 ), both indicating weathering processes.
www.solid-earth.net/6/783/2015/
S. Vingiani et al.: Volcanic soils and landslides: a case study of the island of Ischia
791
The following 2C horizon showed a thin stratification
in the upper 6–7 mm, which was commonly encrusted by
Fe–Mn segregations (Fig. 4e). Moreover, anisotropic clay
coatings and frequent Fe–Mn segregations (Fig. 4f1 and f2 )
coated the walls in a root pore located just above the described stratification and having the same direction. In the
lower part, the 2C horizon became coarser, due to the occurrence of a layer with a single grain microstructure, with pores
filled by clay materials (Fig. 4g1 and g2 ).
3.5
Microtomographic analyses
Hydrological data provided an indirect evaluation of the pore
arrangement through the equivalent pore size distribution;
however, a direct evaluation of the real pore size distribution was achieved by image analysis (Fig. 5a). The interaggregate and intra-aggregate porosity were investigated using different image resolution limits (30 and 1.5 µm, respectively; pores smaller than pixel resolution cannot be
detected). These values correspond roughly to −100 and
−2000 cm of pressure head, according to the capillary law.
In Fig. 5b1 the inter-aggregate PoSD (> 30 µm) of three representative P2 soil horizons (Bw4 , 2CB, 2C) is reported. The
three curves exhibit very similar shapes, being unimodal and
asymmetric to the right. Bw4 is characterised by the highest porosity (36.2 %), calculated by integrating the area under the curve, the highest modal value (210 µm) of pore size
and the widest pore size variability range, with the largest
pores reaching a size of 2 mm. By contrast, 2C has the lowest porosity (only 6.7 %), the lowest modal value of pore size
(150 µm) and a maximum pore size of 1 mm, even though
the most frequently found pore sizes were below 550 µm
(Fig. 5b1 ). Measurements of the inter-aggregate connected
porosity were reported in the three spatial directions by percolation curves (Fig. 5b2 ). These curves represent the percentage of the pore volume that connects opposite faces of
the ROI, after the virtual occlusion of pores of increasing
size. The curves of the three selected soil horizons exhibit
different values of initial (no pore occlusion) connectivity
and percolation thresholds (pt). The pt represents the maximum diameter that guarantees connectivity in a defined space
direction. Therefore, the percolation curves can identify the
critical sizes of pores that limit fluid and solute transport
in any direction. All the samples showed an isotropic initial connectivity, with the highest and lowest values for Bw4
and 2C, respectively. The results on the z axis (Fig. 5b2 )
showed a pt with higher (510 µm) pore sizes for Bw4 compared to those of 2C (330 µm) and 2CB (270 µm). Because
the 2C horizon’s connected porosity was only 11 % of the total porosity at 270 µm, the data for 2C and 2CB can be considered to be very similar. The pore connectivity along the
other two (x, y) directions (the horizontal plane) was not very
different, with the 2C horizon showing the lowest pt at 210
and 150 µm on the x and y axis, respectively. Therefore, in
the range of the detected pore size (> 30 µm), the data seem
www.solid-earth.net/6/783/2015/
Figure 4. Optical microscopy: (a) very fine granular structure, presence of living roots and decomposed organic residues in the A horizon; (b) granular structure, showing very abundant (from 25 to
50 %) poorly weathered pumice fragments, enveloped by silty–fine
sandy brown material, in the Bw horizon; (c) angular to sub-angular
aggregates, pseudo-stratified by finer brownish and coarser materials and chaotically immersed in the soil matrix of the 2CB horizon
(c1 and c2 in PPL and XPL, respectively); (d) weathering and neogenetic clays in a pumice and clay coating fragments in a root pore
(d1 and d2 in PPL and XPL, respectively); (e) transition from 2CB
towards the finely stratified upper part of 2C; (f) root pore at the
2CB–2C boundary, in which anisotropic clay coatings and frequent
Fe–Mn segregations coat the walls (f1 and f2 in PPL and XPL, respectively); (g) lower, coarser part of 2C, which has a mineral granular structure with pores emptied by clay infillings (g1 and g2 in
PPL and XPL, respectively).
Solid Earth, 6, 783–797, 2015
792
S. Vingiani et al.: Volcanic soils and landslides: a case study of the island of Ischia
Figure 5. Microtomographic analysis: (a) 1.5 cm3 × 1.5 cm3 × 1.5 cm3 ROIs (regions of interests) of three soil horizons along soil profile P2
reconstructed by X-ray MicroCT (30 µm image resolution) and (b) inter-aggregate (1) pore size distribution (PoSD) and (2) percolation
curves (pore connectivity) from the 3-D image analysis of Bw4, 2CB and 2C along soil profile P2. The intersections between the percolation
curves and abscissa represent the percolation threshold (pt) of the samples. Panel (c) shows intra-aggregate (1) PoSD and (2) pore connectivity
from the 3-D image analysis of the two selected aggregates (types I and II) from 2C along soil profile P2.
to suggest the occurrence of an isotropic highly permeable
horizon (Bw) overlaying horizons with lower permeability
(2CB and 2C) in the soil profile. When we compared the
porosity assessed by hydrological measurements with that
obtained by the inter-aggregate microtomographic analyses
(pores larger than 30 µm), the first values were, as expected,
higher for all the analysed horizons, with the largest difference found for 2C (Table 5). The discrepancy in the data is
mainly due to the applied resolution, and the largest difference was found for the 2CB and 2C horizons because they
were mainly formed by pores smaller than 30 µm. Therefore,
intra-aggregate porosity data were successively acquired on
2C using a resolution limit of 1.5 µm (Fig. 5c1 ) to better investigate the porosity of the 2C horizon. The results showed
two main types of aggregates that build this horizon: aggregate type I, which has internal massive microstructure, and
aggregate type II, which has a micro fibric structure; both
were characterised by high porosity (43.9 and 60.7 %, respectively) made by small pores (15 and 30 µm modal class,
Solid Earth, 6, 783–797, 2015
Table 5. Comparison between the porosity data obtained by hydrological and microtomographic measurements.
Soil
horizons
Bw4
2CB
2C
Porosity %
Hydrological
data
Inter-aggregate by
microtomography∗
Estimate
of pores
smaller
than 30 µm
61
57
61
36
15
7
25
42
54
∗ more than 30 µm resolution.
respectively) (Fig. 5c1 ). Analysis of the pore connectivity
(Fig. 5c2 ) showed that 100 % of the pores were interconnected in each direction but the percolation thresholds were
very low (approximately 15–25 µm).
www.solid-earth.net/6/783/2015/
S. Vingiani et al.: Volcanic soils and landslides: a case study of the island of Ischia
Figure 6. XRD patterns of untreated and treated (where EG is ethylene glycol solvated) clay samples separated from soil horizons
along soil profile P2. Peak positions are in nm.
3.6
Clay mineralogy
As a whole, K-feldspars (peaks at 0.647, 0.334, 0.324 and
0.321 nm) and mica (0.994, 0.500, 0.448, 0.332, 0.257 nm)
were the minerals found in the sandy and silty fractions of
both the soil horizons and ash deposits (2C horizons) (data
not shown). By contrast, the XRD patterns of the clay fraction (Fig. 6) showed differences between the A–Bw horizons and 2CB–2C. Indeed, kaolinite and/or halloysite (0.711,
0.445, 0.356 nm), mica or illite (0.998, 0.495, 0.333 nm)
and analcime (0.555 nm) peaks were found in all the horizons, whereas only 2CB and 2C showed ∼ 1.4 nm peaks
(1.48 nm) in the Ca-saturated samples. After EG treatment,
the ∼ 1.4 nm peaks shifted to ∼ 1.6 nm (Fig. 6), owing to the
expandable nature of these clay minerals, which were then
identified as smectites.
4
4.1
Discussion
Ischia’s soil properties
As a whole, the results of the pedological study carried out on
some head scarps of the Mt. Vezzi landslides show the occurrence of (i) topsoils with organic matter accumulation, very
fine granular structure, a presence of living roots and blackish
granules and stains from decomposed plant residues, which
are frequent features of forestry soils (Bullock et al., 1985;
Stoops, 2003; Blazejewski et al., 2005; Stolt and Lindbo,
2010). Results also show occurrence of (ii) subsoils with
www.solid-earth.net/6/783/2015/
793
weakly- to moderately-developed soil structure of yellowish and greyish colours; this suggests a generally low degree of weathering, as a consequence of scarce iron oxide
formation. The higher Feo / Fed ratios decreasing with depth
(0.7–0.1) lead us to conclude that the deeper horizons had undergone a higher degree of weathering than the upper horizons. Although these soils originated from volcanic parent
material, they do not exhibit andic properties (as defined by
IUSS Working Group WRB, 2014), instead displaying vitric properties in a few horizons in P1. Similar to other volcanic soils of the Campania region (di Gennaro and Terribile, 1999; di Gennaro et al., 2002), the chemical and physical properties of Ischia’s soils exhibit large spatial variability in both the horizontal and vertical directions among
pedons. The main abrupt variation in the soil’s properties
is identified at variable depths between 70/90 and 205 cm,
where pumice-bearing soil horizons (A and Bw) overlie fine
ashes (2CB and/or 2C), with the silt content increasing by
20 %. These fine ashes were found in all the studied soil
profiles and were only marginally involved with the sliding surface of the recorded landslides (De Vita et al., 2007).
According to the abrupt discontinuity, a relevant change of
the physical, micromorphological and mineralogical properties was found. Indeed, the inter-aggregate porosity, which
was investigated by means of microtomographic analyses,
shows remarkable differences between the Bw and 2C horizons in terms of the following: (i) total porosity larger than
30 µm (36.2 and 6.7 %, respectively); (ii) mode of the pore
size distribution (210 and 150 µm, respectively); (iii) maximum pore size, which is larger in Bw (≤ 2 mm) than in 2C
(≤ 1 mm); and (iv) connected porosity (percolation thresholds at approximately 500 µm and 150–225 µm pore size, respectively). Moreover, the intra-aggregate (in the range of
30–1.5 µm) connected porosity, which was measured only
in 2C, shows the occurrence of aggregates characterised by
high total porosity (60.7–43.9 %) made by small pores (15–
30 µm modal class) and a very low percolation threshold
(approximately 15–25 µm) which lower the permeability of
the pore network. The pore connectivity, combined with the
very high porosity values, fully agrees with the high water
retention found by the hydrological analyses in this horizon. In fact, the full connectivity of the intra-aggregate pore
network allows complete water saturation of the 2C horizon, whereas small pores with low percolation thresholds
require high energy to remove water from such a system.
Data of intra-aggregate connected porosity are also consistent with the general decrease in saturated hydraulic conductivity (ks ) that is also observed with depth, with the lowest values found in 2C. Nevertheless, the ks value of 2C
is still high, and the authors believe that this horizon cannot be considered an impeding layer (i.e. a horizon with
a low ks value), which can determine waterlogging conditions. By comparing the ks values obtained in the laboratory (this study) and those measured in the field (De Vita
et al., 2007) on the same soil horizons (horizons Bw, 2CB
Solid Earth, 6, 783–797, 2015
794
S. Vingiani et al.: Volcanic soils and landslides: a case study of the island of Ischia
and 2C correspond to B, C1 and C2 in De Vita et al., 2007),
the following were observed: (i) generally lower values of ks
measured in the field (1 × 10⁻² cm s−1 measured for B and
1 × 10⁻⁵ cm s−1 for 2C) than those measured in the laboratory (see Table 4), but (ii) consistent trends between the laboratory and field data, both characterised by decreasing values
with depth. It has been shown (Eching et al., 1994; Rockhold
et al., 1996; Basile, 2004, unpublished data, among others)
that laboratory-determined ks values can be 1 or more orders of magnitude greater than those measured in the field.
Therefore, if we look only at the field data, the very low ks
values really indicate 2C as an impeding layer, but this contrasts with what was reported above from the evaluation of
the laboratory ks measurements. The results of the micromorphological analyses enable us to clarify this apparent inconsistency. Indeed, the occurrence of a thin (6.5 mm) slightly
porous layer, which consists of finely stratified ashes, at the
2CB/2C interface in P2 very likely represents an obstacle
to vertical and horizontal water fluxes, favouring (possibly
temporary) waterlogging and hydromorphic conditions, as
shown by the hydromorphic features (e.g. Fe / Mn concretions) found on top of and within the layer. The 2CB horizon
is interpreted as the upper part of 2C reworked by pedofauna
activity. Due to the very low thickness, the authors suppose
that the stratified layer was not sampled for the hydrological laboratory measurements and therefore did not affect the
results.
The presence of clay coatings in the pore spaces of 2CB
and 2C probably increased the waterlogging conditions created by the thin ash layer above 2C because the swelling
clay particles, which expand during hydration, could also reduce the pore space for water fluxes. This process is certainly
aided by the occurrence of Na, which has been found in the
whole profile but increases with depth, because this cation
causes clay hydration and deflocculation, which worsen the
soil’s physical properties (Basile et al., 2012). However, despite the fact that Na content is higher than 15 % in the
deepest horizons of the three profiles, these horizons lack
the requirements of salic or natric horizons (IUSS Working Group WRB, 2014) in terms of electrical conductivity
(EC < 15 dS m−1 ), soil structure and texture. The origin of
the Na in these soils is probably related to the alkaline trachytic composition of the volcanic ash (Vezzoli, 1988).
4.2
Comparison between soils from Ischia and
elsewhere in Campania that were affected by
debris-mudflows
Despite the common landforms (high gradient north-facing
slope), similar forestry (mixed chestnut woodland: coppice),
volcanic origin of the parent material, and the same movement types of the triggered landslides, the results of this
study indicate significant differences in terms of particular properties between the soils from Mt. Vezzi (MV) and
elsewhere in Campania (CA) that were commonly involved
Solid Earth, 6, 783–797, 2015
in debris-mudflows (Terribile et al., 2000, 2007; Basile et
al., 2003). Indeed, as a whole, both MV and CA are characterised by shallow surface horizons, which store the most
OC content of these soils (49–71 and 28–98 g kg−1 , respectively), and thick deep horizons, which generally show lower
OC content in MV than in CA (2.3–12.3 and 2.2–32.7 g kg−1 ,
respectively). Similar soil reactions (pH ranging between
6.0 and 7.6 in MV and between 6.5 and 8.3 in CA) and
comparable saturated water content (0.56–0.64 and 0.50–
0.75 cm3 cm−3 in MV and CA, respectively) are found in
both soil groups, along with saturated hydraulic conductivity, which is generally high and decreases with depth. The
saturated water content of both MV and CA is indicative of
a complex porous system, similar to that shown by the Andosols, which are well known for their high water retention
capacity (Basile et al., 2007). In spite of that, a remarkable
difference between MV and CA occurs in terms of andic
properties: the former soils do not exhibit andic properties,
whereas the latter are well developed Andosols. As a consequence, thixotropy is absent from MV but well developed in
CA, which is consistent with the development of andic properties.
As stated above, both MV and CA developed in very similar environments, in terms of geomorphological factors, land
use and parent material.
Regarding the time of pedogenesis, two main causes increase the difficulty of dating the soil: (i) certain chronological references (e.g. identified volcanological markers) are
not available for all the studied Campania soils (Terribile
et al., 2007) and (ii) erosion/deposition processes frequently
occur on these high gradient slopes. Moreover, soil rejuvenation problems could also be verified for sites where volcanological markers are recognised along the soil profiles.
Indeed, in the case of MV, where the Piano Liguori formation
(5.3–5.8 kyrs BP) was identified at the bottom of the soil, the
more recent Cretaio Tephra (first–second century AD) might
have arrived in the area (De Vita et al., 2010), rejuvenating
the soils. In the case of Sarno and Quindici, the markers of
the Vesuvius Pomici di Avellino eruption (dated 3.9 kyrs by
Mastrolorenzo et al., 2006), found on the slopes (Di Vito et
al., 2008) and along the soil profile (Terribile et al., 2000),
could represent a chronological constraint for dating these
soils. Nevertheless, as reported by Zanchetta et al. (2004),
the markers of more recent Vesuvius eruptions (such as Pollena AD 472) have reached many slopes along Campania’s
reliefs and could have affected the pedogenesis.
Concerning the climate, the average yearly rainfall between 1960 and 1990 (data from ISPRA SINTAI, 2005)
shows that Ischia (Ischia Ponte Pilastri station registered an
average annual rainfall of 850 mm) is drier compared to the
inland areas of the Campania region (Montevergine station
registered an average annual rainfall of 1857 mm). Therefore,
the difference in the andic properties within these soils is predominantly due to the climatic conditions of the pedogenetic
www.solid-earth.net/6/783/2015/
S. Vingiani et al.: Volcanic soils and landslides: a case study of the island of Ischia
environments, which are known to strongly affect andosolisation processes (Shoji et al., 1993).
Therefore, the occurrence of debris and mudflows in “nonandic” soils, such as those of MV, enables us to give additional and stronger relevance, in terms of the predisposing
factor to the occurrence of landslides, to abrupt spatial variability in the soil’s (physical) properties, even at a microscopic level.
5
Conclusions
The soil study carried out at Mt. Vezzi enabled us to identify generally young and deep volcanic soils that show vitric
properties but not andic properties. The latter were widely
found in soils involved in other debris-mudflows in Campania (Terribile et al., 2007).
Therefore, the results suggest a more complex relationship
between soil properties and debris-mudflows in the region
and underline the role played by the vertical variability of
the soil properties as an environmental predisposing factor to
landslide phenomena. Specifically, a significant discontinuity was identified at Mt. Vezzi over various depths (70/90–
190 cm) at the interface of the B and 2C horizons, in terms of
the physical (i.e. different particle size distribution, pore size
and connected porosity, anisotropy of hydraulic conductivity), chemical (i.e. Na enriched deep horizon) and mineralogical (i.e. swelling clays only in the deep horizons) properties.
Moreover, the identification of a thin, finely stratified ashy
layer above 2C by means of optical microscopy emphasised
the role of 2C as an impeding layer and predisposing factor to landslides. Indeed, under heavy rainfall or prolonged
phases of light rainfall, this layer further reduces vertical water fluxes and leads to an increase in soil water storage in the
overlying soil horizons, increasing the instability along the
slope because of the higher soil weight.
According to the observations on the Mt. Vezzi landscape
and other debris-mudflows in Campania, these are very fragile ecosystems due to frequent human disturbances, including soil mantle cutting for trackways and the unplanned cutting of woodlands, which could increase the water stored in
the profile from approximately 30–45 % (Basile et al., 2003).
Therefore, further investigations on the spatial distribution of
both (i) the high soil thickness above the “impeding layers”
and (ii) road cut/naturally steep walls are needed to identify
the “highest risk areas” for landslides and to safeguard these
precious (e.g. in terms of biomass production) and highly
vulnerable forest ecosystems.
Author contributions. S. Vingiani, R. De Mascellis and F. Terribile sampled the soils in the landslide detachment crowns. S. Vingiani designed the experiments and carried out the chemical and
the mineralogical analyses. S. Vingiani and F. Terribile analysed
thin soil sections by means of the micromorphological methodologies. A. Basile and R. De Mascellis designed and performed particle
www.solid-earth.net/6/783/2015/
795
size distribution and hydrological measurements. G. Mele planned
and carried out the microtomographic analyses. S. Vingiani and
A. Basile prepared the manuscript with contributions from all the
co-authors.
Acknowledgements. The authors thank Luciana Minieri (Department of Agriculture, University of Naples Federico II) and Nadia
Orefice (CNR ISAFOM, Ercolano NA) for the measurement of
some chemical and physical soil properties.
Edited by: P. Pereira
References
Arya, L. M.: Wind and hot-air methods, in: Methods of Soil Analysis. Part 4. Physical Methods, SSSA Book Series 5, SSSA, Madison, 916–926, 2002.
Ascione, A., Cinque, A., Franza, A., and Romano, P.: The geomorphic control on the initiation and propagation of the Mt. Vezzi
landslides (Ischia island, Italy) occurred on 30th April 2006, Italian Journal of Engineering Geology and Environment, 2, 93–118,
2007.
Bascomb, C. L.: Distribution of pyrophosphate extractable iron and
organic carbons in soils of various groups, J. Soil Sci., 19, 251–
268, 1968.
Basile, A., Mele, G., and Terribile, F.: Soil hydraulic behaviour
of a selected benchmark soil involved in the landslide of Sarno
1998, Geoderma, 117, 331–346, 2003.
Basile, A., Coppola, A., De Mascellis, R., and Randazzo, L.: Scaling approach to deduce field unsaturated hydraulic properties and
behavior from laboratory measurements on small cores, Vadose
Zone J., 5, 1005–1016, 2006.
Basile, A., Coppola, A., De Mascellis, R., Mele, G., and Terribile,
F.: A comparative analysis of the pore system in volcanic soils by
means of water-retention measurements and image analysis, in:
Soils of Volcanic Regions in Europe, Springer, Berlin, 493–513,
2007
Basile, A., Buttafuoco, G., Mele, G., and Tedeschi, A.: Complementary techniques to assess physical properties of a fine soil
irrigated with saline water, Environmental Earth Sciences, 66,
1797–1807, 2012.
Blakemore, L. C., Searle, P. L., and Daly, B. K.: Methods for Chemical Analysis of Soils, New Zealand Soil Bureau scientific report 80, NZ Soil Bureau, Department of Scientific and Industrial
Research, Lower Hutt, 1987.
Blazejewski, G. A., Stolt, M. H., Gold, A. J., and Groffman, P. M.:
Macro- and micromorphology of subsurface carbon in riparian
zone soils, Soil Sci. Soc. Am. J., 69, 1320–1329, 2005.
Bonfante, A., Basile, A., Acutis, M., Perego, A., and Terribile, F.:
SWAP, CropSyst and MACRO comparison in two contrasting
soils cropped with maize in Northern Italy, Agr. Water Manage.,
97, 1051–1062, 2010.
Bullock, P., Fedoroff, N., Jongerius A., Stoops, G., Tursina, T., and
Babel, U.: Handbook for Soil Thin Section Description. Waine
Research Publications, Wolverhampton, UK, 152 pp., 1985.
Solid Earth, 6, 783–797, 2015
796
S. Vingiani et al.: Volcanic soils and landslides: a case study of the island of Ischia
Childs, C. W.: Towards understanding soil mineralogy. II: Notes on
ferrihydrite, NZ Soil Bureau Laboratory Report CM7, NZ Soil
Bureau, Lower Hutt, New Zealand, 16 pp., 1985.
Civetta, L., Gallo, G., and Orsi, G.: Sr- and Nd-isotope and traceelement constraints on the chemical evolution of the magmatic
system of Ischia (Italy) in the last 55 Ka, J. Volcanol. Geoth. Res.,
46, 213–244, 1991.
Coppola, A., Basile, A., Comegna, A., and Lamaddalena, N.: Monte
Carlo analysis of field water flow comparing uni-and bimodal effective hydraulic parameters for structured soil, J. Contam. Hydrol., 104, 153–165, 2009.
Cruden, D. M. and Varnes, D. J.: Landslides types and processes,
in: Landslides: Investigation and Mitigation, Special Report
247, Transportation Research Board, National Research Council,
edited by: Turner, A. K. and Schuster, R. J., National Academy
Press, Washington, DC, 36–75, 1996.
De Vita, P., Di Clemente, E., Rolandi, M., and Celico, P.: Engineering geological models of the initial landslides occurred on April
30th 2006, at the Mount di Vezzi (Ischia island, Italy), Italian
Journal of Engineering Geology and Environment, 2, 119–141,
2007.
De Vita, S., Sansivero, F., Orsi, G., Marotta, E., and Piochi, M.:
Volcanological and structural evolution of the Ischia resurgent
caldera (Italy) over the past 10 ka, in: Stratigraphy and Geology
in Volcanic Areas, edited by: Groppelli, G. and Viereck, L., Geological Society of America Book Series, Special Paper 464, 193–
239, 2010.
di Gennaro, A. and Terribile, F.: I suoli della provincia di Napoli,
Carta 1 : 75.000 e Legenda, Ge.PRO.TER., SELCA, Firenze, 1–
63, 1999.
di Gennaro, A., Aronne, G., De Mascellis, R., Vingiani, S., Sarnataro, M., and Cona, F.: I sistemi di Terre della Campania,
Risorsa s.r.l., SELCA, Firenze, 1–63, 2002.
Di Nocera, S., Matano, F., Rolandi, G., and Rolandi, R.: Contributo
sugli aspetti geologici e vulcanologici di Monte di Vezzi (Isola
d’Ischia) per lo studio degli eventi franosi dell’aprile 2006, Italian Journal of Engineerig Geology and Environment, 2, 27–50,
2007.
Di Vito, M. A., Sulpizio, R., Zanchetta, G., and D’Orazio, M.: The
late Pleistocene pyroclastic deposits of the Campanian Plain: new
insights into the explosive activity of Neapolitan Volcanoes, J.
Volcanol. Geoth. Res., 177, 19–48, 2008.
Eching, S. O., Hopmans, J. W., and Wallender, W. W: Estimation of
in situ unsaturated soil hydraulic functions from scaled cumulative drainage data, Water Resour. Res., 30, 2387–2394, 1994.
FAO: Guidelines for Soil Profile Description, 3rd Edn., Soil Resources Management and Conservation Service, Land and Water
Development Division, FAO, Rome, revised, 1990.
Fields, M. and Parrott., K. W.: The nature of allophane in soils. III.
Rapid field and laboratory test for allophane, New Zeal. J. Sci.,
9, 623–629, 1966.
FitzPatrick, E. A.: Micromorphology of Soils, Chapman and Hall,
London, 433 pp., 1984.
FitzPatrick, E. A.: Soil Microscopy and Micromorphology, Wiley,
West Sussex, England, 304 pp., 1993.
Glendon, G. W. and Dani, O.: 2.4 Particle-size analysis, in: Methods of soil analysis, edited by: Dane, J. H. and Topp, G. C.,
Part 4, Physical Methods, 255–293, Madison, Wisconsin, USA,
Soil Science Society of America, Inc., 2002.
Solid Earth, 6, 783–797, 2015
Guzzetti, F. and Tonelli, G.: Information system on hydrological
and geomorphological catastrophes in Italy (SICI): a tool for
managing landslide and flood hazards, Nat. Hazards Earth Syst.
Sci., 4, 213–232, doi:10.5194/nhess-4-213-2004, 2004.
Guzzetti, F., Cardinali, M., and Reichenbach, P.: The AVI Project:
a bibliographical and archive inventory of landslides and floods
in Italy, Environ. Manage., 18, 623–633, 1994.
Horgan, G. W.: Mathematical morphology for analysing soil structure from images, Eur. J. Soil Sci., 49, 161–173, 1998.
Hungr, O., Evans, S. G., Bovis, M. J., and Hutchinson, J. N.: A review of the classification of landslides of the flow type, Environ.
Eng. Geosci., 7, 221–238, 2001.
ISPRA – SINTAI: Progetto Annali, Banca dati, available at: http:
//www.acq.isprambiente.it/annalipdf/, last access: 19 December
2014, 2005.
IUSS Working Group WRB: World Reference Base for Soil Resources 2014, International soil classification system for naming
soils andcreating legends for soil map, World Soil Resources Reports No. 106., FAO, Rome, 2014
Jurin, J.: An account of some experiments shown before the Royal
Society; with an enquiry into the cause of the ascent and suspension of water in capillary tubes, Philos. T. R. Soc. Lond., 30,
739–747, 1718.
Kak, A. C. and Slaney, M.: Principles of Computerized Tomographic Imaging, IEEE Press, Piscataway, NJ, 1988.
Kutilek, M. and Nielsen, D. R.: Soil Hydrology, Catena Verlag,
Geoscience Publication, Cremlingen Destedt, Germany, 370 pp.,
1994.
Lantuejoul, C. and Maisonneuve, F.: Geodesic methods in quantitative image analysis, Pattern Recogn., 17, 177–187, 1984.
La Stampa: Il Paese con più catastrofi in Europa,
Oltre 2 mila morti negli ultimi 50 anni, available at:
http://geomorphology.irpi.cnr.it/media/2014/
(last
access:
19 December 2014), 2014.
Lesch, S. M. and Suarez, D. L.: A short note on calculating the
adjusted SAR index, T. ASABE, 52, 493–496, 2009.
Mastrolorenzo, G., Petrone, P., Pappalardo, L., and Sheridan, M.:
The Avellino 3780-yr-B.P. catastrophe as a worst-case scenario
for a future eruption at Vesuvius, P. Natl, Acad. Sci. USA, 103,
4366–4370, 2006.
Mazzarella, A. and De Luise, E.: The meteoric event of 30th
April 2006 at Ischia island, Italy, Italian Journal of Engineering
Geology and Environment, 2, 7–14, 2007.
Mehlich, A.: Use of triethanolamine acetate-barium hydroxide
buffer for the determination of some base exchange properties
and lime requirement of soil, Soil Sci. Soc. Am. Pro., 29, 374–
378, 1938.
Mehra, O. P. and Jackson, M. L.: Iron oxide removal from soils and
clays by a dithionite-citrate system buffered with sodium bicarbonate, Clay. Clay Miner., 7, 317–327, 1960.
Orsi, G., de Vita, S., and Di Vito, M.: The restless, resurgent Campi
Flegrei nested caldera (Italy): constraints on its evolution and
configuration, J. Volcanol. Geoth. Res., 74, 179–214, 1996.
Parfitt, R. L.: Allophane in New Zealand – a review, Aust. J. Soil
Res., 28, 343–360, 1990.
Parfitt, R. L. and Wilson, A. D.: Estimation of allophane and halloysite in three sequences of volcanic soils, New Zealand, in:
Volcanic Soils: Weathering and Landscape Relationships of Soils
www.solid-earth.net/6/783/2015/
S. Vingiani et al.: Volcanic soils and landslides: a case study of the island of Ischia
on Tephra and Basalt, Catena Suppl. 7, Catena Verlag, Cremlingen, Germany, 1–8, 1985.
Reynolds, W. D. and Elrick, D. E.: The soil solution phase. Falling
head soil core (tank) method, in: Methods of Soil Analysis,
edited by: Dane, J. H. and Topp, G. C., SSSA Book Ser., vol. 5.,
809–812, SSSA, Madison, WI, USA, 2003.
Rittmann, A. and Gottini, V.: L’Isola d’Ischia – geologia, Boll. Serv.
Geol. Ital., 101, 131–274, 1980.
Schwertmann, U.: Differenzierung der Eisenoxide des Bodens
durch photochemische Extraktion mit saurer Ammoniumoxalatlosung, Lösung, Z. Pflanzenernähr. Düng. Bodenkde., 105, 194–
202, 1964.
Serra, J.: Image Analysis and Mathematical Morphology, Academic
Press, London, 1982.
Shoji, S., Dahlgren, R., and Nanzyo, M.: Genesis of volcanic ash
soils, in: Volcanic Ash Soils. Genesis, Properties and Utilization.
Developments in Soil Science, 21, 37–71, Elsevier, Amsterdam,
London, New York, Tokyo, 1993.
SSS (Soil Survey Staff): Kellogg Soil Survey Laboratory Methods
Manual, Soil Survey Investigations Report No. 42, Version 5.0,
edited by: Burt, R. and Soil Survey Staff, U.S. Department of
Agriculture, Natural Resources Conservation Service, Lincoln,
Nebraska, 2014.
Stolt, M. H. and Lindbo, D. L.: Soil organic matter, in: Interpretation of Micromorphological Features of Soils and Regoliths,
edited by: Stoops, G., Marcelino, V., and Mees, F., Elsevier, Amsterdam, 369–396, 2010.
Stoops, G.: Guidelines for Analysis and Description of Soil and Regolith Thin Sections, Soil Science Society of America, Madison,
Wisconsin, 184 pp., 2003.
www.solid-earth.net/6/783/2015/
797
Terribile, F., Basile, A., De Mascellis, R., Di Gennaro, A., Mele,
G., and Vingiani, S.: I suoli delle aree di crisi di Quindici e
Sarno: proprietà e comportamenti in relazione ai fenomeni franosi, Quaderni di Geologia Applicata, 7, 59–79, 2000.
Terribile, F., Basile, A., De Mascellis, R., Iamarino, M., Magliulo,
P., Pepe, S., and Vingiani, S.: Landslide processes and andosols:
the case study of the Campania region, Italy, in: Soils of Volcanic Regions in Europe: Volcanic Soils and Land Use, edited
by: Arnalds, Ó., Bartoli, F., Buurman, P., Óskarsson, H., Stoops,
G., García-Rodeja, E., Springer, Berlin, Heidelberg, New York,
545–563, 2007.
Vezzoli, L.: Island of Ischia, in: Quaderni de la “Ricerca Scientifica”, Consiglio Nazionale delle Ricerche (CNR), Roma 1988,
P.F.G., 114, 51–72, 1988.
Vingiani, S. and Terribile, F.: Soils of the detachment crowns of Ischia landslides, Italian Journal of Engineering Geology and Environment, 2, 51–63, 2007.
Walkley, A. and Black, I. A.: An examination of the Degtjareff
method for determining organic carbon in soils: effect of variations in digestion conditions and of inorganic soil constituents,
Soil Sci., 63, 251–263, 1934.
Watson, K. K.: An instantaneous profile method for determining
the hydraulic conductivity of unsaturated porous materials, Water
Resour. Res., 2, 709–715, 1966.
Wells, N. and Furkert, R. J.: Bonding of water to allophane, Soil
Sci., 113, 110–115, 1972.
Zanchetta, G., Sulpizio, R., and Di Vito, M. A.: The role of volcanic
activity and climate in alluvial fan growth at volcanic areas: an
example from southern Campania (Italy), Sediment. Geol., 168,
249–280, 2004.
Solid Earth, 6, 783–797, 2015
© Copyright 2026 Paperzz