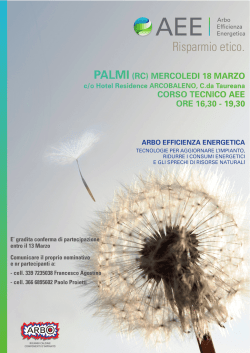
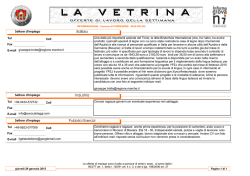
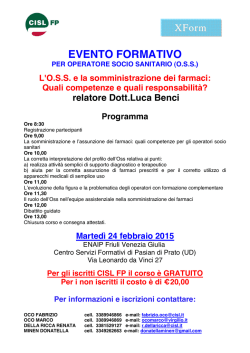
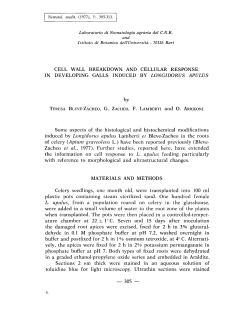
Apoptosis
C 2005 Springer Science + Business Media, Inc. Manufactured in The United States.
DOI: 10.1007/s10495-005-3346-1
Cellular and molecular effects of protons: Apoptosis
induction and potential implications for cancer therapy
C. Di Pietro∗ , S. Piro∗ , G. Tabbı̀, M. Ragusa, V. Di Pietro, V. Zimmitti, F. Cuda, M. Anello, U. Consoli, E.
T. Salinaro, M. Caruso, C. Vancheri, N. Crimi, M. G. Sabini, G. A. P. Cirrone, L. Raffaele, G. Privitera, A.
Pulvirenti, R. Giugno, A. Ferro, G. Cuttone, S. Lo Nigro, R. Purrello, F. Purrello† and M. Purrello
Dipartimento di Scienze Biomediche, Sezione di Biologia, Genetica e Bioinformatica, Università di Catania, 95123 Catania,
Italy (C. Di Pietro, M. Ragusa, V. Di Pietro, V. Zimmitti, F. Cuda, A. Pulvirenti, R. Giugno, A. Ferro, M. Purrello );
Dipartimento di Medicina Interna e Medicina Specialistica, Sezione di Endocrinologia, Università di Catania, Ospedale
Garibaldi, 95124 Catania, Italy (S. Piro, M. Anello, F. Purrello); Istituto di Biostrutture e Bioimmagini, CNR, 95125 Catania,
Italy (G. Tabbı̀); Dipartimento di Scienze Biomediche, Sezione di Ematologia, Università di Catania, 95124 Catania, Italy
(U. Consoli); Dipartimento di Medicina Interna e Medicina Specialistica, Sezione di Malattie Respiratorie, Università di
Catania, 95125 Catania, Italy (E. T. Salinaro, M. Caruso, C. Vancheri, N. Crimi); Istituto Nazionale di Fisica Nucleare,
Laboratorio Nazionale del Sud, 95125 Catania, Italy (M. G. Sabini, G. A. P. Cirrone, L. Raffaele, G. Cuttone);
Dipartimento di Diagnostica per Immagini e Radioterapia, Università di Catania, 95125 Catania, Italy (G. Privitera);
Dipartimento di Matematica ed Informatica, Università di Catania, 95125 Catania, Italy (A. Pulvirenti, R. Giugno);
Dipartimento di Fisica e di Astronomia, Università di Catania, 95125 Catania, Italy (S. Lo Nigro); Dipartimento di Scienze
Chimiche, Università di Catania, 95125 Catania, Italy (R. Purrello)
Published online: 20 December 2005
Due to their ballistic precision, apoptosis induction by
protons could be a strategy to specifically eliminate
neoplastic cells. To characterize the cellular and molecular
effects of these hadrons, we performed dose-response and
time-course experiments by exposing different cell lines
(PC3, Ca301D, MCF7) to increasing doses of protons and
examining them with FACS, RT-PCR, and electron spin resonance (ESR). Irradiation with a dose of 10 Gy of a 26,7 Mev
proton beam altered cell structures such as membranes,
caused DNA double strand breaks, and significantly
increased intracellular levels of hydroxyl ions, are active
oxygen species (ROS). This modified the transcriptome of
irradiated cells, activated the mitochondrial (intrinsic) pathway of apoptosis, and resulted in cycle arrest at the G2/M
boundary. The number of necrotic cells within the irradiated
cell population did not significantly increase with respect
to the controls. The effects of irradiation with 20 Gy were
qualitatively as well as quantitatively similar, but exposure
to 40 Gy caused massive necrosis. Similar experiments with
photons demonstrated that they induce apoptosis in a significantly lower number of cells and in a temporally delayed
manner. These data advance our knowledge on the cellular
and molecular effects of proton irradiation and could be
useful for improving current hadrontherapy protocols.
Key words: apoptosis; cancer; cell cycle; FACS; hadrontherapy;
proton beam; RT-PCR.
∗ Equal
contribution
† Current
address: Unità Operativa di Medicina Interna, Ospedale Cannizzaro,
95125 Catania, Italy
Correspondence to: M. Purrello,
Dipartimento di Scienze
Biomediche, Sezione di Biologia, Genetica e Bioinformatica, Università di Catania, 95123 Catania, Italy. Tel.: +39-95-3782078;
Fax: +39-95-3782158; e-mail: [email protected]
Introduction
Cell death may occur through different mechanisms:
apoptosis, necrosis, autophagy, senescence, and mitotic
catastrophe.1 The pathways leading to apoptosis and necrosis are quite well known, whereas those of autophagy, senescence and mitotic catastrophe are still poorly characterized.1
Apoptosis, the process responsible for the physiological
elimination of cells during development, differentiation and
at steady state, may be defined as a clean type of cell death.
Contrary to necrotic cells, which are lysed with ensuing
diffusion of inflammatory molecules, apoptotic cells activate pathways leading to their suicide and then undergo
macrophage phagocytosis.2–5 The different phases of the
apoptotic process (initiation, progression, and conclusion)
are carried out by a complex apparatus, which has been
well conserved during evolution6 (Purrello et al., unpublished observations). Initiation is controlled by a set of
proteins many of which belong to the bcl-2 supergroup,
even though they may have opposite functions: the bcl2 protein and members of its family are anti-apoptotic,
whereas bax-α and related polypeptides are pro-apoptotic.
The stoichiometric and functional equilibrium between
the two groups determines the cell’s fate.7–9 The apoptotic apparatus is functionally connected to other cell machineries, such as those controlling cell cycle and DNA
duplication,10 cell proliferation and differentiation,11,12
genome stability,13,14 and cell metabolism.15–17 Accordingly, apoptosis may be considered an integral part of the
biological program of all known organisms.18–20 The increased knowledge of its molecular mechanisms21 could
allow for the exploitation of apoptosis for innovative
Apoptosis
C. Di Pietro et al.
approaches in cancer therapy. A general and effective strategy
could entail the specific induction of suicide in neoplastic
cells, while sparing healthy ones. One way to obtain this
would be to expose solid tumors to appropriately low doses
of highly focused ionizing radiations (IR), such as protons,
with the objective of specifically inducing apoptosis in cancer cells. In this paper we report the results of a series of
experiments aimed at characterizing the cellular and molecular effects of protons on different cell lines (PC3, Ca301D,
MCF7), irradiated with increasing doses of protons and examined with FACS, RT-PCR, and electron spin resonance
(ESR).
Materials and methods
Cell lines and culture conditions
PC3 and MCF7 cell lines derived from a bone metastasis
of a prostate adenocarcinoma and from a mammary adenocarcinoma, respectively, were obtained from the American
Tissue Type Culture Collection (Rockville, MD). Ca301D
cells were isolated from a papillomatous carcinoma of the
thyroid at the Sezione di Endocrinologia of the Dipartimento di Medicina Interna e Medicina Specialistica of the
Università di Catania (Italy). Three days before irradiation,
cell lines were plated in 25 cm2 tissue culture flasks, which
on the day of treatment were filled with medium and exposed to single doses of protons or photons ranging from 5
to 40 Gy. Each treated sample was matched with untreated
controls.
protocol,24 in comparison with a farmer cylindrical reference ionization chamber with a known cavity gas calibration
factor. This had been determined in a secondary accredited
calibration laboratory (PTW, Freiburg). The Markus chamber was compared with the reference ionization chambers
of the Paul Scherrer Institute (Switzerland) and the Clatterbridge Center for Oncology (United Kingdom) in clinical
proton dosimetry.25 The same chamber was also used for
depth dose measurements in a tissue equivalent medium.
Given that the main radiobiological and clinical differences
between X-rays and protons arise in the energy region below 30 MeV, where the RBE of protons is strongly increased,
we concentrated our attention to this range. This was also
based on the consideration that proton beams are completely
stopped within the target, so that independently of the beam
delivering system (active, spot scanning, passive scattering)
a considerable quantity of protons with energy lower than
30 MeV will hit it. In most experiments the dose rate used
was 1.46 Gy/min. After examining carefully that the corresponding biological effects were undistinguishable, in some
experiments (e.g., irradiation with 40 Gy) we used the dose
rate of 7.3 Gy/min. Treatment with 5, 10, 20, and 40 Gy of
5 MeV photons was performed with a Linac ORION apparatus (General Electric) at the Dipartimento di Diagnostica
per Immagini e Radioterapia (Università di Catania, Italy),
according to standard procedures. Photons (2 Gy/min) were
emitted from a source that was 100 cm from the flask. Irradiations were performed at isocenter (100 cm) with a field
size of 10 × 10 cm and lateral uniformity of ±3%.
Irradiation of cells with protons and photons
Cell population dynamics and detection
of apoptosis or necrosis
Proton irradiation was carried out at the Laboratori Nazionali del Sud (LNS) (Catania, Italy) of the Istituto Nazionale di
Fisica Nucleare (INFN), using a Tandem Accelerator with
a maximum accelerating voltage of 15 MV. In the experimental setup, a 26.7 MeV proton beam was delivered by the
accelerator with a 190 µM thick gold scattering foil. The
beam was extracted in air through the beamline exit window made of 75 µM thick aluminum. To match the shape
of the tissue culture flasks, a collimator defining the boundaries of the irradiation field was mounted just in front of the
target, which was suspended at 60 cm from the exit window. Dosimetry was carried out at 1 mm Perspex-equivalent
depth, corresponding to the cell layer surface on the flask
bottom. Accordingly, no dose correction had to be applied.
The beam homogeneity was checked with radiographic films
at different depths in PMMA phantom and found to be
±1%, as previously reported.22 Lateral uniformity of proton
fluency at the target was almost 100%. Energy at the target was 22.6 MeV although there was some energy spread
due to straggling.23 Reference dosimetry was based on a
parallel-plate Markus ionization chamber, calibrated with
a high-energy electron beam according to the IAEA 381
At each time point after irradiation, irradiated cells and corresponding controls were collected (Figure 1a and b). To
detect apoptosis or necrosis and to determine DNA content
and the position of cells within the cell cycle, one aliquot
was used for counting with standard microscopy methods,
another for analysis with a FACS. Due to the inversion of
cell membranes with externalization of phosphatydilserine,
a phenomenon that is a well-known marker of apoptosis,
Annexin V-FITC binds to it causing the apoptotic cell to
emit fluorescence. Propidium Iodine enters necrotic cells,
binds to their DNA and stains it. Cell fluorescence was
assessed through a Flow Cytometer Coulter Epics Elite ESP
(Coulter Corporation, Miami, FL, USA) by following standard procedures with an Annexin V-FITC Apoptosis Detection Kit (Sigma). Cells were gently scraped off the flasks,
fixed by slow addition of absolute ethanol, left at −20◦ C for
16 h, centrifuged at 800 g for 10 min, washed once, resuspended with 500 µl of PBS containing RNAse 100 ngr/ml,
incubated for 1 h at 20◦ C, centrifuged at 800 g for 10
min, resuspended with 500 µl of PBS with BSA 1% and PI
50 µgr/ml, incubated for 15 min in the dark and examined
with FACS. At least 10,000 forward side scatter gated events
Apoptosis
Biological effects of protons
Figure 1. Kinetics and extent of apoptosis induction in PC3 cells after irradiation with 10 Gy (panel a) and 20 Gy (panel b) of protons and
photons, as determined through the annexin test and FACS analysis. Statistical analysis was performed by quadratic regression. Necrosis of
PC3 and CA301D cells following exposure to 40 Gy of protons as determined through the annexin test and FACS analysis (panel c).
were collected per specimen. Identical procedures were performed on untreated controls. In many experiments, after
incubation with annexin and PI, cells were also counted and
analyzed with an inverted fluorescence microscope (Olympus IX 70), equipped with a dual filter set for FITC and
rhodamine. The data obtained through either FACS or fluorescence microscope analysis were comparable. Cytoplas-
mic chromatin fragments, whose presence is another well
known marker of apoptosis, were quantified with the Cell
Death Detection ELISA PlusTM Kit (Roche Germany) according to the manufacturer’s protocol. The amount of nucleosomes was determined photometrically by measuring
the peroxidase retained in the immunocomplex. Cell viability and mitochondrial function were determined using
Apoptosis
C. Di Pietro et al.
Table 1.
RT-PCR primers
Gene
Accession
number
Primers
cDNA
(bp)
Forward
start
Reverse
start
PCR conditions
ATM
NM 000051 5 TGCTAACTGTGAGAAAGTTGC3
5 AAAGACTCTGTTCCATTGAGG3
407 bp
2071
2477
94◦ C 4 min; (94◦ C 60 sec, 51◦ C
90 sec, 72◦ C 120 sec)24x;
72◦ C 10 min;
p53
NM 000546 5 CCTGCCCTCAACAAGATGTTTTG3
5 TCAAAGCTGTTCCGTCCCAG3
431 bp
633
1063
94◦ C 4 min; (94◦ C 60 sec, 60◦ C
90 sec, 72◦ C 120 sec)21x;
72◦ C 10 min;
p73
NM 005427 5 TGTCATCCCCTCCAACACC3
5 TTCATGCCCCCTACACAGC3
462 bp
449
62
94◦ C 4 min; (94◦ C 60 sec, 57◦ C
90 sec, 72◦ C 120 sec)30x;
72◦ C 10 min;
p63
NM 003722 5 GATGCTCTCTCTCCATCACC 3
5 CCAGCACACTCTGTCTTCC 3
394 bp
352
745
94◦ C 4 min; (94◦ C 60 sec, 54◦ C
90 sec, 72◦ C 120 sec)27x;
72◦ C 10 min;
p21
NM 000389 5 GGAACTTCGACTTTGTCACCGAG3
5 GAACCTCTCATTCAACCGCCTAG3
561 bp
240
800
94◦ C 4 min; (94◦ C 60 sec, 57◦ C
90 sec, 72◦ C 120 sec)25x;
72◦ C 10 min;
Bax
L22473
365 bp
166
530
94◦ C 4 min; (94◦ C 60 sec, 61◦ C
90 sec, 72◦ C 120 sec)27x;
72◦ C 10 min;
Bad
NM 032989 5 CCTTTAAGAAGGGACTTCCTCG3
5 AAACCCAAAACTTCCGATGG3
334 bp
371
704
94◦ C 4 min; (94◦ C 60 sec, 56◦ C
90 sec, 72◦ C 120 sec)25x;
72◦ C 10 min;
Bak
NM 001188 5 CACCAAGATTGCCACCAGC3
5 CCTGCAAGGGAACAGAGAAGG3
387 bp
533
919
94◦ C 4 min; (94◦ C 60 sec, 56◦ C
90 sec, 72◦ C 120 sec)25x;
72◦ C 10 min;
Bcl-2
M14745
5 CCACCAAGAAAGCAGGAAACC3
5 ACAAAACCCCACAGCAAAAGG3
400 bp
3118
3517
94◦ C 4 min; (94◦ C 60 sec, 59◦ C
90 sec, 72◦ C 120 sec)29x;
72◦ C 10 min;
Bcl-XL
Z23115
5 GAATCACTAACCAGAGACG 3
5 GGAAGAGTTCATTCACTACC 3
476 bp
53
528
94◦ C 4 min; (94◦ C 60 sec, 49◦ C
90 sec, 72◦ C 120 sec)22x;
72◦ C 10 min;
SOD2
NM 000636 5 ACCACGATCGTTATGCTGAG3
5 GGACTAGAAAGGCATCCCTACA3
304 bp
674
977
94◦ C 4 min; (94◦ C 60 sec, 50◦ C
90 sec, 72◦ C 120 sec)25x;
72◦ C 10 min;
HPRT
NM 000194 5 CCTGCTGGATTACATTAAAGCACTG3
5 CTTCGTGGGGTCCTTTTCACCAGC3
282 bp
316
597
94◦ C 4 min; (94◦ C 60 sec, 60◦ C
90 sec, 72◦ C 120 sec)22x;
72◦ C 10 min;
β Actin
NM 001101 5 GCCAACCGTGAAAAGATGACC3
5 TGCCGATAGTGATGACCTGACC3
415 bp
340
754
94◦ C 4 min; (94◦ C 60 sec, 60◦ C
90 sec, 72◦ C 120 sec)18x;
72◦ C 10 min;
5 ACCAAGAAGCTGAGCGAGTGTC3
5 ACAAAGATGGTCACGGTCTGCC3
the 3-(4,5-dimethylthiazol-2-yl)-2,5-diphenyl tetrazolium
bromide (MTT) assay that measures the cleavage of tetrazolium salts. Absorbance was measured at 545 nm using a
690 nm differential filter.
RT-PCR
RT-PCR analysis was performed as previously
described.26–28 Primers for genes involved in apoptosis initiation, progression, conclusion, and in cell cycle
control were designed with the program OMIGA (Oxford
Molecular) using as template the cDNA segments shared
by all known mRNA isoforms of the genes analyzed
(Table 1). Total RNA was extracted with Trizol (Invitrogen)
Apoptosis
from treated cells and untreated controls after scraping them
off the flasks. This procedure was chosen to avoid damaging
cell membranes with trypsin and the ensuing artifacts.
Purity of RNA preparations and absence of contamination
with DNA were confirmed by checking that the size of the
amplified cDNAs was as expected and by performing PCR
without the reverse transcription step. Reverse transcription
of total RNA was performed for 1 h at 42◦ C using 1 µg of
total RNA, 500 ng of oligo dT primers (Roche Molecular
Biochemicals), and 200 U of Superscript II Reverse Transcriptase in a total volume of 20 µl of 1 × First Strand Buffer
(Invitrogen). Different aliquots were amplified with 1U
of Taq Platinum polymerase (Invitrogen) to determine the
range of linearity between the amount of amplified cDNAs
Biological effects of protons
and the mass of target mRNAs. Normalization was obtained
by loading in the same gel well the cDNAs under study,
together with control HPRT or β-actin cDNAs. These
had been independently amplified from an identical aliquot
of the same sample. Gel electrophoresis was performed in
1.5% agarose at 10 V/cm for 60 min. Gene specific cDNA
quantification was repeated at least twice on each sample,
with very similar results. Densitometric analysis was performed with an Image Master VDS using Total Lab software
(Amersham Pharmacia Biotech, Little Chalfornt, UK).
Figure 2. Kinetics and extent of apoptosis induction, as determined
through the annexin test and FACS analysis, in PC3, Ca301D, and
MCF7 cells treated with a 10 Gy proton beam. The graphs show the
trend of values at the different time points chosen for the analysis.
Electron spin resonance
ESR spectroscopic measurements were carried out as described on a Bruker ER 200 D spectrometer, driven by
an ESP 3220 Data System and equipped with an NMR
gaussmeter.29 Spin trapping data were recorded at room
temperature in a standard flat quartz cell. ESR spectra
were simulated using the PEST Winsim program.30 5,5Dimethyl-1-pyrroline N-oxide (DMPO) (Sigma) was used
after vacuum distillation to remove orange paramagnetic
impurities, which are present in commercial samples. The
flasks containing the cell cultures (irradiated or controls)
were emptied, cell layers were rinsed twice with 1 ml
of unused culture medium; 1 ml of fresh medium, and
6.7 µl of DMPO (final concentration 58 mM) were then
added and left for 10 min at 20◦ C. Cells were scraped
off and centrifuged at 800 g for 10 min at 4◦ C. The
pellet was resuspended in 0.3 ml of medium and transferred to a flat quartz cell. To ascertain if reactive oxygen
species (ROS) had been produced intracellularly, the cell
pellet obtained from two 25 cm2 flasks was resuspended in
0.4 ml of medium, homogenized manually by using a 0.5
ml glass homogenizer, and 2.7 µl of DMPO were added
to the resulting homogenate, which was examined by ESR.
The minimal amount of ROS that could be detected in our
assay was 0.05 µM.
Statistical analysis
Statistical analysis was performed by quadratic regression
of the set of points in the time series given by the degree
of apoptosis and by the level of expression of key proteins
of the apoptotic machinery.31,32 The regression parabolas
approximate the general behaviour of the variables under
analysis and allow a comprehensive global view of them.
Results
Proton induced apoptosis and cell cycle block
A dose-response study performed with Annexin V-FITC
and FACS demonstrated that exposure to 5 Gy, 10 Gy,
and 20 Gy of protons induced apoptosis in 6.1%, 15.8%,
and 17.50% of PC3 cells, respectively (Figures 1a and
b). Control cultures showed only background levels of
apoptosis ( >0.5%). The number of necrotic cells was
similar in the two groups (0.5% ± 0.2% and 0.6% ±
0.4%, respectively). A dramatic change was seen after a
single 40 Gy dose, which caused massive necrosis within
48 h of irradiation (Figure 1C). In CA301D cells 10 Gy of
protons was the most effective dose as 10.5% of irradiated
cells underwent apoptosis 24 h after irradiation (Figure 2).
A time course-analysis demonstrated that after a single
irradiation with 10 Gy of protons the percentage of apoptotic PC3 cells reached it speak 8 h after irradiation, whereas
in CA301D cultures this occurred 24 h after treatment with
the same dose of protons (Figure 2). Finally, 4.8% of MCF7
cells underwent apoptosis within 72 h following irradiation
with 10 Gy of protons. The default value of apoptosis for
the three cell lines didn’t change significantly during the
experiment (Figure 2). Also, the number of necrotic cells
in CA301D and MCF7 cell lines remained at background
levels after treatment. Cytoplasmic chromatin fragments
were significantly increased in PC3 cells 8 h after irradiation
with 10 Gy, in comparison to control cells (1.95 ± 0.7 OD
vs 0.42 ± 0.1 OD, mean ± ES; n = 5; p > 0.001). The
number of metabolically active PC3 cells, as determined
through the MTT assay, was significantly reduced after
exposure to IR. This difference was present up to 48 h after
treatment. Besides inducing apoptosis, irradiation with 10
Gy of protons also blocked PC3 cells at the G2/M interface
(Figure 3a). This clearly altered the kinetics of the cell population growth, leading to a 2.3 fold cell number difference
between control and treated samples 72 h after IR exposure
(Figure 3b). A similar effect was caused by a dose of 20 Gy
(Figure 3c). Exposure of CA301D cells to a 10 Gy proton
beam also induced a cycle block at the G2/M interface, as
already demonstrated for PC3 cells (not shown).
Apoptosis
C. Di Pietro et al.
Figure 3. Panel a. FACS analysis of PC3 cells exposed to 10 Gy of protons, demonstrating their block at the G2/M phase of the cell cycle.
Panels b and c. Kinetics of PC3 cell population growth after exposure to 10 and 20 Gy of protons. C: control samples; T: treated samples. N
= 5; p < 0.001.
Effects of protons on the expression of mRNAs
involved in the apoptotic process
Irradiation with 10 Gy of protons clearly altered the PC3,
CA301D, and MCF7 mRNA phenotype at the different loci
involved in apoptosis initiation, progression, conclusion, and
cycle control. In PC3 cells 8 h after treatment when the
number of cells with structural signs of apoptosis reached
its peak (Figures 1a, 2), we detected a 2.1 fold increase of
ATM mRNA, a 6.1 fold increase of p73 mRNA, and a 9.3
Apoptosis
fold increase of p21 mRNA relative to controls (Figure 4a).
At 10 h there was an 11 times increase of the Bcl-2/Bax-α
ratio (Figure 4b). These changes were followed by an increase
of SOD2 mRNA that reached its peak (three times higher
than in controls) 24 h after irradiation (Figure 4a). There
was no variation of the levels of mRNAs encoding Bad and
Bak, two pro-apoptotic genes of the Bcl-2 family. Due to
nonsense-mediated mRNA decay, no p53 mRNA may be
detected in PC3 cells.33,34 When apoptosis of 10 Gy treated
CA301D cells reached its maximum, 24 h after irradiation
Biological effects of protons
Figure 4. mRNA phenotype variation in PC3 and in CA301D cells at the loci encoding ATM, p73, p21, and SOD2 after irradiation with a 10
Gy proton beam (panels a, c). Kinetics of the Bcl2/Bax-α ratio in PC3 cells (panel b) and of BclXL /Baxα in CA301D cells (panel d).
(Figure 2), the levels of the mRNAs encoding ATM, p53,
and p21 were 2.8, 1.4, and 12 times higher than the controls
(Figure 4c). At the disappearance of the morpho-structural
signs of apoptosis, 48 h after irradiation, there was a 6.1
times increase of Bcl-XL mRNA with a corresponding 2.9
times rise of its ratio over bax-α (Figure 4d). At the same
time, SOD2 mRNA was 6.7 times more abundant in irradiated cells than in controls (Figure 4c). Due to nonsensemediated mRNA decay, p73 mRNA is undetectable in
CA301D cells (see above). In MCF7 cells, 72 h after treatment, the levels of Bcl-2 and Bax-α mRNAs were 2.5 and
7.8 times higher than the controls. 24 h later, Bcl-2 levels
increased 1.95 times, and Bax-α levels increased 5 times,
with their ratio becoming 2 from the previous value of 1.5
(data not shown).
Apoptosis induction by photons and corresponding
variations of the transcriptome
In contrast to protons, photons induced apoptosis in the
PC3 cell line to a clearly lower extent and with an evident
temporal delay at the doses of 10 and 20 Gy (Figures 1a-b).
The peak of apoptosis, 3.5% and 6% of the treated cell
population, was reached 48 h after irradiation with a single
dose of either 10 or 20 Gy (Figure 1a-b). There was a 1.6 fold
increase of Bax-α mRNA at 8 h after irradiation, together
with a 1.6 times increase of ATM mRNA followed by a 2.9
fold increase of Bcl-2 mRNA 2 h later. The Bcl-2/Bax-α
ratio became 2.5 times higher than the controls 10 h after
exposure to photons (data not shown). As already seen with
protons, irradiation with 40 Gy of photons caused massive
necrosis of treated cells (not shown).
Effects of protons on ROS intracellular
concentration
To investigate whether irradiation with protons determined
ROS production, we carried out spin trapping experiments.
PC3 cells were exposed to 5, 10, and 20 Gy of protons
and their ESR spectra were measured at 6 and 24 h after
irradiation. Several spectra were recorded on samples
irradiated with 10 Gy of protons. Measurements using
whole cells showed that neither the cell suspension nor the
medium had any trapped radical adduct, both at 6 and 24 h
after irradiation (data not shown). Instead, the homogenate
from cells analyzed 24 h after irradiation with 10 Gy clearly
showed the hydroxyl radical adduct pattern, aN = 14.9
G; aH = 14.9 G, which was not detected in homogenized
control cells nor in medium from irradiated and control
cultures (Figure 5a–d). Based on an accurate calibration
curve, we estimated that the concentration of hydroxyl ions
Apoptosis
C. Di Pietro et al.
Figure 5. ESR spectra of samples, 24 h after irradiation, containing 58 mM DMPO and (a) homogenized irradiated PC3 cells; (b) homogenized
control PC3 cells; (c) medium from irradiated PC3 cells; (d) medium from control PC3 cells. The pattern shown in (a) arises from the hyperfine
coupling constant values, which a repeculiar characteristics of the hydroxyl adduct with DMPO. The 1:2:2:1 ESR signal intensity of the quartet
pattern comes from the perfect superimposition of two lines of two triplets due to the identity of the two hyperfine coupling constants aH and
aN . The simulated spectrum (dotted line) was obtained using aH = 14.9 G, aN = 14.9 G. Instrument settings: modulation frequency, 100 kHz;
modulation amplitude, 0.7 G; receiver gain 8 × 10⁴ ; time constant, 81 ms; sweep rate, 285 G/min; microwave frequency, 9.77 GHz; microwave
power, 40 mW, 30 scans. (e) Graph showing the relationship between the levels of hydroxyl ions and SOD2 mRNA.
was 0.3 µM. No signal was found in the lysate from PC3
cells irradiated with 5 and 20 Gy and analyzed 24 and 6 h
after treatment, respectively. Detection of hydroxyl radicals
coincided with a significant increase of SOD2 mRNA levels
(Figure 5e).
Discussion
Due to its incidence, fatalities, and the annual financial toll,
it is generally agreed that cancer is the major medical problem of western societies.35,36 Distinct strategies have been
designed for its treatment, such as surgery, radiotherapy,37
chemotherapy,38 and more recently, immunotherapy.39,40 It
has been also suggested that exploitation of a biological
phenomenon, such as apoptosis, could be an additional therapeutic strategy.41,42 This would be especially true if cell suicide could be induced by factors endowed with high target
specificity. This specificity could be molecular by employing antibodies against tumor-specific antigens,39 or spatial,
if irradiation were performed with particles characterized
by high ballistic precision such as protons, which produce
little side scatter and stop abruptly at any prescribed depth
Apoptosis
(Bragg peak), allowing the precise delivery of large doses of
particles to irregular three-dimensional volumes.43,44 The
data presented in this paper demonstrate that irradiation
with 10 Gy of protons specifically induced apoptosis, but
not necrosis, in a fraction of cells ranging from 15.8% (PC3)
to 10.5% (CA301D) and 4.8% (MCF7). This was proven
by the presence of different markers of cell suicide such as
externalization of phosphatidylserine, release of chromatin
fragments in the cytoplasm, and specific transcriptome modifications. The effects of irradiation with 20 Gy of protons
were qualitatively as well as quantitatively similar to those
of 10 Gy (Figures 1a and b), which suggests a plateau effect
for these hadrons. We didn’t observe a similar phenomenon
with photons, at least within the dose range examined (Figures 1a and b). On the other hand, irradiation with 40 Gy
of either protons or photons caused massive necrosis (Figure 1c). Proton irradiation also caused a block of PC3 and
CA301D cell cycles at the G2/M interface. Our characterization of the mRNA phenotype of proton irradiated PC3,
CA301D, MCF7 cells demonstrated induction of the cell
cycle checkpoint ATM gene and of its downstream targets,
such as p53 or members of its family (e.g., p73), p21, and
bax-α.45–48 The ensuing modifications of the cell phenotype
Biological effects of protons
comprised alteration of mitochondrial functions and oxidative metabolism with overproduction of hydroxyl ions (a
ROS) in PC3 cells, as well as damage to nucleic acids and
membrane phospholipids.49 The increase of SOD2 mRNA
levels, shown in Figure 5, represents the reaction of cells to
the deleterious effects of ROS on their structure.50–52 Our
data clearly demonstrate the presence of hydroxyl ions in
irradiated cells at a concentration of 0.3 µM with an estimated increase of sixty times over the minimum threshold
level of 0.05 µM (see Materials and Methods and Results).
The absence of hydroxyl radicals 24 h after irradiation with
5 Gy of protons suggests that their amount was below the
threshold detection level. On the other hand, we hypothesize that the 6 h interval between treatment with 20 Gy
and analysis was too short for the production of detectable
amounts of ROS. Altogether, our results strongly suggest
a major involvement of the mitochondrial (intrinsic) cell
death pathway in the response to proton irradiation.2,52–54
These data significantly advance the existing knowledge on
the biological effects of these hadrons. In fact, a previously
published study examined cell viability after proton irradiation using only a clonogenic assay.55 In another report
on the effects of proton irradiation, activation of apoptosis in thyroid follicular cells was investigated by searching
for different markers such as cytoplasmic DNA fragments
and micronuclei.56 These authors also reported a block of
cell cycle at the G2 phase but didn’t describe modifications
of the mRNA phenotype nor the increase of ROS induced
by proton irradiation.56 It is interesting to note that also
gamma irradiation of CCRF-CEM, a human lymphoblastic
leukemia cell line, has been reported to induce arrest at the
G2/M phase of the cycle.57
Conclusions
When analyzed in the context of the existing literature, our
data demonstrate that their specific phenotypes and genotypes are important for the response of cells to irradiation. In
fact, the tendency of a cell to undergo cycle block and eventually apoptosis depends on its genotype and RNA and protein
phenotype at the loci involved in cycle control, DNA repair,
and apoptosis activation. Magnitude, kinetics, and specific
sequence of events are expected to vary between different cell
types (e.g., Figure 4a and 4c). Due to the well known variety of tumor genotypes and corresponding phenotypes,58
this heterogeneity should be expected to be even more frequent in therapeutic settings. This clearly implies the need
for treatment protocols designed for the specific tumor type
or, even better, for the specific individual as required in the
world of Molecular Medicine.59 In this context, the characterization of the cellular and molecular response to proton
irradiation of the most frequent tumour types will be useful
to allow for a rational design of treatment protocols. The
worldwide increase of the number of cancer patients treated
with hadrontherapy as well as of the number of hadronther-
apy centers under construction60 warrant further studies to
elucidate the cellular and molecular effects of proton irradiation and the underlying mechanisms.
Acknowledgments
We thank Prof R Vigneri for the generous gift of cell
line CA301D, Prof R Giustolisi for kindly allowing us to
perform some of the experiments with the FACS instrument
at the Sezione di Ematologia, Dipartimento di Scienze
Biomediche, Università di Catania. We also thank Drs D
Barbagallo, M Caruso, F Frasca, P Lo Iacona, E Modica,
G Pandini, V Patti, D Spampinato, A Valastro, and Mr
R Russo for their kind collaboration. Finally, we thank
Dr G Scacciante (Amersham Pharmacia) for his very kind
help. This project was supported by funds from MIUR
(Ministero dell’Istruzione, dell’Università e della Ricerca),
Piani di Potenziamento della Rete Scientifica e Tecnologica.
These data were presented as an oral presentation at the
5th International Symposium on Swift Heavy Ions in
Matter, Taormina (Italy), May 22–25, 2002 and at the
International Symposium on Impact of Biotechnology on
Predictive Oncology and Intervention Strategies, Nice
(France), February 7–10, 2004.
References
1. Okada H, Mak TW. Pathways of apoptotic and non-apoptotic
death in tumour cells. Nature Rev Cancer 2004; 4: 592–
603.
2. Kerr JFR, Harman BV. Definition and incidence of apoptosis.
In: Tomei LD, Cope FO, eds. Apoptosis, the Molecular Bases of
Cell Death, Cold Spring Harbor Laboratory Press 1991: 5–
29.
3. Hengartner MO. The biochemistry of apoptosis. Nature 2000;
407: 770–776.
4. Meier P, Finch A, Evan G. Apoptosis in development. Nature
2000; 407: 796–801.
5. Savill J, Fadok V. Corpse cleaning defines the meaning of cell
death. Nature 2000; 407: 784–788.
6. Aravind L, Dixit VM, Koonin EV. Apoptotic molecular machinery: Vastly increased complexity in vertebrates revealed by
genome comparisons. Science 2001; 291: 1279–1284.
7. Adams JM, Cory S. The Bcl-2 protein family: Arbiters of cell
survival. Science 1998; 281: 1322–1326.
8. Korsmeyer SJ. Bcl-2 gene family and the regulation of
programmed cell death. Cancer Res 1999; 59: 1693s–1700s.
9. Cory S, Adams JM. The Bcl-2 family: Regulators of the cellular
life-or-death switch. Nature Rev Cancer 2002; 2: 647–656.
10. Murray AW, Marks D. Can sequencing shed light on cell cycling?
Nature 2001; 409: 844–846.
11. Evan G, Littlewood TA. A matter of life and death. Science 1998;
281: 1317–1321.
12. Evan GI, Vousden KH. Proliferation, cell cycle and apoptosis in
cancer. Nature 2001; 411: 342–348.
13. Hoeijmakers JH. Genome maintenance mechanisms for
preventing cancer. Nature 2000; 411: 366–374.
14. Wood RD, Mitchell M, Sgouros J, Lindahl T. Human DNA
repair genes. Science 2001; 291: 1284–1289.
Apoptosis
C. Di Pietro et al.
15. Saraste M. Oxidative phosphorylation at the fin de siecle. Science
1999; 283: 1488–1492.
16. Martinou JC, Green DR. Breaking the mitochondrial barrier.
Nature Rev 2001; 283: 63–67.
17. Zamzani N, Kroemer G. The mitochondrion in apoptosis. Nature
Rev 2001; 2: 67–71.
18. Michaelson J. The significance of cell death. In: Tomei LD and
Cope FO, eds. Apoptosis, the Molecular Bases of Cell Death. Cold
Spring Harbor Laboratory Press 1991: 31–46.
19. Lockshin RA, Zakeri Z. Programmed cell death and apoptosis.
In: Tomei LD, Cope FO, eds. Apoptosis, the Molecular Bases of Cell
Death. Cold Spring Harbor Laboratory Press 1991: 47–60.
20. Koonin EV, Aravind L. Origin and evolution of eukaryotic apoptosis: The bacterial connection. Cell Death Diff 2002; 9: 394–404.
21. Proceedings of the Meeting Apoptosis: From signaling pathways to
therapeutic tools. http://www.transduction-meeting.lu 2003.
22. Onori S, De Angelis C, Fattibene P, et al. Dosimetric
characterization of silicon and diamond detectors in low
energy proton beams. Phys Med Biol 2000; 45: 3045–
3058.
23. Raffaele L, Cuttone G, Barone Tonghi L. Use of 70 MeV proton
beam for medical application at INFN—LNS. Proceedings of the
International Conference on Nuclear Data, ISFN, Trieste, 1997;
1668–1673.
24. IAEA, Technical Reports Series, IAEA, Vienna 1997: 381.
25. Cuttone G, Raffaele L, Barone Tonghi L. First dosimetry
intercomparison results for the CATANA Project. Phys Med
1999; 15: 121–130.
26. Purrello M, Scalia M, Corsaro C, Di Pietro C, Piro S, Sichel
G. Melanosynthesis, differentiation and apoptosis in Kupffer
cells from Rana esculenta. Pigment Cell Res 2001; 14: 126–
131.
27. Purrello M, Di Pietro C, Rapisarda A, et al. Genes for
human general transcription initiation factors TFIIIB,
TFIIIB-Associated Proteins, TFIIIC2, and PTF/SNAPC:
Functional and positional candidates for tumour predisposition or inherited genetic diseases? Oncogene 2001; 20: 4877–
4883.
28. Piro S, Patanè G, Di Pietro C, et al. Exposure to FFA or to high
levels of glucose increases apoptosis in rat pancreatic islets cells.
Metabolism 2002; 51: 1340–1347.
29. Tabbı̀ G, Fry SC, Bonomo RP. ESR study of non-enzymic
scission of xyloglucan by an ascorbate—H2 O2 - copper system:
The involvement of the hydroxyl radical and the degradation of
ascorbate. J Inorg Biochem 2001; 84: 179–187.
30. Duling DR. Simulation of multiple isotropic spin trap EPR
spectra. J Magn Res 1994; 104: 105–110.
31. Cramer H. Mathematical Methods of Statistics. Princeton University
Press, Princeton, USA 1946.
32. Dudewicz EJ, Mishra SN. Modern Mathematical Statistics, Wiley
New York, USA 1988.
33. Hamid T, Kakar SS. PTTG/securin activates expression of p53
and modulates its function. Mol Cancer 2004; 3: 18.
34. Neu-Yilik G, Gehring NH, Hentze MW, Kulozik AE. Nonsensemediated mRNA decay: From vacuum cleaner to Swiss army
knife. Genome Biol 2004; 5: 218.
35. Peto J. Cancer epidemiology in the last century and the next
decade. Nature 2001; 411: 390–395.
36. American Cancer Society. Cancer Facts and Figures
http://www.cancer.org. 2002.
37. Lewanski CR, Gullick WJ. Radiotherapy and cellular signalling.
The Lancet Oncol 2001; 2: 366–370.
Apoptosis
38. Johnstone RW, Ruefli AA, Lowe SW. Apoptosis: A link between
cancer genetics and chemotherapy. Cell 2002; 108: 153–164.
39. Rosenberg SA. Progress in human tumour immunology and
immunotherapy. Nature 2000; 411: 380–384.
40. Appelbaum FR. Haematopoietic cell transplantation as
immunotherapy. Nature 2000; 411: 385–389.
41. Nicholson DW. From bench to clinic with apoptosis based
therapeutic agents. Nature 2000; 407: 810–816.
42. Tamm I, Schriever F, Dorken B. Apoptosis: Implications of basic
research for clinical oncology. The Lancet Oncol. 2001; 2: 33–42.
43. Hug FB, Nevinny-Stickel M, Fuss M, Miller DW, Shaefer RA,
Slater JD. Conformal proton radiation treatment for retroperitoneal neuroblastoma: Introduction of a novel technique. Med
Ped Oncol 2001; 37: 36–41.
44. Noel G, Habrand JL, Helfre S, et al. Proton beam therapy in the
management of central nervous system tumors in childhood: The
preliminary experience of the Centre de Protontherapie d’Orsay.
Med Ped Oncol 2003; 40: 309–315.
45. Polyak K, Xia Y, Zweier JL, Kinzler KW, Vogelstein B. A model
for p53 induced apoptosis. Nature 1997; 389: 300–306.
46. Carr AM. Piecing together the p53 puzzle. Science 2000; 287:
1765–1766.
47. Flores ER, Tsai KY, Crowley D, et al. p63 and p73 are required
for p53—dependent apoptosis in response to DNA damage.
Nature 2000; 416: 560–564.
48. Vogelstein B, Lane D, Levine AJ. Surfing the p53 network.
Nature 2000; 408: 307–310.
49. Khan AUK, Wilson T. Reactive oxygen species as cellular
messengers. Curr Biol 1995; 2: 437–445.
50. Motoori S, Majima HJ, Ebara M, et al. Overexpression of
mitochondrial Manganese Superoxide Dismutase protects
against radiation induced cell death in the human hepatocellular carcinoma cell line HLE. Cancer Res 2001; 61: 5382–
5388.
51. Epperly MW, Sikora CA, De Filippi SJ, et al. Manganese superoxide dismutase (SOD2) inhibits radiation induced apoptosis
by stabilization of the mitochondrial membrane. Rad Res 2002;
157: 568–577.
52. Kroemer G, Zamzami N, Susin SA. Mitochondrial control of
apoptosis. Immun Today 1997; 18: 44–51.
53. Rich T, Allen RL, Wyllie AH. Defying death after DNA damage.
Nature 2000; 407: 777–781.
54. Li L, Story M, Legerski RJ. Cellular responses to ionizing radiation
damage. Int J Rad Oncol Biol Phys 2001; 49: 1157–1162.
55. Belli M, Bettega D, Calzolari P, et al. Inactivation of human
normal and tumour cells irradiated with low energy protons. Int
J Radiat Biol 2000; 76: 831–839.
56. Green LM, Murray DK, Tran DT, et al. Response of thyroid
follicular cells to gamma irradiation compared to proton
irradiation. I. Initial characterization of DNA damage, micronucleus formation, apoptosis, cell survival, and cell cycle phase
redistribution. Radiat Res 2001; 155: 32–42.
57. Strasser-Wozak EMC, Hartmann BL, Geley S, et al. Irradiation induces G2/M cell cycle arrest and apoptosis in
p53-deficient lymphoblastic leukaemia cells without affecting
Bcl-2 and Bax expression. Cell Death Diff 1998; 5: 687–
693.
58. Ponder BA. Cancer Genet. Nature 2001; 411: 336–341.
59. Tate SK, Goldstein DB. Will tomorrow’s medicines work for
everyone? Nature Genet 2004; 36: 34–42.
60. Amaldi U. Future trends in cancer therapy with particle
accelerators. Z Med Phys 2004; 14: 7–16.
© Copyright 2026 Paperzz