Chem 420/523 Chemical Thermodynamics
Homework Assignment # 6
1. * Solid monoclinic sulfur (Sα ) spontaneously converts to solid rhombic sulfur (Sβ ) at 298.15 K and 0.101
MPa pressure. For the conversion process (we designate monoclinic as the “α” form and rhombic as the
“β” form for convenience):
Sα (298.15K, 0.101MPa) → Sβ (298.15K, 0.101MPa),
calculate (a) ∆trans Sm , (b) ∆trans Hm ,and (c) ∆trans Gm , given
◦
=22.59 J K−1 mol−1 for rhombic sulfur
Cp,m(β)
◦
Cp,m(α)
=23.64 J K−1 mol−1 for monoclinic sulfur
∆trans H ◦ =397.9 J mol−1
for the transition of rhombic sulfur to monoclinic sulfur at the reversible transition temperature of 368.60
K and 0.101 MPa.
Answer
Note that the ∆trans H ◦ given is ∆βα H ◦ ,where β is the initial state and α is the final state:
Sβ (298.15 K,0.101 MPa) → Sα (298.15 K,0.101 MPa).
Therefore, for the transition of monoclinic (α) to rhombic (β), ∆αβ H ◦ = −397.9 J mol−1 . Also, we
◦
◦
− Cp,m(α)
, i.e., final state − initial state.
denote ∆αβ Cp◦ = Cp,m(β)
(a) At 368.60 K and the standard pressure of 0.101 MPa, the two forms of sulfur are in equilibrium (the
◦ = ∆ H ◦ /368.6 K = −1.0789
transition is reversible) and, therefore, ∆αβ G◦ = 0. Therefore, ∆αβ Sm
αβ
J K−1 mol−1 . At 298.15 K,
◦
∆αβ Sm =∆αβ Sm
+
298.15
Z K
368.60 K
∆αβ Cp◦
dT
T
=−1.0789 J K−1 mol−1 + (22.59 − 23.64) J K−1 mol−1 × ln
=−0.8562 J K−1 mol−1
µ
298.15
368.60
(b) Similarly,
◦
∆αβ Hm =∆αβ Hm
+
298.15
Z K
∆αβ Cp◦ dT
368.60 K
−1
=−397.9 J mol + (22.59 − 23.64) J K−1 mol−1 × (298.15 − 368.60) K
=−323.9 J mol−1
(c) From the entropy and enthalpy for the transition, we get
∆αβ Gm =∆αβ Hm − T ∆αβ Sm
=−68.62 J mol−1
The negative value for ∆αβ Gm is consistent with the fact that the transition is spontaneous at this
temperature.
1
2. The vapor pressures of solid and liquid hydrogen cyanide in the appropriate temperature ranges are given,
in Clausius-Clapeyron form, by
4252.4
T
3345.8
liquid :ln p/(kPa) = 15.818 −
T
solid : ln p(kPa) = 19.489 −
(a)
(b)
(c)
(d)
(e)
Find
Find
Find
Find
Find
the
the
the
the
the
molar enthalpy of sublimation for HCN.
molar enthalpy of vaporization for HCN.
molar enthalpy of fusion for HCN.
triple point temperature and pressure.
normal boiling point of HCN.
Answer:
∆H
+ c, we get ∆sub H from the expression for the vapor
(a) Since the Clausius-Clapeyron form is ln p = −
RT
pressure of the solid:
∆sub H = 4252.4R
= 35, 357 J mol−1
(b) The enthalpy of vaporization is obtained from the expression for the vapor pressure of the liquid:
∆vap H = 3345.8R
= 27, 819 J mol−1
(c) The enthalpy of fusion is calculated by recognizing that enthalpies are state functions and, therefore,
∆sub H = ∆f us H + ∆vap H. Therefore,
∆f us H = ∆sub H − ∆vap H
= 7, 538.0 J mol−1
(d) At the triple point, the solid and liquid lines intersect. Therefore,
19.489 −
3345.8
4252.4
= 15.818 −
.
T
T
Solving for the triple point temperatrure, we get T = 246.96 K. Substituting the temperature back into
one of the equations, we get
3345.8
246.96
= 2.2701
ln p/(kPa) = 15.818 −
Therefore, p = 9.6804 kPa.
(e) The normal boiling point corresponds to the temperature at which p = 101 kPa (or 0.101 MPa or 1.01
bar = 1 atm):
T =
−3345.8
ln(101) − 15.818
= 298.66 K.
2
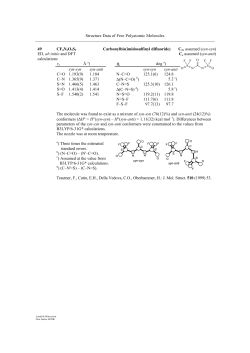
3. Given below are the total vapor pressures for {(x1 or y1 )n-C6 H14 + (x2 or y2 )c-C6 H12 } at T = 308.15
K, where x is the mole fraction in the liquid phase and y is the mole fraction in the vapor phase.
See p. 429 of text for data
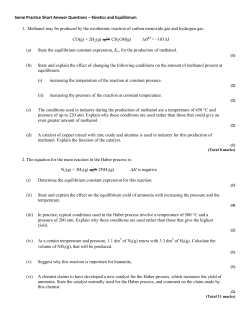
(a) Make a graph of x2 against p, p1 and p2 , where p1 and p2 are the vapor pressures of the individual
components. For comparison, include on the graph, the ideal solution predictions for p, p1 and p2 .
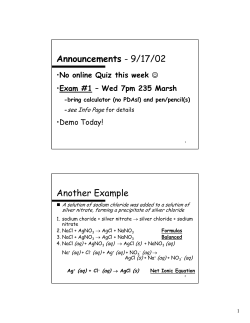
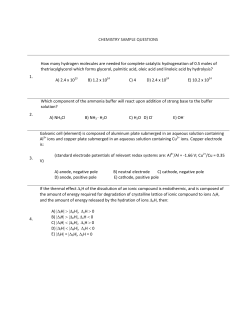
(b) Construct the (vapor + liquid) phase diagram at T = 308.15 K, by making a graph of p against x2 and
against y2 . Label all regions of the phase diagram.
Answer:
(a) The figure is shown below. The solid lines represent actual data and the dashed lines are the ideal solution
predictions.
Vapor-pressure vs. mole fraction
35.0
30.0
p/(kPa)
25.0
20.0
15.0
10.0
5.0
0.0
0.00
0.20
0.40
0.60
0.80
1.00
x2
(b) The phase diagram is shown below.
Liquid + Vapor Phase Diagram
32.0
Liquid
30.0
p(kPa)
28.0
Bubble point line
26.0
Liquid+Vapor
Dew-point line
24.0
22.0
20.0
0.00
Vapor
0.20
0.40
0.60
x2
3
0.80
1.00
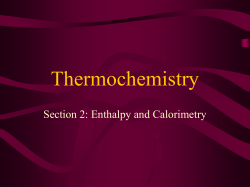
4. * Given below are the boiling temperatures of {(x1 or y1 )CHCl3 + (x2 or y2 )(CH3 )2 CO} at p = 0.101
MPa, where x is the mole fraction in the liquid phase and y is the mole fraction in the vapor phase.
See p. 429 of text for data
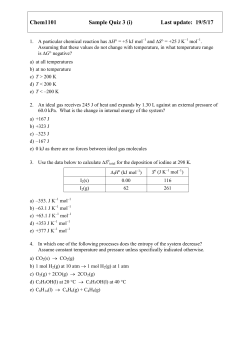
(a) Construct (vapor + liquid) phase diagram. The system has a maximum boiling azeotrope. Label all regions
in the diagram with phases present. Estimate from the phase diagram, the temperature and composition
of this azeotrope.
(b) An x2 = 0.80 liquid mixture is heated at p = 101 MPa. Use the diagram to estimate (i) the temperature
at which the liquid will start to boil, (ii) the temperature at which the last drop of liquid evaporates, (iii)
the temperature where 50 mol% of liquid is left in the pot.
Answer
(a) The boiling point diagram is shown below.
Boiling point diagram
337
Vapor
336
335
Liquid + Vapor
T/K
334
333
332
331
330
Liquid
329
328
0.00
0.20
0.40
0.60
0.80
1.00
x2 , y 2
The azeotropic composition is estimated to be (x2 = y2 , T ) = (0.33, 336.4 K).
(b) (i) The liquid starts to boil at 331.50 K.
(ii) Since the vapor that forms at 331.5 K from a liquid mixture with x2 = 0.80 will be richer in component
2, the liquid composition will move towards the azeotrope. Therefore, the temperature as the last drop of
liquid evaporates will be equal to that at the azeotropic composition, i.e., 336.4 K.
(iii) The tempearture corresponding to x2 = 0.50 is 335.7 K.
4
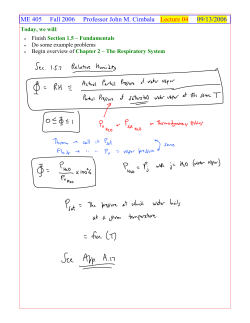
5. The following cooling curve data for the Magnesium-Copper system are given:
Wt % Mg
First break (◦ C)
Eutectic Halt (◦ C)
5
900
680
10
702
680
15
785
680
20
765
560
30
636
560
35
565
560
40
581
560
45
575
360
50
546
360
60
448
360
70
423
360
80
525
360
90
600
360
Pure copper melts at 1085 ◦ C while pure magnesium melts at 659 ◦ C. Two compounds are formed, one
at 16.05 wt % Mg with a melting point of 800 ◦ C, and another at 43.44 wt % Mg with a melting point
of 583 ◦ C, respectively.
(a) Construct the phase diagram and identify the compositions of the eutectics.
(b) What are the empirical formulae of the two compounds?
Answer
(a) The phase diagram is shown below.
Mg-Cu Phase Diagram
1100
1000
t (°C)
900
800
700
600
500
400
300
0
20
40
60
80
100
Wt % Mg
The eutectics, as best as can be determined from the given data, appear to be at 9.5 wt % Mg, 34 wt %
Mg, and 65 wt % Mg.
(b) Compound 1 corresponds to 16.05 wt % Mg. In other words, 100 g of compound will contain 16.05 g
Mg and 83.95 g Cu. The Mg : Cu ratio is
83.95 g Cu
16.05 g Mg
:
= 0.660 mol Mg : 1.321 mol Cu
−1
24.305 g mol
63.546 g mol−1
=1.000 mol Mg : 2.002 mol Cu
Therefore, the formula of Compound 1 is MgCu2 .
Compound 2 corresponds to 43.44 wt % Mg. In other words, 100 g of compound will contain 43.44 g
Mg and 56.56 g Cu. The Mg : Cu ratio is
43.44 g Mg
56.56 g Cu
:
= 1.787 mol Mg : 0.890 mol Cu
−1
24.305 g mol
63.546 g mol−1
=2.008 mol Mg : 1.000 mol Cu
Therefore, the formula of Compound 2 is Mg2 Cu.
5
6. Construct the ternary phase diagram for the NiSO4 -H2 SO4 -H2 O system from the data given in problem
7.29 of Physical Chemistry by Alberty & Silbey.
Answer:
The phase diagram is shown below. The various hydrated forms of NiSO4 appear along the base of the
triangle (the NiSO4 -H2 O side) since these solids do not contain any H2 SO4 .
NiSO4-H2SO4-H2O System
H2SO4
20
80
60
40
60
40
2O
H
40
4 .7
4 .6
H
2O
20
Ni
SO
Ni
SO
NiSO4
20
Ni
SO
4 .H
2O
80
6
60
80
H2O
© Copyright 2026 Paperzz