The use of edge habitats
by commuting and foraging bats
0000 0872 4102
Promotor:
Co-promotor:
dr. H.H.T. Prins,
hoogleraar in het natuurbeheer in
de tropen en ecologie van vertebraten
dr. J. Veen,
senioronderzoeker dierecologie,
DLO-Instituut voor Bos- en Natuuronderzoek
The use of edge habitats
by commuting and foraging bats
B. Verboom
PROEFSCHRIFT
ter verkrijging van de graad van doctor
op gezag van de rector magnificus
van de Landbouwuniversiteit Wageningen,
dr. C.M. Karssen,
in het openbaar te verdedigen
op dinsdag 21 april 1998
des namiddags te vier uur in de Aula.
ISBN 90-5485-838-9
Van dit proefschrift is ook een editie verschenen als Scientific Contribution 10 bij het
DLO-Instituut voor Bos- en Natuuronderzoek onder ISBN 90-76095-03-5.
BIBLIOTHEEK
LANDBOUWUNIVERSITEIT
WAGENINGEN
MAJo?2o| ,£V ^
THE
USE
OF
EDGE
HABITATS
BY
C O M M U T I N G
«NO
FORAGING
»ATS
/
STELLINGEN
1. Een netwerk van opgaande vegetatieranden, zoals bosranden, houtwallen
en bomenrijen, is van cruciaal belang voor het voortbestaan van populaties
van de meeste in Nederland voorkomende vleermuizensoorten in agrarische
gebieden.
2. Vleermuizen onderhouden akoestisch contact met opgaande vegetatieranden, ondanks het feit dat hun voorkomen bij opgaande vegetatieranden
zichnietbeperkt totdezonediegedefinieerd wordt doorhetmaximale bereik
van de sonar.
contra: E.K.V. Kalko &• H.-U. Schnitzler 1993. Plasticity in echolocation signals of
European pipistrelle batsin searchflight:implications for habitatuse andprey
detection. BehavioralEcologyandSociobiology33:415-428.
3.Door de agrarische ontwikkeling inNederland zijn tot aanhetbeginvan de
twintigste eeuw de dichtheden van de meeste soorten vleermuizen toegenomen, hetgeen vooral samenhangt met een toename van de lengte (per
oppervlakte-eenheid)van opgaande vegetatieranden.
4.Determ 'echolocatie',zoalsdiewordt gebruikt voorvleermuizen enwalvisachtigen,dient teworden vervangen door 'echoscopie'.
5. Bij zeer lage insectendichtheden is de vangefficiëntie van een vleermuis
hogerdan dievaneenvangnet;bijzeerhogeinsectendichtheden isdezelager.
6. Spierkracht kan Batman onmogelijk in delucht houden.
U.M. Norberg &JM.V. Rayner1987. Ecological morphology and flight in bats
(Mammalia; Chiroptera): wing adaptations, flightperformance,foragingstrategyand
echolocation. Philosophical Transactions oftheRoyal SocietyofLondon B316: 335427.
7. Bij het formuleren van onderzoekconclusies moet elke wetenschappelijk
onderzoeker zich realiseren dat natuurbeleidsmakers bij de toepassing van
resultaten weinig acht slaan op wetenschappelijk voorbehoud.
8.Het streven naar natuurlijkheid is in tegenspraak met het streven naar een
maximale soortenrijkdom (wat vaakwordt opgevat als 'biodiversiteit').
9.Deintrinsieke waardevan denatuur iseenbeteruitgangspunt voor natuurbeschermingseducatie dan denegatieve effecten van de achteruitgang van de
natuur op het welzijn van demens.
10.Deware wijnkenner geeft ookwijnen van minder dan een tientje per fles
eenkans.
11. Aan tafel zijn vorken gevaarlijker dan messen.
BenVerboom
Contents
1. General introduction
7
2. B. Verboom &H. Huitema 1997.
The importance of linear landscape elements for the pipistrelle Pipistrellus
pipistrellus and the serotine bat Eptesicus serotinus. Landscape Ecology 12,2:
117-125.
19
3. B. Verboom.
Effects of food abundance and wind on the occurrence of pipistrelle bats
Pipistrellus pipistrellus and serotines Eptesicus serotinus near treelines
{submitted)
4. A.R.C. Britton, G. Jones, J.M.V. Rayner, A. Boonman &B. Verboom 1997.
Flight performance, echolocation and foraging behaviour in pond bats, Myotis
dasycneme (Chiroptera: Vespertilionidae). Journal of Zoology (London) 241:
503-522.
5. B. Verboom, A. Boonman &H.J.G.A. Limpens.
Acoustic perception of landscape elements by echolocating
pond bats Myotis dasycneme [submitted)
6. B. Verboom.
The influence of wind protection on commuting and foraging pipistrelle bats
Pipistrellus pipistrellus near treelines [submitted)
7. Summary and general discussion
Samenvatting en discussie
31
45
65
75
91
103
References
111
Dankwoord
121
Curriculum vitae
123
T H E
U S E
OF
E D G E
H A B I T A T S
BY
C O M M U T I N G
A N D
F O R A G I N G
B A T S
/
C H A P T E R
1. General introduction
Bats are highly adapted animals, occupying a u n i q u e ecological niche as aerial,
nocturnal hunters. To exploit the night sky, they not only developed wings to fly.
Most bat species use echolocation to locate their prey in the dark a n d gather
information on the world surrounding them.
Among m a m m a l i a n orders, bats are probably u n s u r p a s s e d in terms of
ecological a n d morphological diversity. Currently, nearly one t h o u s a n d species are
k n o w n , one quarter of all mammals. The majority of bat species, over 800, belong to
the suborder of Microchiroptera, w h i c h are more diverse and w i d e s p r e a d than the
Old World suborder of Megachiroptera, or flying foxes. According to recent insights,
microchiropteran bats and flying foxes are unrelated taxa (Pettigrew et al. 1989).
Thirty-one bat species, all microchiropterans, are k n o w n to occur in Europe.
In The Netherlands, 21 species have been recorded (Kapteyn 1995; Limpens et al.
1997), 19 belonging to the family Vespertilionidae a n d two species belonging to the
Rhinolophidae. At current, 12 species are k n o w n to have one or more reproducing
colonies in The Netherlands (Limpens et al. 1997). Eight species occur in good
numbers, and can easily be found in their proper habitats.
Throughout the world, bats exploit a w i d e range of habitats, varying from hot
and arid deserts to tropical rainforest, boreal forest and even alpine regions,
d e p e n d i n g on the availability of food. Microchiropteran bats feed on a w i d e variety
of food types, such as other bats, birds, fish, reptiles, a m p h i b i a n s , arthropods, blood,
fruit, nectar, and pollen. Most bats, including all European species, prey on insects
a n d other arthropods.
Species diversity is greatest in sub-tropical a n d tropical regions. A n u m b e r of
insectivorous species, though, manage to survive at higher latitudes by going into
torpor during the winter m o n t h s . This allows t h e m to reduce their body temperature
and thus save energy. Torpor is not restricted to hibernating bats, but may also be
used during the s u m m e r m o n t h s whenever insect availability is low.
Among m a m m a l s , bats are u n i q u e in their ability to fly. Flight costs per unit
distance are low compared to, for instance, r u n n i n g (Norberg 1990), and this allows
bats to commute, forage and even migrate over considerable distances. Flight
furthermore reduces the risk of prédation (Pomeroy 1990).
Echolocation is a highly advanced acoustical information system, enabling
bats to avoid obstacles and to locate and catch their prey on the wing in complete
darkness. In m a m m a l s , the use of echolocation is shared only with cetaceans (whales
and dolphins) and possibly insectivores (shrews and tenrecs), but it is best
developed in microchiropteran bats. Although on itself energy expensive, the extra
costs of echolocation to flight are reduced to near zero d u e to the biomechanical
coupling of sound production a n d flapping of the wings ('wingbeat') (Rayner 1991b;
Speakman &Racey 1991).
This thesis deals with h o w and w h y bats make use of vertical landscape
elements, or edge habitats, in an otherwise open agricultural landscape. In this
chapter, I will outline the research problem. Furthermore, I will introduce a n u m b e r
of relevant aspects of bat ecology, and explain some bat-related terms used in the
following chapters.
7
USE
OF
EDGE
TATS
BY
C O M M U T I N G
A N D
F O R A G I N G
C H A P T E R
Why edge habitats? A historical perspective
Ever since ultrasonic mini-detectors (which transform the ultrasonic signals of bats
into sounds audible to the human ear) became available not only to professional, but
also to amateur bat workers in the late 1970s, knowledge about the distribution and
ecology ofbats increased rapidly. Many fieldworkers learned to identify bats by their
specific echolocation sounds and flight behaviour (Ahlén 1981, 1990; Helmer et al.
1987). In The Netherlands, a systematic, nationwide survey of bats in their summer
habitat was conducted from 1986 till 1992. The Dutch Bat Survey not only resulted
in detailed distribution maps, but revealed many aspects of the way in which
different species use the landscape and landscape features (Limpens et al. 1997).
Over the years, many fieldworkers became skilled, not only in identifying species,
but also in tracking and mapping commuting routes and foraging areas. For several
species this was rather easily performed, since travelling routes appeared to be
mainly along treelines, hedgerows, forest edges and canal banks. A method was
developed to locate maternity roosts by tracking down bats commuting to their
foraging areas at dusk, and following them when flying back to their roost again in
the morning (Helmer et al. 1987; Limpens 1993). The use by bats of edge habitats,
especially as commuting corridors, became a major topic among Dutch bat workers.
Several hypotheses have been suggested to explain the relationship between
bats and edge habitats (Limpens et al. 1989; Limpens & Kapteyn 1991). First, it was
hypothesised that bats use their sonar to find their way through an area. It would
hence be necessary for a bat to maintain acoustic contact with vertical landscape
elements. The degree to which open areas apparently were avoided by small species,
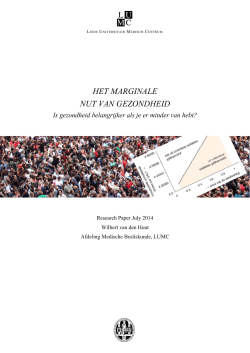
Treelines and canals are heavily used by bats (photo: Ben Verboom).
8
T H E
U S E
OF
E D G E
H A B I T A T S
BY
C O M M U T I N G
A N D
F O R A G I N G
B A T S
/
C H A P T E R
was thought to be directly related to their limited sonar range. Furthermore, edge
habitats were assumed to attract bats for their relative a b u n d a n c e of insects, and
because they provide shelter from w i n d and predators (Limpens &Kapteyn 1991).
Although previous field studies h a d enlightened m a n y aspects of the
landscape use by bats, m a n y questions about the functions of landscape elements for
bats remained u n a n s w e r e d , and m a n y n e w questions h a d arisen. In 1991, the Dutch
Ministry of Agriculture, Nature Management a n d Fisheries provided funds for a
study to evaluate the importance of landscape elements for bats. This thesis is the
result of these studies.
General aim of this study
In this thesis, I ask w h e t h e r and h o w density, configuration, a n d structural features
of edge habitats affect the a b u n d a n c e of bats in a landscape. The m a i n objective of
this study was to obtain knowledge that can be used in landscape planning,
primarily in relation to the management and creation of edge habitats for the benefit
of bats.
The importance of edge habitats such as forest edges, treelines a n d hedgerows
for bats has been demonstrated in a n u m b e r of studies (Furlonger et al. 1987;
Limpens &Kapteyn 1991; Grindal 1996; Krusic &Neefus 1996; Perdue & Steventon
1996; Walsh & Harris 1996a, 1996b). Landscape changes caused by h u m a n s may
have a positive influence on bat species richness as long as it leads to an increase of
habitat diversity, in particular of edge habitats (Estrada et al. 1992; Fenton et al.
1992). Modern land management practices such as forestry and agricultural
development, however, generally lead to habitat loss and the expansion of large open
areas devoid of trees, such as large clearcuttings, arable fields a n d 'improved'
grasslands. Bat occurrence in such areas is generally low (Furlonger et al. 1987;
Estrada et al. 1992; Crampton &Barclay 1996; Grindal 1996; Walsh &Harris 1996a,
1996b). Large-scale clearcutting of forest and other w o o d y landscape elements may
result in increased inter-fragment distances (isolation) a n d smaller forest patches.
Since m a n y bats avoid open areas, this may lead to:
reduced feeding opportunities for species roosting outside fragments for
w h i c h the open matrix between fragments forms a barrier,
the disappearance of tree-dwelling species from fragments as a result of
reduced feeding opportunities a n d reduced recolonization probability
after extinction,
eventually the disappearance of species from large areas.
Until the beginning of the present century, agricultural development had a
positive effect on species richness in m a n y parts of western Europe, including The
Netherlands. By the conversion of natural w o o d l a n d into diverse landscapes with
woodlots, orchards, pastures a n d hayland, cereal fields, hedgerows, and treelines,
m a n h a d created a small-scaled, habitat mosaic landscape, w h i c h was very rich in
species. In the present century, this situation has changed substantially. Between
1900 a n d 1990, the total length of hedgerows, hedges and treelines, w h i c h are
characteristic of old agricultural landscapes on sandy soils, was reduced by almost
6 0 % (Dijkstra et al. 1997). This was mainly the result of land consolidation schemes
9
T H E
U S E
OF
E D G E
H A B I T A T S
BY
C O M M U T I N G
A N D
F O R A G I N G
B A T S
/
C H A P T E R
to facilitate large-scale farming, and because landscape elements, such as hedgerows,
lost their original function as supply of wood. Similar processes took place in other
parts of north-western Europe (e.g. Baldock 1990; Barr et al. 1993).
Over the past decades, m a n y bat species in The Netherlands, and in the whole
of north-western Europe, have declined in numbers and range (Daan 1980; Stebbings
1988; Broekhuizen et al. 1992; Limpens et al. 1997). Changes in land-use are thought
to be a major cause of the decline of many species (Walsh &Harris 1996a/b; Limpens
ot al. 1997). In m a n y countries, treelines, hedgerows, forest edges and vegetated
banks used to form, and in some areas still form, extensive networks. Such edge
habitats are often heavily used by bats. To compensate for the negative effects of the
ongoing fragmentation of w o o d y vegetation in our cultivated landscapes, protection
and creation of woody landscape elements is essential.
Interactions between flight, food and echolocation
To appreciate the habitat preference, and, in particular, the use of edge habitats by
different bat species, I will first give an overview of relevant aspects of the behaviour
and ecology of bats in their s u m m e r habitats. There is a clear relationship between a
bat's functional 'design' and its commuting and foraging behaviour. Several studies
have demonstrated that flight morphology and echolocation properties of bats are
strongly related to their habitat use (e.g. O'Shea &Vaughan 1980; Pye 1980; Aldridge
1986a/b; Aldridge &Rautenbach 1987; Furlonger et al. 1987; Norberg &Rayner 1987;
Neuweiler 1989; Fenton 1990; McKenzie et al. 1995). Wing morphology poses
energetic and mechanical constraints on a bat's flight speed and manoeuvrability
(Norberg & Rayner 1987). Echolocation calls have evolved to optimise foraging
efficiency in a particular habitat. Both wing morphology and echolocation call
structure are believed to be interrelated parts of the same adaptive complex
(Aldridge &Rautenbach 1987).
FLIGHT STYLEAND FORAGING ECOLOGY
Among insectivorous bats, the following foraging strategies can be identified
(Norberg and Rayner 1987). Most insectivorous bats catch their prey on the wing in
open air by 'aerial hawking'. 'Fast hawking' species often h u n t in large open spaces,
'slow hawking' bats are usually found in more confined airspaces between
vegetation. 'Perch-hunting' or 'flycatching' bats locate their prey hanging from a
perch, then catch it by aerial hawking, and return to their post. 'Trawling' bats take
their prey from water surfaces with their h i n d feet or tail m e m b r a n e . 'Gleaning' bats
take their prey from surfaces such as vegetation ('foliage gleaners') or from the
ground ('ground gleaners' or 'pouncers'). Many gleaners are capable of hovering over
their prey.
Many species use more than one foraging technique. All species in The
Netherlands forage by aerial hawking, often in addition to one or more other
techniques. The trawling species Myotis daubentonii
and M. dasycneme,
for
instance, very frequently h a w k for insects above the water surface a n d sometimes
over land.
The flight performance (speed and manoeuvrability) a n d foraging behaviour
10
T H E
U S E
OF
E D G E
H A B I T A T S
BY
C O M M U T I N G
A N D
F O R A G I N G
B A T S
/
C H A P T E R
of a particular bat species are a reflection of its wing morphology (Norberg & Rayner
1987; Norberg 1990). In relation to flight style, two indices of wing morphology are
especially important: 'wing-loading', w h i c h is defined as the weight divided by wing
area, and 'aspect ratio', w h i c h is (wing span) 2 divided by wing area. Bats with high
wing-loading are generally large and have relatively small wings. They are designed
to fly fast. Although these bats are not manoeuvrable in confined airspaces, their
flight is agile, so they can turn quickly. Large aspect ratio means that wings are long
and narrow. Large aspect ratios allow greater aerodynamic efficiency because of
reduced drag on the wings.
Although some bats show strong flexibility, different flight a n d foraging styles
can be distinguished, based u p o n these two variables (see Norberg &Rayner 1987).
Bats w i t h high wing-loading and large aspect ratio are streamlined, fast flyers, w h i c h
catch their prey on the wing in large open spaces by aerial hawking. These bats
c o m m u t e or migrate over long distances. In The Netherlands, Nyctalus noctula and
Nyctalus leisleri have relatively high wing loadings, but average aspect ratios. Bats
with low wing-loading and large aspect ratio still have a low manoeuvrability.
Although they may fly long distances, their flight speed is relatively low. A n u m b e r
of frugivorous and nectarivorous species of the subfamily Phyllostominae, as well as
several piscivorous bats, belong to this category (Norberg &Rayner 1987). Relatively
few bats combine a high wing-loading with a low aspect ratio. Most of these are
nectar and pollen feeders, adapted to hovering near flowers and to fly fast between
patchy food supplies. Bats with low wing-loading and low aspect ratio are slow
flying, highly manoeuverable bats, adapted to h u n t in confined spaces, e.g. among
vegetation. The foliage gleaning Plecotus and several Myotis species fall into this
category.
ECHOLOCATION
Echolocating bats produce short, high-frequency sound pulses, mostly between 20
and 120 kHz. By analysing the reflected echoes of the emitted sounds, bats create a
sound-picture of the surrounding world. Although some bats produce s o u n d s that
are audible to the u n a i d e d h u m a n ear, most echolocation calls are ultrasonic, that is
beyond the frequency range of h u m a n hearing. The most important reason for
emitting ultrasound signals is that very small objects, such as insects, can be
detected. Echolocation, furthermore, enables bats to avoid obstacles, e.g. w h e n flying
among vegetation or approaching a wall. But echolocation is more than just 'locating'
objects. An echolocating bat can also recognize patterns and structures, so that, for
example, it can distinguish prey from non-prey. A term analogous to visualization
('audification', Neuweiler 1990), w o u l d probably do more justice to this highly
sophisticated system.
The specific echolocation pulses of bats may be of constant frequency (CF), or
may include a range of frequencies (frequency modulated or FM; Fig. 1.1). CF pulses,
although often starting and/or ending with a short FM component, are also called
narrowband pulses. FM pulses may be termed broadband pulses. CF pulses are long,
typically 10-50 ms, compared to FM pulses, w h i c h are generally 2-5 ms in duration,
but in m a n y cases even shorter. FM pulses often end, and in some cases begin, with
a near CF c o m p o n e n t of variable duration. The duration of these QCF c o m p o n e n t s ,
w h e r e QCF stands for 'quasi constant frequency' (Kalko & Schnitzler 1993), may
11
T H E
U S E
OF
E D G E
H A B I T A T S
C O M M U T I N G
A N D
F O R A G I N G
C H A P T E R
B A T S
range 5-25 ms. The frequency of highest intensity (the peak frequency) is usually in
the QCF part of the pulse.
It is generally thought that the maximum sonar ranges of most bats are in the
range of 5-40 m, and that echolocation works over even shorter distances. The reason
for this is that ultrasonic signals with very short wavelengths do not travel very far
in air due to energy absorption, which increases exponentially with frequency and
additionally increases with humidity and air temperature (Neuweiler 1990).
Additionally, the travel distance of sound in air is limited by spreading loss or
geometrical attenuation due to sound expansion.
Generally, FM bats avoid the overlap of a returning echo (1) with the same
110
90 .
70
o 50
C
I
CT"
30
«S
Myotis dasycneme
\
V
V
I
Myotis bechsteinii
(two calls)
10
_l
50 ms
10 ms
I
Myotis mystacinus
I
I
I
50 ms
110
90
70
Pipistrellus nathusii
o 50
C
Nyctalus noctula
g. 30
Tadaridateniotis
10
-I
50 ms
I
I
I
I
50 ms
20 ms
110
Rhinolophus
- euryale
90
1
70
R. ferrumequinum
Barbastella
barbastellus
50
Eptesicus
\
L
30
10
J
I I I I
50 ms
50 ms
50 ms
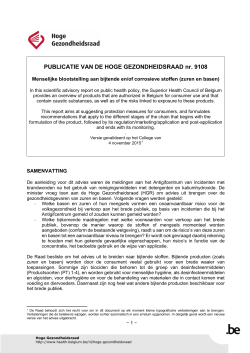
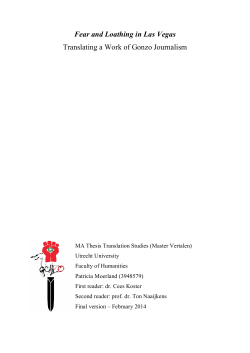
Figure 1.1.
Time versusfrequency plots (sonograms) of echolocation calls,showing the variation in
pulse types among nine European bat species (from Altringham 1996).
12
T H E
U S E
OF
E D G E
H A B I T A T S
C O M M U T I N G
A N D
F O R A G I N G
C H A P T E R
and (2)with the subsequent outgoing signal. Overlap isbelieved tomask information
stored in the echoes, especially because ofreduced hearing sensitivity during calling
(Cahlander et al. 1964; Henson 1965; Suga & Schlegel 1972). For FM bats, like
vespertilionids, overlap avoidance means that the duration of a pulse should be
short enough when the bat-to-object distance is small. This means that prey can be
detected only as long as the bat keeps a minimum distance to it. Furthermore, to
avoid overlap of prey and background echo, the distance between prey and
background should not be too small ('overlap-free window', Kalko & Schnitzler
1993). When the bat is echolocating a more distant object, interpulse intervals (the
interval between echolocation pulses) should be long enough to allow a returning
echo to be received and processed before the next pulse is emitted.
Before having detected an airborne prey, a hunting bat emits socalled 'search
phase' echolocation calls. When it detects a prey and gets closer to it, the bat enters
the 'approach phase' (Fig. 1.2). To avoid pulse-echo overlap, pulse duration is
shortened, while more pulses per second are emitted to collect information at a
faster rate. In the terminal phase preceding prey capture, the emitted pulses become
even shorter and pulse-repetition rate faster. The 'terminal phase' is also called a
'feeding buzz'. This refers to the sound heard on an ultrasonic or bat detector. During
the approach and terminal phases, bats often add harmonics to the fundamental
frequency (Fig. 1.2b) in order to increase the signal bandwidth. This enables the
100
««*l*~
,pp»ch
,_.„„
V V V V VVVVMI
y (kHz)
"capture
0
0.2
0.4
0.6
0.8
1.0
u
Ö
CD
CT
search phase
approach
. ,
t
100
CD
capture
v vvviiiiiii
0
i
0
i
0.2
i
i
0.4
i
i
0.6
i
i
0.8
i
i
1.0
Figure 1.2.
Changes in pulse-repetition rate and pulse duration from search phase to prey capture.
(a) Fundamental frequency only, (b) with harmonics (from Altringham 1996).
13
T H E
U S E
OF
E D G E
H A B I T A T S
BY
C O M M U T I N G
A N D
F O R A G I N G
B A T S
/
C H A P T E R
animal to collect more accurate information on the exact position and structure of
the target.
As illustrated by Figure 1.1, there is a wide range of echolocation pulse types
among bat species, and there is much evidence that interspecific differences are
strongly correlated with the habitat type in which each species occurs. Species
specific differences allow the identification of many species with the use of bat
detectors. However, there seems to be considerable variation on the intraspecific
level (e.g. Rydell 1990; Obrist 1995), which can be a serious constraint on species
identification. Individual changes in signal structure not only occur after prey is
detected (approach phase, terminal feeding buzz), but may occur during the search
phase as well when bats adapt their echolocation call characteristics, such as pulse
duration, pulse frequency, bandwidth and interpulse intervals, in order to optimise
foraging efficiency in different environments. In general, high frequency, broadband
calls are better suited for the determination of target range and provide more
accurate information on the texture and the structure of objects than do low
frequency, narrowband echolocation signals (e.g. Simmons & Stein 1980; Saillant et
al. 1993; for reviews see Neuweiler &Fenton 1988; Fenton 1990; Neuweiler 1990).
Furthermore, they are more resistent to clutter (background echoes from vegetation
or ground), which may interfere with prey echoes. Low frequency, narrow
bandwidth calls, on the other hand are better suited for long range detection. Most
of the changes seem to be related to the bats' distance to clutter-producing objects.
For example, when flying from a forest lane into an open meadow, individual bats
generally switch to more narrowband signals of lower frequency and longer
duration. Together with flight style and foraging strategy, the variation of
echolocation signal design in relation to habitat structure has been subject of many
studies (e.g. Kalko & Schnitzler 1993; Obrist 1995; Fenton 1986).
There seems to be a strong relation between echolocation call design and the
availability of certain categories of prey to bats. The selective feeding by a number
of bat species on specific prey categories seems to be more easily explained by
limitations of their echolocation system (passive selection) than by reasons of
optimal foraging (active selection; Barclay & Brigham 1994).
Foraging strategies of bats (see previous section) can be characterised by their
specific type of echolocation. For five species, Figure 1.3 illustrates the relationship
between foraging strategy, wing-morphology and echolocation pulse design, and
shows the considerable variation between species.
Among the aerial hawking bats, species that hunt in large open spaces
typically emit high intensity, low frequency, narrowband QCF or FM-QCF
signals with a relatively long duration QCF component (e.g. N. noctula,
Fig. 1.3). This enables them to detect prey over large distances, which is
important since most open space hawkers are fast flyers. Once close to a
prey item, they can switch to short, broadband, FM pulses which provide
more detailed information. Slower flying aerial hawkers of more confined,
cluttered environments tend to emit higher frequency calls (Fig. 1.3:
Pipistrellus pipistrellus). When emitting FM-QCF pulses, the QCF
components are of shorter duration, or may be absent tobecome FM signals.
Trawling bats generally emit broadband FM signals (Fig. 1.3: M.
daubentonii). Some species, such asM. dasycneme, emit pulses with aQCF
14
T H E
U S E
OF
E D G E
H A B I T A T S
BY
C O M M U T I N G
\
A N D
F O R A G I N G
B A T S
/
C H A P T E R
"Or*
•1>i,
©
©
O
©
KHZ
80
60
40
20
V
L.
U
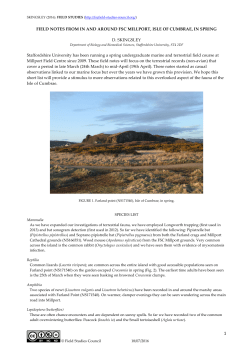
Figure 1.3.
The relationship between foraging strategy, wing-morphology and echolocation pulse
design in five species from The Netherlands (drawing by P.Twisk).
1 Nyctalus noctula (noctule); 2 Eptesicus serotinus (serotine); 3Pipistrellus pipistrellus
(pipistrelle); 4 Myotis daubentonii (Daubenton's bat); 5Plecotus auritus (long-eared bat)
15
T H E
U S E
OF
E D G E
H A B I T A T S
BY
C O M M U T I N G
A N D
F O R A G I N G
B A T S
/
C H A P T E R
component. This may be related to detection over long distances, but they
may also be used during aerial hawking.
Foliage and ground gleaning bats use FM signals of very short duration (<2
ms) and low intensity (Fig. 1.3: Plecotus auritus). These signals are designed
to discriminate fine texture over short distances. Instead of echolocation,
many gleaners use the sounds generated by their prey for detection.
Perch-hunters such as several Rhinolophidae species emit CF calls, which
are designed todetect fluttering insects in extremely cluttered environments.
Orientation and navigation
Bats are remarkably skilled in orientation and navigation, the former being the
mechanism involved in the recognition and maintenance of direction, the latter
being the mechanism involved in the identification of the direction of a give point
in space (Baker 1978). A number of temperate species, for instance, undertake longdistance migrations between their summer and winter roosts, sometimes over more
than 1000 km (e.g. Pipistrellus nathusii, Strelkov 1969; N. noctula, Doekemeijer
1994). Homing experiments with bats, released at varying distances from their roost,
indicate that bats have very accurate navigational capabilities, especially within
their home range. Although vision is poorly developed in bats, homing studies
suggest that vision plays a role in navigation (e.g. Williams & Williams 1967; Davis
& Barbour 1970). But in several of these experiments, blindfolded bats were as
successful as their unblinded controls (e.g. Mueller & Emlen 1957; Stones &Branick
1969), suggesting a role of echolocation in navigation as well. Other possible
mechanisms, such as the use of magnetic cues, have not yet been studied in bats.
There are several possible mechanisms that a bat could use to navigate
through a landscape. Bat movements may be guided by information stored in
cognitive maps of their environment. At least some bat species seem to possess an
excellent spatial memory of the environment they are familiar with (Griffin 1988).
Up till now, the role of reference landmarks in bat navigation is only speculative, but
if bat movements rely on spatial memory, the information stored in cognitive maps
still has to be based on acoustic and, possibly, visual cues, and reference landmarks
may still be necessary for a bat's navigation.
Outline of the thesis
In Chapter 2, I ask whether and to which degree edge habitats are used by two bat
species, the pipistrelle bat Pipistrellus pipistrellus and the serotine Eptesicus
serotinus. On a landscape scale, the occurrence of both species is correlated to the
density of hedgerows, treelines and woodlot edges and their degree of fragmentation.
Four possible explanations for the assessed relationships of bats to edge habitats are
discussed: (1) acoustical landmarks, (2) foraging areas, (3) shelter from wind, and (4)
shelter from avian predators. In Chapters 3-5, hypothesized functions of edge
habitats for bats are studied in more detail. Effects of wind and insect abundance on
the occurrence of commuting and foraging pipistrelle bats near treelines are tested
16
T H E
U S E
OF
E D G E
H A B I T A T S
BY
C O M M U T I N G
A N D
F O R A G I N G
B A T S
/
C H A P T E R
1
in Chapter 3. Predator avoidance and acoustical landmarks are discussed as
alternative explanations for the relationships found. To examine the possible
function of vertical landscape elements as acoustical landmarks, the echolocation
behaviour of the pond bat Myotis dasycneme was studied. Chapter 4 describes the
flight performance and echolocation characteristics of commuting and foraging pond
bats. In Chapter 5, characteristics of echolocation signals emitted by pond bats
commuting over canals are related to the distance to the banks. In Chapter 6, the
profitability of treelines as a feeding site for pipistrelle bats is assessed by relating
the occurrence of foraging pipistrelles to treeline features (height, width,
permeability). The commuting behaviour of pipistrelles was studied in relation to
the distribution of potentially good feeding sites.In Chapter 7,results ofthe previous
chapters are discussed. Practical guidelines for the application of results in the
planning, conservation, and management of edge habitats are presented.
17
T H E
18
U S E
OF
E D G E
C O M M U T I N G
A N D
F O R A G I N G
T H E
U S E
OF
E D G E
H A B I T A T S
BY
C O M M U T I N G
A N D
F O R A G I N G
B A T S
/
C H A P T E R
2. The importance of linear landscape elements
for the pipistrelle Pipistrellus pipistrellus and
the serotine bat Eptesicus serotinus
Summary
The relation between two species of bats, the pipistrelle [Pipistrellus pipistrellus
(Schreber, 1774)) and the serotine [Eptesicus serotinus (Schreber, 1774)) and linear
landscape elements, in particular hedgerows and treelines, was studied in an
agricultural area in The Netherlands. The pipistrelle was observed almost entirely
close to landscape elements, while serotines more frequently crossed fields and
meadows. Serotine activity in these open areas was, however, negatively related to
the distance to a landscape element and to windspeed.
On a landscape scale the results indicate a more than proportional positive
relation between the density of serotine bats and the density of linear landscape
elements, whereas this relation was only proportional in the case of the pipistrelle.
It is argued, that landscapes with a high density of linear elements have a surplus
value for serotines.
Three possible functions of linear elements for bats (orientation clues,
foraging habitat, and shelter from wind and/or predators) are discussed. Any of these
may explain the results of this study.
Introduction
Studies of linear landscape elements have focused on two aspects. The first is their
role as connective elements in a metapopulation concept. Several studies show the
importance of corridors for the survival of a species in a landscape (e.g. Getz et al.
1978, voles; Henderson et al. 1985, chipmunks; Opdam et al. 1985 and Van Dorp&
Opdam 1987, forest birds; Verboom & Van Apeldoorn 1990, red squirrels).
Secondly, the function of linear landscape elements as (daily) migration and
foraging routes is emphasized by several authors (e.g. Wegner & Merriam 1979).
Field studies and observations in The Netherlands during the last decade indicate
that most bat species in their summer habitats prefer to fly along linear landscape
elements such as hedgerows, treelines, forest lanes and edges, canals, etc. instead of
crossing open areas (Limpens et al. 1989; Limpens &Kapteyn 1991). Helmer (1983)
found that Daubenton's bats [Myotis daubentonii) used regular flight routes over
distances up to 6 km, to reach their hunting grounds, following lanes, wood edges,
hedgerows and water courses. A study of marked pipistrelle bats [Pipistrellus
pipistrellus) around two colonies, revealed that the bats moved between fixed foraging
sites on regular flight routes (Racey & Swift 1985). The maximum distance at which a
bat was observed from its colony was 5.1 km (mean: 1.8 and 1.0 km respectively).
When commuting between colony and foraging areas Daubenton's bats only
occasionally hunt for insects. Many other species, however, are frequently observed
19
T H E
U S E
OF
E D G E
H A B I T A T S
BY
C O M M U T I N G
A N D
F O R A G I N G
B A T S
/
C H A P T E
foraging along linear landscape elements. Racey &Swift (1985) for instance, in their
study of pipistrelles, found that flight routes were used for h u n t i n g as well.
Differences between species are also reflected in the degree to w h i c h they
d e p e n d on linear landscape elements w h e n moving through a landscape. In general,
large species with a long range sonar, like the noctule (Nyctalus noctula) and the
serotine {Eptesicus serotinus) are frequently observed in open areas. Smaller species
with a short-range sonar like the pipistrelle usually keep more closely to rows of
shrubs and trees and their m o v e m e n t s are considered to be h i n d e r e d by gaps in
linear structures (Limpens et al. 1989; Limpens &Kapteyn 1991).
From a bat's point of view, w e can imagine three different functions of linear
landscape elements:
1. Linear elements are used as sonar guidelines.
In addition to prey detection, bats may use their sonar for navigation and
orientation (Limpens et al. 1989; Neuweiler 1990; Rieger et al. 1990;
Limpens & Kapteyn 1991). Homing experiments at least suggest the
existence of echo-orientation. Experiments with blindfolded bats showed
no difference in homing ability, w i t h i n their h o m e range, from bats that
were able to see (e.g. Mueller & Emlen 1957; Williams et al. 1966). A
similar experiment with blinded as well as deafened bats, released at 50
km from their roost, resulted in successful homing by 2 8 % of the blinded
bats (controls: 31%), but by n o n e of the deafened bats (Stones & Branick
1969). It is thought that a species with a short sonar range must keep closer
to a landscape structure for navigation and orientation. Many bats
traditionally use specific flight routes (Bateman &Vaughan 1974; Racey &
Swift 1985; Rieger et al. 1990). Spatial memory is considered to play a role
in the use of these flight routes. More efficient foraging, owing to a
reduction in the costs of searching for suitable foraging areas, is assumed
to be the prime benifit (Bell 1991).
2. Linear landscape elements are a suitable foraging habitat for bats.
Hedgerows, treelines and wood edges have an important influence on the
distribution of insects in a landscape. Insect densities a r o u n d such
landscape elements are k n o w n to be relatively high compared to adjacent
fields, firstly because the vegetation provides a habitat for insects (Lewis
1969a; Forman & Baudry 1984), secondly because insects from
surrounding areas accumulate on the leeward side (Lewis 1969b; Lewis &
Dibley 1970). In o p e n areas, highest insect densities are found near the
ground and show a steep decrease w i t h height. In sheltered areas, such
vertical gradients are less p r o n o u n c e d a n d the effects of w i n d a n d
temperature are t e m p e r e d (Karg &Ryszkowski 1985).
3. Linear elements provide protection against predators a n d / o r w i n d .
To conserve energy and time, bats may seek shelter against w i n d by flying
on the leeward side of trees and bushes. Predatory birds, especially owls
a n d kestrels, n o w and then catch bats. According to Speakman (1991), the
impact of prédation by avian predators on bats a n d bat behaviour may be
considerable in some areas. By flying on the shaded side of a linear
landscape element, a bat can avoid being lighted by streetlights, moonlight
or sunset glow, and decrease exposure to predators.
20
T H E
U S E
OF
E D G E
H A B I T A T S
BY
C O M M U T I N G
A N D
F O R A G I N G
B A T S
/
C H A P T E R
Although linear elements still are the predominant landscape structures in
many agricultural areas in The Netherlands, they are much threatened by rural
development. Yet, their importance for many species is recognized by conservation
biologists. Recently, the Dutch government's nature policy has emphasised the
development of an ecological infrastructure for plants and animals. In 1991,a fiveyear project was set up to study the role of linear landscape elements for bats. This
paper deals with the relationships between bats and the landscape structure. We
focused on two species, the serotine and the pipistrelle. Field observations indicated
that these bats exhibit different ways of using landscape elements when moving
through a landscape. Our aim was to verify whether the difference between these
two species in their behaviour towards linear elements is reflected in the way they
are distributed on a landscape scale. The results will help us to consider the needs
of bats in landscape planning activities, e.g. land consolidation and nature
development projects.
The following questions are dealt with:
1. Do pipistrelles in fact follow linear elements more closely than serotines?
2. Do bats occur along isolated fragments of linear landscape elements?
3. Do landscapes with a high density of linear landscape elements attract
more bats?
4. Does fragmentation of the network of linear landscape elements negatively
influence the occurrence of bats?
5. Which characteristics of linear landscape elements influence the
occurrence of bats?
Questions number three and four deal with relations between bats and linear
landscape elements on a landscape scale, while the other questions deal with the
smaller scale of landscape elements. Whether the density of linear landscape
elements influences the distribution of a bat species depends on the limiting factor
for this species on a landscape scale. If we assume that linear elements indeed limit
bat densities, we can summarize our expectations as follows. For the pipistrelle,
being closely associated to edge habitats, we expect densities to increase in direct
proportion to the amount of linear elements. The foraging habitat of a serotine is
probably not confined to hedgerows, treelines and wood edges and may extend to
nearby open areas. We therefore expect a less than proportional relation with linear
landscape element density in serotines. Isolation effects are expected to be more
important to species with a smaller sonar range like the pipistrelle.
Material and methods
STUDY AREA
The research area was in the northern part of Twente (province of Overijssel). In The
Netherlands, this area represents one of the best examples of an old agricultural
landscape type with many linear elements. The original agricultural landscape
structure, in which meadows and fields are separated by a network of hedgerows
and treelines, is still intact in parts of the area. Many small woodlots (<3 ha) are
present, along with a few larger woods of 30-200 ha.
21
T H E
U S E
OF
E D G E
H A B I T A T S
BY
C O M M U T I N G
A N D
F O R A G I N G
B A T S
/
C H A P T E R
Networks of treelines and hedgerows connecting patches of wood can still be
found in some old agricultural landscapes in The Netherlands, such asTwente
(photo: IBN-DLO).
OBSERVATIONS
In order to detect relationships on a landscape scale as well as on the scale of the
landscape element, 110 observation points were distributed over 15 l x l km squares,
each square containing 5-8 observation points. One to three ofthe observation points
in each square were situated in open areas, in meadows, arable fields or along
roadsides, 25-265 m from the nearest trees or shrubs (23 in total). The remaining 87
points were situated approximately 2m from linear landscape elements, along single
(hedgerows, tree rows) linear elements or double treelines or along woodlot edges.
Observations along single elements were made on the leeward side, observations
along double elements were made between the rows of trees, usually from the
middle of a road or track. In order to minimise the influence of woods, there were
no woodlots of more than 2ha or woodlots with (interior) trails or roads (which may
22
2
U S E
OF
E D G E
C O M M U T I
F O RA G
C H A P T E R
Figure2.1.
Diagrams of tree lanes, hedgerows and woodlots in two of the 1x1 km squares studied,
illustrating the variation in density and degree of fragmentation of linear landscape
elements in the study area.
be used as flight routes) in the selected squares. Two of the l x l km squares are
s h o w n in Figure 2.1. Data on roost sites were not collected for practical reasons.
Fieldwork was carried out between May and August 1992. At each
observation point, 5 observations were made, equally divided over the investigation
period and over the night. At each observation bat activity was measured as the
n u m b e r of bat passes per 5 minutes, using a bat detector (D-960, Pettersson
Elektronik, Uppsala, Sweden). A bat pass was defined as an increase in a m p l i t u d e of
bat s o u n d , followed by a decrease. The detector was t u n e d at 42 kHz. In the field,
detection ranges seemed to be similar for both species at this tuning frequency. The
(maximum) sonar ranges of both species are a s s u m e d to differ analogously with the
m a x i m u m detection ranges of the bat detector w h e n t u n e d at the respective peak
frequencies of the bats.
Data on temperature, w i n d s p e e d , cloudiness and moonlight, as well as time
of the night and year were also collected.
DATA ANALYSES
Field data were analysed with Poisson regression analyses, using the statistical
programming package GENSTAT (Genstat 5 Committee 1987). The n u m b e r of bat
passes was used as the d e p e n d e n t variable. Table 2.1 shows the i n d e p e n d e n t
variables used in the analyses. Linearity of all i n d e p e n d e n t variables in relation to
the logarithm of the d e p e n d e n t variable was assumed. The d e p e n d e n t variable was
fitted with each of the i n d e p e n d e n t variables separately. The model was extended
23
T H E
U S E
OF
E D G E
H A I
I T A T S
BY
C O M M U T I N G
A N D
F O R A G I N G
B A T S
C H A P T E R
Table2.1.
Independent variables usedintheanalyses.
LANDSCAPE SCALE (1X1 KM SQUARES)
LLE
LLESURR
FRAG
FRAGSURR
total length of linear landscape elements (hedgerows, tree rows, double
treelines within the square (m)
total lenghth of linear landscape elements in the surrounding eight
l x l km squares
degree of fragmentation of the linear landscape element network within
the square (number of fragments divided by LLE)
degree of fragmentation of the linear landscape element network in the
surrounding eight l x l km squares
LANDSCAPE ELEMENT
FRAGL
FRAGD
LLETYPE
WIDTH
HEIGHT
PERM3
PERM6
PERMMAX
length of fragment that includes observation point (m)
distance between the fragment of the observation point and the nearest
other fragment (m)
type of linear landscape element (single, double, wood edge)
maximum width of the element (m)
maximum height of the element (m)
visual permeability at 3 m above the ground (%)
visual permeability at 6 m above the ground (%)
maximum visual permeability (%)
OPEN AREA
LLED
WATD
OTYPE
distance to the nearest landscape element (m)
distance to the nearest water (m)
type of open area (meadow, field, roadside)
LEVEL OF THE OBSERVATION
TEMP
WIND
CLOUD
MOON
TIME
DATE
temperature ("C)
wind-speed (m/5 min)
cloudiness (1 - 5)
moonlight (1 - 8)
time of the night (minutes after sunset)
date (May-days)
with a second parameter if addition significantly reduced the deviance ratio
(mean regression deviance divided by mean residual deviance). The level of
significance used was P=0.05 (F-tests). The variation in the dependent
variables between l x l km squares as well as between observation points was
analysed. We also checked for possible effects of weather data and time of the
night and year.
In the analyses of landscape scale parameters, we used an offset
variable to correct for number of observation points per l x l km square. Thus
the fitted values per square represent the average number of bat passes per
observation point, being a measure of total bat activity.
In the calculation of the degree of fragmentation in the network of
linear landscape elements (FRAGM), the length of fragments (FRAGL) and
the distance between fragments (FRAGD),we (arbitrarily) used aminimum of
50 m as a distance to separate fragments, assuming that in open terrain a
distance of 50 m and more forms a considerable barrier to cross, at least for
pipistrelles.
24
T H E
U S E
OF
E D G E
H A B I T A T S
BY
C O M M U T I N G
A N D
F O R A G I N G
B A T S
/
C H A P T E R
2
Table 2.2.
Summary of bat data along linear landscape elements and in open areas.
SEROTINE
LINEAR LANDSCAPE ELEMENTS (N=87)
presence per observation point
mean number of passes per point
max. number of passes per point
PIPISTRELLE
53%
68%
1.51
3.28
17
24
OPEN AREAS (N=23)
presence per observation point
mean number of passes per point
max. number of passes per point
52%
9%
1.35
0.26
6
5
Results
BAT PRESENCE
Both the serotine a n d the pipistrelle were observed in all 15 l x l km squares. Table
2.2 shows presence data for both species along linear landscape elements a n d in
open areas. The presence of pipistrelles on observation points (fraction per 5
observations) in open areas was m u c h lower than along linear landscape elements
(Table 2.2; Mann Whitney U-test: P<0.001). The presence of serotines in open areas
was not different from the presence along linear landscape elements (Table 2.2;
M a n n Whitney U-test: P=0.49). However, in a Poisson regression analysis, the
activity of serotines was negatively related to the distance to a linear landscape
element (n=23; R 2 =26%; P=0.01; distances ranged 25-265 m).
Effects of isolation of fragments of linear landscape elements in w h i c h
observation points were situated on bat presence were not found. Observation
points were dispersed over a total of 50 fragments, meaning that some fragments
contained more t h a n one observation point. Twelve fragments lacked pipistrelle and
19 lacked serotine observations. According to certain criteria (length of fragment
(FRAGL) <1000 m a n d distance to nearest fragment (FRAGD) >100 m and a
m a x i m u m of five buildings along fragment), 11 relatively isolated fragments
(FRAGD ranging 110-170) were selected. The presence of roosts was unlikely, as
only a few buildings were situated along these fragments. Pipistrelles were observed
in six and serotines in five of these most isolated fragments (FRAGD ranging 110150 m) w h i c h demonstrates their ability to cross gaps this wide. Apparently the
degree of isolation in the study area did not exclude bat movements between
fragments of linear landscape elements. For both species there was no difference
between the presence along isolated and non-isolated fragments (Chi-square tests:
P>0.05).
We also checked for effects of wind. The activity of serotines in o p e n areas
over all observations was negatively correlated with w i n d - s p e e d (n=115; R 2 =12%;
P<0.001).
25
T H E
U S E
O F
E D G E
H A I
C O M M U T I N G
A N D
F O R A G I N G
B A T S
/
C H A P T E R
Table 2.3.
Landscape scale level: Poisson regression models of the average number of pipistrelle
and serotine passes per observation point. Offset parameter: number of observation
points per square. R2= percentage of deviance accounted for by the model.
MODEL
ESTIMATE
R2
P
-0.000034
-0.000338
0.190
175.4
0.3
6.8
18.3
27.7
0.845
0.350
0.112
0.044
0.000231
-0.000597
0.0000793
0.0004
117.2
26.9
38.5
61.5
0
26.9
0.048
0.014
0.009*
1.000
0.049
pipistrelle
LLE
LLESURR
FRAG
FRAGSURR
serotine
LLE
LLESURR
LLE + LLESURR
FRAG
FRAGSURR
* significance of the
ast variable
LANDSCAPE SCALE
For both species, the results of' the Poisson regressions are outlined in Table 2.3. In
the l x l km squares, both pipistrelle and serotine activity were positively related to
the fragmentation of the network of linear elements in the surrounding eight l x l km
squares (FRAGSURR).
The n u m b e r of serotine bat passes showed a relation with the density of linear
landscape elements (LLE), and particularly with those in the surrounding squares
(LLESURR). Both variables together (ILLE-LLESURR = 0-105) explained over 6 0 % of the
total deviance. The relation with LLESURR may be caused by the occurrence of
many woodlots, and hence wood edges, in m a n y of the surrounding squares, w h i c h
may have attracted bats from the squares where bat data were collected. Wood edges
m a d e u p 4 3 % of the linear elements in the surrounding squares.
SCALE OF THE LANDSCAPE ELEMENT
In the regression analyses of serotines along linear elements, n o n e of the parameters
showed any significant effect. The Poisson regression analyses of the number of
pipistrelle passes gave a significant positive effect of 'height of a linear landscape
element' (R 2 =12.5%; P=0.005). Linear elements at the observation points were 3-25
m high. Pipistrelles were not recorded along elements less than 6 m high (n=6),
while serotines flew along elements of all heights.
The linear landscape elements were separated into three different types:
single linear elements (hedgerows, tree rows; n=46), double linear elements (lanes;
n=24) and wood edges (n=17). T-tests revealed that neither of the species showed a
preference for any of these types of landscape elements.
26
T H E
U S E
OF
E D G E
H A B I T A T S
BY
C O M M U T I N G
A N D
F O R A G I N G
B A T S
/
C H A P T E
FORAGING ACTIVITY
Observations of feeding buzzes show that both species forage along linear elements.
Only serotines were observed to h u n t in open areas as well. The n u m b e r of occasions
with feeding buzzes was, however, very low. We recorded feeding buzzes during
nine out of 550 observations for the pipistrelle as well as for the serotine. Three of
these observations were in open areas for the serotine. For both species there was a
strong positive correlation between the n u m b e r of bat passes and the n u m b e r of
feeding buzzes. Three extremely high values were probably caused by bats hunting
close to the observation point, flying to and from past the observer. On these
occasions, we twice recorded 24 pipistrelle passes, and 17 serotine passes during a
five-minutes observation period, together with 11, 4 and 1 feeding buzzes
respectively.
Conclusions and discussion
DIFFERENCES BETWEEN PIPISTRELLESAND SEROTINES
We can summarise the differences between the two species with respect to linear
landscape elements a n d the barrier effect of open areas:
1. Pipistrelles predominantly were found close to the vegetation of linear
landscape elements. Serotines were observed as often in open areas as they
were beside linear elements. However, the activity of serotines decreased
with increasing distance from the linear element. Serotine activity in open
areas was negatively influenced by wind.
2. We found a more than proportional increase of serotine activity with the
density of linear landscape elements, whereas the increase of pipistrelle
activity was only proportional.
BATACTIVITY
We recorded the n u m b e r of bat passes only, w h i c h were a reflection of both bat
density and individual foraging activity. It was not possible to account for bats being
counted more than once during a five-minute period, w h i c h may have occurred in
the case of foraging bats. In this paper we consider the n u m b e r of bat passes to be an
indication of bat activity.
THE FUNCTION OF LINEAR LANDSCAPE ELEMENTS
Any of the functional explanations mentioned before are capable of explaining the
role of landscape elements assessed in this study:
1. Echo-orientation
The ability to use landscape elements as sonar beacons d e p e n d s on the bat's
m a x i m u m sonar range. Both the pipistrelle and the serotine emit relatively
narrowband signals during their search flight in a more open environment
(pipistrelle: Kalko & Schnitzler 1993; serotine: Miller & Degn 1981). These
signals are suitable for long range detection, in contrast to the broadband
signals they emit w h e n flying close to vegetation or during prey capture (e.g.
Neuweiler & Fenton 1988; Neuweiler 1990). The actual range of the
narrowband signal d e p e n d s on the intensity of the signal, the frequencies
27
T H E
U S E
OF
E D G E
H A B I T A T S
BY
C O M M U T I N G
A N D
F O R A G I N G
B A T S
/
C H A P T E R
emitted, the reflection properties of the target and the sensitivity of the
receiver. The serotine emits longer and louder pulses at lower frequencies
(appr. 27 kHz) than the pipistrelle (appr. 45 kHz for the average frequency of
the narrowband pulse type). Assuming that the reflection properties of the
vegetation and the sensitivity of the bats' ears for their respective peak
frequencies are equal, differences in sonar range result only from energy
absorption in the air, which increases exponentionally with frequency. This
could (partly) explain why pipistrelles on average fly nearer to landscape
elements than serotines do.
2. Foraging habitat
Another important aspect to be considered is the influence of linear elements
on insect-size distribution. Small and weak flying insects are more dependent
on the sheltering effect of vegetation than are larger and stronger flying
insects. Small insects usually swarm on the leeward side of vegetation,
whereas larger insects are able to move more independently of wind (Taylor
1974). Of the two species involved in this study, the serotine hunts for larger
insects such as beetles and moths (Labee & Voûte 1983;Robinson &Stebbings
1993), while the pipistrelle very often catches smaller insects, in particular
Chironomidae, but also smaller dipterans (Swift et al. 1985; Hoare 1991;
Sullivan et al. 1993). Differences in prey preference might explain why the
pipistrelle usually keeps close to the vegetation, while the serotine is
commonly observed in more open areas as well.
3. Shelter
Our analyses show two effects which might be explained by shelter of linear
elements either for bats or for insects. Firstly, our data show a relation
between the pipistrelle and the parameter 'height of an element'. Lewis
(1969a) demonstrated that the size of the sheltered area on the leeward side of
a hedgerow is related to its height. Compared to the neighbouring fields, the
aerial insect fauna on the leeward side of a hedgerow was enriched up to a
distance of 3-10 times the height of the hedgerow (depending on the angle
between the wind and the hedgerow). Secondly, the occurrence of serotines in
open areas decreases with wind-speed. Since the accumulation of insects
behind linear elements increases with wind-speed (Lewis 1969b), serotines
might move to more sheltered habitats in windy conditions.
Furthermore, the differences between both species can be explained by the
effect of wind on their flight efficiency. As mentioned before, a bat may prefer to fly
in wind-sheltered areas to diminish its flight cost. As the small pipistrelle is likely
to be more sensitive to wind than the serotine, the former is expected to stay closer
to trees.
The use of linear elements by bats may be affected by a combination of the
above mentioned factors, depending on the species, on the configuration of different
habitats in relation to the roost site and on wind direction and speed. The function
of linear landscape elements may therefore vary between different parts of a
landscape. Depending on the kind and distribution of foraging habitat for instance,
28
T H E
U S E
OF
E D G E
H A B I T A T S
BY
C O M M U T I N G
A N D
F O R A G I N G
B A T S
/
C H A P T E
linear elements might be used as a main foraging area in one part of a landscape and
as a commuting zone between colony and foraging area in another. Energy budgets
may play a role in balancing the costs of flying in more open areas with the gain in
insects.
RELATION TO LINEAR ELEMENTS
The results show a distinct difference between the two species in their relation to
linear elements. The pipistrelle is largely confined to linear elements, flying close to
the vegetation and infrequently crossing open areas. Pipistrelles are therefore
expected to spread along the network of linear elements in an area. As stated before,
it is thought that pipistrelle densities will increase proportionally to the density of
linear landscape elements in an area. However, such an increase in bat density will
not lead to an increase in the number of bats passing a randomly chosen observation
point.
Serotines do not show astrong preference for linear elements on a small scale.
The number of bat passes per observation point, however, is found to be positively
related to the density of linear elements in the l x l km squares. Apparently,
landscapes with a higher density of linear elements have higher densities of
serotines. A plausible hypothesis for this is found in a possible effect of overlapping
windbreak zones on the distribution of insects. In landscapes with a dense network
of linear elements such an overlap of windbreak effects of different elements may
occur (Forman & Baudry 1984). As large insects are able to control their flight up to
a greater height than smaller insects (Taylor 1974), they will more easily respond to
increased shelter. Moreover, strong flying species are less affected by temperature
and are therefore a more predictable food source in sheltered habitats (Karg &
Ryszkowski 1985). It is therefore possible that the serotine profits from a larger food
availability in more sheltered landscapes, not only along linear elements, but also in
open areas. The exploitation of open areas may be facilitated by the large sonar range
of the serotine bat.
Whether the overall density of bats is indeed affected by the density of linear
elements can only be confirmed by studying densities, sizes and distributions of
roosts in relation to landscape characteristics. In the study area, landscape elements
like woodlots and open water are not considered to play an important role as
foraging habitats (open water in the area mainly refers to ditches or streams with
equalized banks and little or no bank vegetation with recently planted hedgerows).
Frequent visits showed us that such elements, which are rare in the area, did not
attract many bats. If we want to make general statements about the relative
importance of linear elements to bats, we need to do studies in areas where other
potential foraging habitats play a more important role.
A major factor not included in our analyses might be the distance to a roost.
Distance effects will be more important when roost density is low and distances
between roosts are high compared to home range sizes. Our hypotheses are based on
the assumption that roost density is high enough to exclude significant distance
effects.
29
T H E
U S E
OF
E D G E
H A B I T A T S
BY
C O M M U T I N G
A N D
F O R A G I N G
B A T S
/
C H A P T E R
ISOLATION
The data show no evidence for effects of isolation of fragments of linear elements.
For serotine bats, which cross open areas relatively easy, isolation effects were not
expected. For pipistrelle bats, the presence in isolated, small fragments indicate that
open areas of 110-150 m wide do not form a serious barrier. The influence of
isolation on landscape exploitation can only be quantified when locations and sizes
of roosts (including male roosts) are known.
As pipistrelles were observed at two observation points in open areas only, it
seems plausible that open areas are crossed by commuting bats only on well defined
flight routes. This was also suggested by Kapteyn &Verheggen (1990). They found
that pipistrelles and long-eared bats (Plecotus auritus) were both equally abundant
in small and isolated woodlots (i.e. not connected to the surroundings by linear
elements) and in non-isolated woods.
In several parts of our country, we have indeed observed pipstrelle bats
crossing gaps between linear structures up to 200 m on their daily flight routes. The
observation points in open areas in our study area were, however, randomly
distributed and the probability of coinciding with flight paths, consequently, small.
The present study area has a relatively high density of linear landscape
elements. It would be interesting to know whether isolation effects will be more
evident when distances between fragments increase. Furthermore, we need more
information on the ecological consequences of altering the landscape structure.
Especially for bats using traditional flight routes, cutting linear landscape elements
may have serious implications for their possibilities to exploit an area.
30
T H E
U S E
OF
E D G E
H A B I T A T S
BY
C O M M U T I N G
A N D
F O R A G I N G
B A T S
/
C H A P T E R
3. Effects of food abundance and wind on the
occurrence ofpipistrelle bats Pipistrellus
pipistrellus and serotines Eptesicus serotinus
near treelines
Summary
I tested the hypothesis that the flying distance of pipistrelle bats Pipistrellus
pipistrellus and serotines Eptesicus serotinus from treelines can be explained by
food abundance and protection from wind. Foraging bats were monitored, and insect
abundance and wind were measured at fixed distances up to 50 m from treelines.
Different situations, with and without wind, and with low and high insect
abundance in the adjacent open areas, were compared. In the presence of wind and
low insect abundance in the adjacent open areas, peak occurrence of pipistrelles was
closer to the treeline than insect abundance peak, and both were closer to the
treeline than maximum wind shelter. At high wind-speeds or large incidence angles,
pipistrelles concentrated closer to the trees. The distance distributions of pipistrelles
and serotines were closely related to the insect distribution only when the treeline
was bordered by insect rich grassland. In all situations, pipistrelle occurrence
decreased with increasing distance to the treeline. This relation remained significant
after correction for wind shelter and insect abundance. Serotine showed no decrease
with distance to treeline. Pipistrelle bats commuting along a double row of trees flew
mainly between the treelines, regardless of insect abundance or wind shelter.
Predator avoidance is argued to be a constraint on movements of bats at relatively
high light levels. At high wind-speeds and large incidence angles, the proportion of
pipistrelle bats commuting on the leeward side increased. The results have
implications for the conservation of bats. Treelines are important to foraging bats
because they support relatively high insect abundance and protect bats from wind.
For bats commuting at dusk and dawn, an essential function of tree corridors may be
the protection from predators. A coherent network of tree corridors facilitates the
exploitation of potential feeding areas.
Introduction
The distribution of many bat species is known to be associated with edge habitats,
such as forest edges, forest lanes, treelines and hedgerows (Racey & Swift 1985;
Limpens et al. 1989; Krull et al. 1990; Rieger et al. 1990; Limpens &Kapteyn 1991;
De Jong 1994;Walsh & Harris 1996a/b; Verboom & Huitema 1997). Depending on the
species, these landscape elements are either used as flyways by commuting bats or
as feeding sites, or both. Hypothetical explanations for the use of edge habitats by
bats are:
Food. Insect availability isbelieved tobe one of the major factors determining
31
U S E
OF
E D G E
H A B I T A T S
BY
C O M M U T I N G
A N D
F O R A G I N G
B A T S
/
C H A P T E R
the distribution of insectivorous bats (Racey &Swift 1985; De Jong &Ahlén 1991).
Food might be a reason for bats to forage near hedgerows, treelines, and forest edges,
since insect densities are generally higher here (but not always; Ekman &de Jong
1996) than in nearby open areas (Lewis &Stephenson 1966; Lewis 1969a/b, 1970;
Lewis & Dibley 1970).
Shelter from wind. The influence of wind on commuting and foraging bats has
been reported in several studies (Nyholm 1965; Voûte 1972; Racey & Swift 1985;
Rieger et al. 1990). To minimize flight costs, it is profitable for a bat to avoid
exposure to wind (Norberg & Rayner 1987; Norberg 1990).
But what happens when there is no wind, or when insect abundance in
neighbouring open areas is relatively high and differences between the treeline and
adjacent open area become small? According to Ekman & De Jong (1996), pipistrelle
bats still preferred the edges of forests to the open areas, although insect abundance
was higher in the latter. This suggests the involvement of one or more other factors
limiting the use of space by these bats.
There are two alternative explanations. First, risk of prédation may explain
why many bats avoid open areas and stay close to vegetation, where they are less
conspicuous than in open terrain. Indeed, mortality due to prédation, mainly by
owls, may be considerable (Speakman 1991),and prédation pressure is often thought
to affect bat behaviour (Rieger et al. 1990;DeJong 1994;Rydell et al. 1996). Prédation
risk is believed to be highest when light levels are high (Rydell et al. 1996), that is
during dusk and dawn or at high latitudes, and where many bats can be expected to
be present at relatively high densities, that is near roosts or on commuting routes
(Fenton et al. 1994).
A second hypothesis, suggested by Limpens et al. (1989) and Limpens &
Kapteyn (1991), states that bats use landscape elements as navigational landmarks,
and, consequently, maintain acoustic contact with landscape elements. The limited
echolocation range of bats would then constrain bats in the use of open areas.
In this study, I tested whether the occurrence of pipistrelle bats, Pipistrellus
pipistrellus (Schreber, 1774), and serotines, Eptesicus serotinus (Schreber, 1774),
near treelines can be explained by (1) food abundance and (2) protection from wind.
The 'food hypothesis' predicts that the bats hunt where food is most abundant. The
'wind hypothesis' predicts that bats fly where wind reduction by the treeline is
highest. The distribution of foraging pipistrelles and serotines in relation to treelines
was compared to insect abundance and wind (speed and direction). Different
situations, with and without wind, and with low and high insect abundance in the
adjacent open areas, were compared.
Study sites and methods
STUDY SITES
One study area, referred to as site "meadow-NL", was in the south-western part of
The Netherlands (51°27'N, 3°38'E), approximately 2 km east of Oost-Souburg
(Walcheren, province of Zeeland). In this agricultural area, with approximately 60%
fields and 40% intensively managed (grazed and hay) meadows, there is a network
of treelines, mainly along roads. The study site was located near a double treeline
32
T H E
U S E
OF
E D G E
H A B I T A T S
BY
C O M M U T I N G
A N D
F O R A G I N G
B A T S
/
C H A P T E R
bordering a 3-m w i d e , paved road. Adjacent open areas on both sides were hay
m e a d o w s with some low-density grazing where Lolium perenne was the dominating
species. The average tree height was 9 m. Tree species at the study site were
Carpinus betulus a n d Fraxinus excelsior. U n d e r n e a t h the trees there was a 3-4 m
(mean 3.5 m) high b u s h layer with Carpinus betulus, Fraxinus excelsior,
Crataegus
monogyna and Salix alba. Permeability of the treeline was visually estimated to be
2 0 % at the b u s h layer a n d 70% between the b u s h layer and the tree crowns, between
3.5 and 5 m above the ground.
Another study area was in the Mazury district in north-eastern Poland
(53°87'N, 21°66'E), north of the Urwitatt Biological Station of the University of
Warsaw. Approximately 5 0 % of agricultural land in this area are crop fields (mainly
cereals) and 5 0 % extensively managed (grazed and hay) m e a d o w s , generally rich in
herbs and insects. A few woodlots are present, a n d a network of, mostly double,
treelines border m a n y of the roads. Measurements took place near two treelines, the
first bordered by an insect rich grassland with a variety of herbs (site 'meadow-PL'),
a n d the second bordered by cereal crop fields [Triticum aestivum and Avena sativa;
site 'field-PL'). Mean tree height was 11 m at site meadow-PL and 13 m at site fieldPL, w i t h bare trunk for the first few meters above the ground. The treeline at site
meadow-PL was d o m i n a t e d by Tilia species, whereas Acer pseudoplatanus
was the
m a i n species at site field-PL.
SAMPLING METHODS AND TECHNIQUES
The study was confined to the pipistrelle bat ("46 kHz p h o n i c type", Jones & Van
Parijs 1993) and the serotine. As defined in this paper, commuting bats travel
between their roost and foraging sites, whereas foraging bats remain at a particular
area for some time to feed on insects. The flight of commuting bats is more straight
a n d flight speed is higher than in foraging bats (Jones &Rayner 1989; Britton et al.
1997). Commuting bats were surveyed at dusk until 1.5 h after sunset. Foraging bats
were surveyed from 1.5 h after sunset to 1.5 h before sunrise.
From May to August 1995, foraging bats at site meadow-NL were sampled at
fixed points along a line perpendicular to the treelines (1) at distances of 3, 6, 9, 12,
24, and 48 m on the leeward side, (2) between the treelines, and (3) at 3 m at the
w i n d w a r d side. At sites meadow-PL and field-PL, sample points were on the
leeward side only at distances of 3, 12, 24, and 48 m. To overcome time effects, point
samples were taken in r a n d o m sequence.
At each point, I counted bats, measured w i n d - s p e e d a n d sampled the aerial
insect fauna. At sites meadow-PL and field-PL, bat a n d insect samples were
collected during calm nights only (wind-speed <0.2 m/s). Passes of pipistrelle bats
and serotines were scored during five-minute periods, and the amount of time bats
were detected was also recorded. USA mini-2 bat detectors (Ultra S o u n d Advice,
London, UK) were used at site meadow-NL and Pettersson D-100 detectors
(Pettersson Elektronik, Uppsala, Sweden) at the Polish sites, both with h e a d p h o n e s .
To restrict the detection to the direct surroundings of the sample point, the detection
was concentrated by mounting a h o r n (QMC mini-2) or an a l u m i n i u m device
(Pettersson D-100). Detectors were pointed u p w a r d s at chest height.
Wind-speeds were measured with a sensitive cup-anemometer, placed on a
tripod at a height of 1.80 m. The incidence angle of the w i n d was defined as the
33
U S E
OF
E D G E
H A B I T A T S
BY
C O M M U T I N G
A N D
F O R A G I N G
B A T S
/
C H A P T E R
angle between the w i n d direction and the treeline (parallel to treeline = 0°,
perpendicular = 90°). Wind-speeds in open area were measured before, half-way and
after each series of samples, at 50 m from the treelines on the w i n d w a r d side. The
relative wind-speed per sample point was defined as the the local wind-speed
divided by the wind-speed in open area on the w i n d w a r d site.
After each bat count, insects were sampled w i t h a hand-net (diameter 0.45 m;
Bioquip, Gardena, CA, USA). Samples were taken by standardized sweepnetting
along a 30 m long transect parallel to the treeline. We took 100 sweeps while walking
in one direction, and another 100 while returning to the starting point. M i n i m u m
and m a x i m u m height of each sweep were 2 and 3.5 m above the ground. Contents of
sweepnets were placed in ethyl-acetate jars until the insects were dead, then
transferred to labelled jars with alcohol (30%) for assessment of numbers and dry
weight (biomass) per sample.
At site meadow-NL, commuting pipistrelle bats were counted visually and
with bat detectors at a small gap (5 m) in the treelines. The end of the commuting
period was defined by the absence of c o m m u t i n g bats for at least 10 m i n u t e s or by
increased foraging activity (feeding buzzes, bats flying into the opposite direction).
Just before and just after the commuting period, insects were sampled and windspeed was measured both between the treelines and on the leeward side at 3 m from
the treeline.
DATA ANALYSES
To test whether distribution maxima of pipistrelles were equal to maxima of insect
density and m i m i m a of relative wind-speed, I calculated bootstrap confidence limits
on the distances between the m o d i in each pair of distributions. For this, I applied
the bias-corrected and accelerated (BCa), nonparametric bootstrap as described by
Efron &Tibshirani (1993) with 1000 iterations.
Regression analyses a n d bootstrap analyses were d o n e w i t h GENSTAT
(Genstat 5 Committee 1993, 1995). For remaining statistical tests I used STATISTIX
(vs. 4.0; Analytical Software, St. Paul, MN).
Results
BATOCCURRENCE
All of the three study sites were used as commuting corridors and foraging sites as
well. The pipistrelle bat was the most a b u n d a n t species. Serotines occurred at sites
meadow-PL and field-PL only. At site meadow-NL, pipistrelles used the treeline as
one of the m a i n commuting corridors between their roosts in the nearby village of
Oost-Souburg, approximately 2 km from the site, a n d foraging sites along the
treelines and in a woodlot approximately 1.3 km from the site.
The nearest pipistrelle maternity roosts from sites meadow-PL and field-PL
were at 0.8 and 0.7 km respectively. Serotine roosts were at 0.8 km from site
meadow-PL and at 1-2 km (exact location not known) from site field-PL. Foraging
sites of both species were along treelines a n d woodlot edges, and along the edges of
lakes and ponds.
34
T H E
U S E
OF
E D G E
H A B I T A T S
BY
C O M M U T I N G
A N D
F O R A G I N G
B A T S
I
C H A P T E R
3
BAT OCCURRENCE IN RELATIONTO INSECTABUNDANCE AND WIND
Figure 3.1 shows the distance distributions of mean pipistrelle occurrence, insect
density, and relative wind-speed at site meadow-NL at wind-speed >0.2 m/s (n=32).
Since calm nights (wind-speed <0.2 m/s, n=7) at this study site were scarce and bat
activity during these nights very low (lower than at wind-speeds >0.2 m/s; t-test,
MEADOW-NL
pipistrelles
road
3
6
insects
3
road
3
9
12 24 48
wind
3
road
3 6 9 12 24 48
distance to trees (m)
Figure 3 . 1 .
Distance distributions of pipistrelle occurrence, insect density and relative wind-speed
(n=32, wind-speed >0.2 m/s) near adouble treeline at site meadow-NL.
35
THE
U S E OF
E D G E
HAI
C O M M U T I N G
A N D
F O R A G I N G
B A T S
C H A P T E R
P<0.05), data analyses at site meadow-NL were restricted to wind-speed >0.2 m/s
(see next section for analyses of data in absence of wind at Polish sites).
Figure 3.1 shows that pipistrelle occurrence on the leeside was mainly
confined to the range 3-12 m from the trees, and was significantly lower at 24 and
48 m (t-test, significant drop between 12 and 24 m, P<0.005). Pipistrelle occurrence
and insect numbers had maximum values at 3 and 6 m respectively; minimum
relative wind-speed was at 24 m from the treeline. Bootstrap analyses show that, at
the 5% significance level, maximum pipistrelle occurrence was significantly closer
to the treeline than maximum insect abundance, and that both these maxima were
significantly closer to the trees than the minimum relative wind-speed.
The relation between the distance distributions of pipistrelle occurrence,
insect density (numbers per sample) and relative wind-speed (Fig.3.1) on the leeside
was tested by multiple regression analyses. Insect density and relative wind-speed
were not significant in the analyses when tested separately (Table 3.1). The factor
'distance to treeline' significantly reduced the variation in pipistrelle occurrence.
This indicates that, within 50 m from the trees, the vertical distribution of
pipistrelles was not associated to the distributions of insect abundance or relative
wind-speed, but to one or more other, distance-related, factors.
Both the velocity and the direction of the incident wind affected the distance
distribution of pipistrelles at site meadow-NL (Fig. 3.2a,b). Wind-speeds at site
meadow-NL ranged from 0 to 5.6 m/s (mean 1.6 m/s, s.d.=1.3, n=39). There was no
difference in mean pipistrelle occurrence between low (0.2-1.5 m/s) and high windspeeds (>1.5 m/s). At low and high wind-speeds, occurrence on the leeside was
lower at 24 and 48 m compared to 3-12 m from the trees (t-tests, significant drop
between 12 and 24 m, P<0.005). Mean occurrence on the leeside at angles of
incidence of 45°-90° (n=22) was higher than at smaller angles (n=10;t-test, P<0.005).
Linear regression showed that bat occurrence on the leeside increasingly
concentrated near the treeline with both increasing wind-speed and increasing
incidence angle. The slope of the regression line of the distance distribution (with
the total number of bats per series as a weighting variable) was positively related to
wind-speed (mean per series; coeff.=-0.439, s.e.=0.185, R 2 =13.2%, P<0.05) and
incidence angle (coeff.=-0.036, s.e.=0.013, R 2 =17.8%, P<0.01).
Table3.1.
Linear regression analyses of insect abundance (numbers and biomass per sample),
relative wind-speed and distance to trees on pipistrelle occurrence (recorded sound per 5
minutes) at site meadow-NL. Data were collected at wind-speeds >0.2 m/s.
MEADOW-NL
insect numbers (Al)
insect biomass (A2)
relative wind-speed (B)
distance to trees (C)
A1+A2+B+C
*last parameter only
36
REGRESSION
COEFFICIENT
-0.214
64.083
0.088
-Ü.756
-0.719*
STANDARD
ERROR
R2
0.228
381.930
0.118
0.185
0.184*
_
-
0.08
0.08
P
>0.05
>0.05
>0.05
0.0001
0.0001*
T H E
U S E
OF
E D G E
C O M M U T I N G
H A B I T A T S
A N D
F O R A G I N G
B A T S
/
C H A P T E R
L"_ _ J <0.2
a
120
100
80
60
II|j11L.._
12
24
40
20
0
48
,lll i
6
9
12
24
48
distance to treeline (m)
Figure3.2.
Pipistrelle distance distributions near a double treeline at site meadow-NL (a) at different
wind-speeds: <0.2 m/s (n=7), 0.2-1.5 m/s (n=16) and >1.5 m/s (n=16), and (b) at different
incidence angles: <45° (n=10), >45° (n=22).
Pipistrelle occurrence at 3 m from the trees on the leeward side was on
average higher than on the windward side (Fig. 3.1;t-test: P<0.005, n=32). However,
at wind-speeds <1.5 m/s and at incidence angles <45°, differences were not
significant whereas at wind-speeds >1.5 m/s (t-test, P<0.05) and incidence angles
>45° (P<0.005) occurrence on the windward side was much lower (Fig. 3.2).
BATOCCURRENCE IN RELATIONTO INSECTABUNDANCE INABSENCE
OFWIND
Mean insect abundance at site meadow-PL exceeded that of site field-PL (Fig. 3.3; ttest, P<0.05 (numbers) and P<0.005 (biomass)). Mean insect density and biomass on
the leeward side at site field-PL equalled those of site meadow-NL (t-tests, P>0.05).
At all three sites, nematoceran Diptera made up approximately 90% of insect
numbers.
Figure 3.4 shows pipistrelle, serotine and insect distance distributions at sites
meadow-PL and field-PL. Absolute differences in bat occurrence between both sites
were assumed to be related to the distance to the respective roosts and were not
taken into account. At both sites,pipistrelle occurrence at 24and 48 mwas relatively
high compared to site meadow-NL (see Fig. 3.1).
At site meadow-PL, pipistrelle occurrence was significantly related to insect
numbers (Table 3.2;linear regression). At site field-PL, there was no relation to insect
parameters. At both sites, the parameter 'distance to treeline' significantly decreased
the variance in pipistrelle occurrence.
Serotines showed different distribution patterns at sites meadow-PL and
37
T H E
U S E
OF
E D G E
H A
C O M M U T I N G
NO WIND
A N D
F O R A G I N G
C H A P T E R
WIND
30
n-159
n-169
E
20
n=123
10
NO WIND
10
WIND
n-159
Ol
E
n-123
E
o
n=169
meadow-PL
field-PL
meadow-NL
Figure 3.3.
Insect abundance (mean numbers and biomass per sample) at the three study sites.
Values ± s.d.are averaged over distances 3, 12,24, and 48 m from the treelines.
field-PL (Fig. 3.4). As with pipistrelles, serotine occurrence was related to insect
n u m b e r s at site meadow-PL only (Table 3.3). In contrast to pipistrelles, there was no
relation between serotine occurrence a n d 'distance to treeline'.
COMMUTING BATS
The majority of commuting bats at site meadow-NL passed between the treelines,
flying in a straight line about halfway the trees at a height of 2.5-3.5 m above the
road. This was just below the top of the 3.5-4 m high layer of bushes. As
demonstrated by wind-speed measurements at heights of 3 a n d 4.5 m, there was
approximately three times more w i n d at 4.5 m. However, at a height of 1.8 m, the
average wind-speed was only 6 0 % compared to the one at 3 m.
The n u m b e r of passing bats per evening ranged from 5 to 54 (mean 23.9,
38
T H E
U S E
OF
E D G E
H A I
C O M M U T I N G
A N D
MEADOW-PL
F O R A G I N G
C H A P T E R
FIELD-PL
pipistrelles
3
12
24
48
3
12
24
48
serotines
III. Uli.
3
12
24
48
3
12
24
48
insects
12
24
48
3
12
24
48
distance to treeline (m)
Figure 3.4.
Distance distributions of pipistrelle bat occurrence, insect density and insect biomass
during calm nights near a double treeline at site meadow-PL (n=44) and site field-PL
(n=51). Vertical bars represent standard deviations.
s.d.=12.2, n=39).An average of 81% ofthe bats passed over the road between the tree
lanes, 2% on the windward side and 17% on the leeward side. Logit regression
showed that the proportion ofbats commuting along the leeward side increased with
wind-speed (coeff.=0.898, s.e.=0.084, P<0.0001) as well as with incidence angle of
the wind (coeff.=0.0281, s.e.=0.004, P<0.0001) at the tree lane (Fig. 3.5).
Table 3.4 shows the number of commuting pipistrelles, insect abundance and
wind-speed between the treelines and on the leeward side during twelve evenings.
39
THE
USE OF
EDGE
HAI
C O M M U T I N G
A N D
F O R A G I N G
C H A P T E R
The large proportion of pipistrelles commuting between the treelines (84%) as
compared totheleeward side during these twelve evenings, wasnotexplained by
either wind-speed or insect abundance. While bats flew more often between the
treelines than ontheleeward side (sign test, n=12, P<0.01), wind-speed waslower
(P=0.05) andinsect abundance was more often higher (P<0.05) ontheleeward side
than between the treelines.
Table 3.2
Linear regression analyses of insect abundance (numbers and biomass per sample) and
distance to trees on pipistrelle occurrence (recorded sound per 5minutes) at sites
meadow-PL and field-PL. The parameter 'relative wind-speed' is not included as data
were collected during calm weather (wind-speed <0.2 m/s).
MEADOW-PL
insect numbers ( A t )
insect biomass (A2)
distance to trees(C)
A1+A2+C
FIELD-PL
insect numbers ( A t )
insect biomass (A2)
distance t o trees(C)
A1+A2+C
REGRESSION
COEFFICIENT
0.119
69.26
-0.077
-0.067*
STANDARD
ERROR
0.037
599.900
0.033
0.033*
R2
0.06
-
0.03
0.09
REGRESSION
COEFFICIENT
STANDARD
ERROR
R2
0.053
-220.578
-0.177
-0.180*
0.061
210.070
0.041
0.0414*
-
0.10
0.12
P
<0.005
>0.05
<0.05
<0.05*
P
>0.05
>0.05
<0.0001
<0.0001*
* last parameter only
Table 3.3.
Linear regression analyses of insect abundance (numbers and biomass per sample) and
distance to trees on serotine occurrence (recorded sound per 5minutes) at sites meadowPLand field-PL. The parameter 'relative wind-speed' is not included asdata were
collected during calm weather (wind-speed <0.2 m/s).
MEADOW-PL
insect numbers ( A l )
insect biomass (A2)
distance to trees(C)
A1+A2+C
FIELD-PL
insect numbers ( A l )
insect biomass (A2)
distance to trees(C)
A1+A2+C
* last parameter only
40
REGRESSION
COEFFICIENT
0.133
213.075
-0.027
-0.005*
REGRESSION
COEFFICIENT
0.016
7.017
-0.023
-0.02189*
STANDARD
ERROR
0.043
108.200
0.044
0.042*
STANDARD
ERROR
0.023
92.131
0.018
0.018*
R2
0.08
0.04
-
0.10
R2
-
P
<0.005
0.05
>0.05
>0.05*
P
>0.05
>0.05
>0.05
>0.05*
THE
USE OF EDGE
HAI
C O M M U T I N G
a
•o
m
F O R A G I N G
C H A P T E R
•xp(-3.447+0.898Jt)
.
80
A N D
t*«p(-3.447+fl.8MjO
J^~
7
m
*
80
•
•
>/
e
a
40
3
F
fa
8
*
s
20
'•
0
/
.
• _^-"^
•v ^ —
7
—•—<. %
.
•
1
.
2
.
i
3
4
vrind-spMd(m/s)
ou
b
80
Mtp(-*.401**.att1j<)
eo
40
••
1*wp(<t^01-H>.QNlJC)
•
•
-
20
•
•
•
•
0
•
•
m '»
»J
16
30
L
46
I
i
•
—L-«
60
76
•
90
Incldmc* »ngl« (*)
Figure3.5.
The proportion of bats commuting along the leeward sideatdifferent wind-speeds (a)
and incidence angles (b). Logit regression yield positive fits ofboth wind-speed
(P<0.0001) and incidence angle (P<0.0001).
Table3.4
Number ofcommuting pipistrelles, insect numbers (mean ofsamples just before and just
after the migratory period) and wind-speed between the treelines and on the leeward
side on twelve evenings atsite meadow-NL; AOI=angle of incidence.
June 27
July 3
July4
July 6
July10
July12
July 17
July18
July20
July24
July25
July27
PIPISTRELLES
(n COMMUTING)
INSECTS
(n PER SAMPLE)
ROAD
LEE
ROAD
6
5
5
25
14
24
16
4
7
17
5
18
0
2
5
5
2
1
1
4
0
1
5
1
81
50
9
14
21
46
16
2
149
19
25
12
LEE
153
5
51
27
51
57
16
25
64
160
83
16
WIND
SPEED( m/s)
ROAD
LEE
0.06
0
0.73
1.07
0.89
0
1.08
1.49
0
0.33
1.23
0.62
0.001
0.915
0.89
0.62
0.63
0
1.03
1.25
0
0.27
1.12
0.32
WIND
AOI(°)
51
0
6
85
74
-
85
85
-
40
62
51
41
T H E
U S E
OF
E D G E
H A B I T A T S
BY
C O M M U T I N G
A N D
F O R A G I N G
B A T S
/
C H A P T E R
Discussion
WIND SHELTERAND INSECTABUNDANCE
The present study demonstrates that the distance distribution of pipistrelles near
treelines is affected by both insect a b u n d a n c e a n d w i n d (speed and direction), and
that the relative importance of these factors varies d e p e n d i n g on the situation.
The hypotheses underlying this study predict that the occurrence of bats is
maximal where insect a b u n d a n c e is maximal and relative w i n d - s p e e d is minimal.
Clearly, the distance distribution of pipistrelle bats was different from the w i n d
shelter distribution (Fig. 3.1). The relative w i n d - s p e e d at site meadow-NL showed a
m i n i m u m at 24 m from the treeline, although the real m i n i m u m may have been
a n y w h e r e between 12 and 48 m. This is about three times the height of the treeline,
w h i c h agrees with w i n d shelter patterns a r o u n d windbreaks found by others (e.g.
Nägeli 1946; Lewis &Stephenson 1966; Lewis &Dibley 1970).
Since w i n d strongly affects the distribution of insects (e.g. Lewis 1970), a
correlation between the distribution of insects and w i n d shelter is expected. This is,
however, not the case in Figure 3.1 and can be explained by the fact that aerial insect
distributions near treelines are the result of accumulation of insects w h i c h have
passively been blown from the w i n d w a r d side to leeward, and from insects
originating from the trees and from the grassland or field as well. The first category
of insects is expected to follow the w i n d shelter pattern, while the second and third
categories respectively will show distribution patterns w h i c h are more biased
towards the treeline and w h i c h are more evenly spread across the open area (Lewis
1970). Thus, assuming that the aerial entomofauna has representatives of all three
categories, m a x i m u m insect densities at site meadow-NL are expected to be found
somewhat closer to the treeline than the w i n d shelter pattern w o u l d predict.
VERTICAL ELEMENTS ASACOUSTICAL LANDMARKS
After correction for insect a b u n d a n c e and w i n d , a strong relationship of bat
occurrence to the distance to the treelines was found. An explanation for the spatial
relation of bats to treelines is that bats use treelines as acoustic landmarks a n d hence
remain in contact with treelines by echolocation.
Insectivorous bats use echolocation to detect and approach prey and to avoid
obstacles. Many members of the family Vespertilionidae seem to perform these tasks
w i t h i n several meters from the bat, although the function of background echoes as
guideline signals may be possible (Neuweiler 1990; Kalko & Schnitzler 1993). Even
so has it been suggested that bats use vertical elements as landmarks in their
orientation and that echolocation range is a possible constraint on the use of open
areas (Limpens et al. 1989; Limpens &Kapteyn 1991). Indications that bats maintain
contact by echolocation with landscape elements come from a study on commuting
p o n d bats, w h i c h gradually adapted their pulse durations and interpulse intervals to
the distance to canal banks (Verboom et al. u n p u b l i s h e d results).
Our data of pipistrelle occurrence in relation to vertical elements support the
idea that the distribution near vertical elements is determined by echolocation
range. If we assume that the duration of interpulse intervals determines the
m a x i m u m distance over w h i c h bats can perceive objects while avoiding overlap
between returning echoes and pulse emissions, it is possible to predict the distance
42
T H E
U S E
OF
E D G E
H A B I T A T S
BY
C O M M U T I N G
A N D
F O R A G I N G
B A T S
/
C H A P T E R
where the bat loses contact with an object. Since sound travels approximately 0.34
m in 1 ms, an average search phase interpulse interval of pipistrelle bats foraging
near treelines of 80-98 ms (Ahlén 1990; Kalko & Schnitzler 1993; Vaughan et al.
1997; Verboom unpublished data) corresponds with 13.6-16.7 m. This agrees with
the sudden drop in occurrence between 12 en 24 m from the treeline at site meadowNL.
The predicted drop in pipistrelle occurrence was less obvious at the Polish
sites (Fig. 3.4). This holds for the serotine as well. The serotine emits signals with an
average search phase interpulse interval of 116-150 ms, although longer intervals are
common (Ahlén 1981, 1990; Vaughan et al. 1997). These values would correspond
with an expected drop in serotine occurrence at 20-25.5 m from the trees (or more
when longer intervals are considered).
Bats are, however, frequently found commuting and foraging in open areas,
well outside the range where they can perceive landscape elements by echolocation
(Kalko &Schnitzler 1993; De Jong 1994; Verboom &Huitema 1997; Verboom et al.
unpublished results). This was also the case at the Polish sites. Here, the occurrence
levels of both species at 24 and 48 m was high as compared to site meadow-NL. This
implies that constraints by echolocation are not very strict, or that vision plays a
role. This raises the question whether there are benefits of staying in acoustic contact
with landscape elements? Assuming that landmarks play a role in their spatial
orientation, bats which are active outside the range where perception of landscape
elements by echolocation is possible, may have to spend extra time in finding the
way back to familiar landmarks. Staying within acoustic range would hence save
time which can be allocated to other activities like foraging. When insect abundance
increases, bats may be more inclined to leave contact with landmarks. Although the
bat has to invest more time in orientation and navigation then, this may be
outweighed by the benefits of more efficient foraging.
PREDATOR AVOIDANCE
The potential threat of predators may be another explanation for the occurrence of
bats near treelines. When prédation risk is increased where food is most abundant,
more time may be allocated to predator avoidance (Milinski 1986). The impact of
prédation by avian predators on bat populations may be considerable, as suggested
in a study in Britain where the annual mortality due to prédation, mainly by owls,
was estimated to be 11.1% (Speakman 1991). Hence, predator avoidance may be a
major reason for bats to commute and forage in environments where they are less
conspicuous and more likely to escape attacks, e.g. near treelines and forest edges
(Rieger et al. 1990; De Jong 1994). Since owls and birds of prey hunt by vision, it is
plausible that at decreasing light levels, prédation risk becomes less significant.
Moreover, commuting bats using regular flight routes are a more predictable prey
source for predators than are hunting bats with activity patterns varying in time and
space, and are therefore more vulnerable to prédation (Fenton et al. 1994). In fact,
behavioural changes at diminishing light levels have been observed in several
species. For example, commuting lesser horse-shoe bats
Rhinolophus
ferrumequinum (Schreber, 1774) progressively increased their flight height as it
became darker (H. Schofield personal communication). Other species have been
observed to shift their hunting activities to more open environments as darkness
43
T H E
U S E
OF
E D G E
H A B I T A T S
BY
C O M M U T I N G
A N D
F O R A G I N G
B A T S
/
C H A P T E R
increased after dusk [Pipistrellus pipistrellus and Myotis daubentonii, Rydell et al.
1994), or in the course of summer as the nights became progressively darker (Myotis
mystacinus and M. daubentonii, Nyholm 1965). A similar shift from a sheltered to a
more exposed environment took place in this study, where the majority of
pipistrelles commuted between the treelines, while most foraging activity was on the
more exposed leeward side. Only high wind-speeds and incidence angles close to
90° supposedly forced the bats to commute along the leeward side.
FLIGHT HEIGHT OFCOMMUTING BATS
Most commuting pipistrelles passed at a mean height of 2.5-3.5 m above the road
between the treelines. Flying higher would be more costly, since the permeability of
the vegetation between the bush layer and the tree crowns would increase from
approximately 20% to 70%, and the bats would catch more wind. Flying even
higher, between the tree crowns, would not allow for straight flight and would hence
reduce flight speed.
But why not fly lower than 2.5 m? In spite of reduced wind-speeds bats
attained a flight height just below the top of the bush layer. One explanation would
be that bats keep a minimum distance when flying parallel to objects (vegetation,
ground) to avoid pulse-echo overlap. The minimum distance is determined by the
length of the emitted pulses. For a pipistrelle emitting pulses with an average
duration of approximately 5.5 ms (wideband mode; Kalko & Schnitzler 1993), a
minimum distance of 5.5 x 0.17 m = 0.94 m from the ground and the vegetation on
the sides would be required. According to Kalko & Schnitzler (1993) pulse-echo
avoidance could explain why pipistrelles usually keep a distance of at least 2m from
large obstacles.
SIGNIFICANCE FOR BAT CONSERVATION
The conclusions of this study have implications for the conservation of bats and
their habitats. Treelines are important to foraging bats since they support relative
high insect abundance and provide shelter from wind. High insect abundance in
adjacent open areas may promote the exploitation of open areas.
An essential function of tree corridors for commuting bats during dusk and
dawn may be the protection from predators. This may be especially important in
areas where bats have to travel long distances to reach good foraging sites, or at high
latitudes where dusk and dawn periods are relatively long. A coherent network of
tree corridors may hence help bats on their way to foraging grounds to exploit an
area in an efficient way.
Furthermore, this study suggests an acoustical function of treelines for bats.
Gaps in a network of linear vegetation corridors may thus become barriers and
hinder bats in exploiting potentially good feeding areas.
44
T H E
U S E
OF
E D G E
H A B I T A T S
BY
C O M M U T I N G
A N D
F O R A G I N G
B A T S
/
C H A P T E R
4. Flight performance, echolocation and foraging
behaviour in pond bats, Myotis dasycneme
(Chiroptera: Vespertilionidae)
Summary
Flight performance and echolocation behaviour of the pond bat, Myotis dasycneme
(Boie, 1825), were investigated over canals and a lake in The Netherlands. Multiflash stereophotogrammetry, linked with synchronous recording of echolocation
calls, was used to reconstruct the three-dimensional flight paths.of bats and to
correlate flight behaviour with changes in pulse emission during echolocation.
Echolocation calls during commuting flight at the canal were sigmoidal in structure,
with an initial steep frequency modulated (FM) sweep followed by a more shallow
sweep, ending with a second, rapid FM sweep. Similar calls were produced during
the search phase of foraging, though longer duration quasi-CF (constant-frequency)
calls, with longer interpulse intervals and much reduced initial and final FM
sweeps, were produced by bats hunting over a large lake. Overall, calls were
Preparing the multi-flash equipment on acanal bank (photo: Ben Verboom).
45
T H E
U S E
OF
E D G E
H A B I T A T S
BY
C O M M U T I N G
A N D
F O R A G I N G
B A T S
/
C H A P T E
generally lower in frequency, with significantly longer pulse durations and
interpulse intervals, compared with those of smaller trawling Myotis bats. Flight
speeds were compared with predicted optima from aerodynamic models.
Commuting bats exceeded predicted maximum range speed, which was
considerably higher than that noted for other smaller species of trawling Myotis.
Flight speed was significantly higher closer to the roost, at a narrower canal site. A
negative correlation between wingbeat frequency and flight speed, and a facultative
1:1 link between pulse emission and wingbeat during search phase were established.
During commuting, the bats flew at aheight above that which would normally confer
substantial power savings through ground effect. Itis argued that, by flying at a lower
height, bats would compromise commuting speed. Echolocation calls produced
during attempted prey capture were remarkably similar in design to those produced
by those other Myotis species that forage in a similar fashion. Prey was detected at 2
m, and reaction distance was 1.8 m. Evidence of a physiological limit on pulse
duration and interpulse interval during prey capture is presented. Overlap of
emitted pulse and received echo may degrade the performance of echolocation in
many bats, and overlap is generally avoided in M. dasycneme except perhaps when
the bat is very close to the prey item.
Introduction
The flight and echolocation behaviour of bats under field conditions (Fenton & Bell
1981; Jones & Rayner 1988, 1989, 1991;Acharya & Fenton 1992; Kalko &Schnitzler
1993; Schnitzler et al. 1994; Kalko 1994, 1995) has recently been studied to
complement work in a controlled, artificial environment (Heblich 1986; Hartley et
al. 1989; Thomas et al. 1990; Faure & Barclay 1994; Marimuthu et al. 1995). There is
good reason for this, as echolocation and behaviour under relatively confined
conditions may differ in comparison with natural situations (Griffin 1958; Sales&
Pye 1974). Obtaining reliable information on the echolocation and foraging
behaviour of free-living bats is technically difficult, however.
The few field studies on prey capture in insectivorous bats often use the
technique of multi-flash photography, whereby multiple images of a single bat reveal
information such as flight style and wingbeat frequency over a short time period
(Schnitzler et al. 1987; Jones & Rayner 1988, 1991;Kalko & Schnitzler 1989a; Kalko
&Braun 1991;Surlykke et al. 1993; Kalko 1994, 1995). Echolocation calls recorded
simultaneously can be linked to specific images on the photographs, enabling
correlations to be made between flight and echolocation. Stereophotogrammetry
allows three-dimensional positional information of all objects within the
photographic field of two cameras to be reconstructed mathematically (e.g. Wolf
1983; Spedding et al. 1984; Rayner & Aldridge 1985).
The behavioural ecology of the pond bat, Myotis dasycneme (Boie, 1825), has
been little studied. Previous work has looked in detail at roost ecology (Voûte 1972),
and more briefly at echolocation calls (Ahlén 1979, 1981, 1990; Kapteyn 1993) and
flight speed (Baag0e 1987). A review of current knowledge for this species is given
by Kapteyn (1995). The trawling mode of foraging of the pond bat is common to
other members of the subgenus Leuconoë (Findley 1972). As well as taking insects
46
T H E
U S E
OF
E D G E
H A B I T A T S
BY
C O M M U T I N G
A N D
F O R A G I N G
B A T S
/
C H A P T E
in flight by aerial hawking, the bats h u n t over water, scooping insects from the
surface with their feet and interfemoral m e m b r a n e . Although previous studies have
investigated the trawling bats Myotis daubentonii (Jones & Rayner 1988; Kalko &
Schnitzler 1989a) and Myotis adversus (Jones & Rayner 1991), this is the first to
detail the commuting and foraging flight of the p o n d bat, and to compare it with
other trawling Myotis bats, with the aim of finding general conclusions about flight
and echolocation in these bats.
Here we describe flight performance and echolocation calls of p o n d bats. We
compare the flight and echolocation of bats flying along two canals of different
widths, and over a larger lake. We compare commuting behaviour with foraging
behaviour. Specific questions asked in this investigation include whether flight
speed corresponds with that predicted from aerodynamic models, a n d w h e t h e r
pulse emission and wingbeat are coupled w h e n bats are searching for prey (the
search phase of echolocation) (Kalko 1994). A 1:1 link is expected in bats w h i c h h u n t
by aerial hawking or w h i c h emit intense, short duration echolocation calls (Jones
1994), because the coupling of calling with flapping allows the production of highenergy s o u n d pulses at no extra cost to the energetic cost of flight (Speakman &
Racey 1991). Avoidance of pulse-echo overlap seems to occur throughout
interception buzzes (echolocation call sequences during attempted prey capture,
where pulse repetition rate increases dramatically) in bats that emit short duration
echolocation calls (Kalko &Schnitzler 1989a, 1993). Overlap is avoided because it it
presumably difficult to process a faint echo while emitting an intense call, especially
since muscular (Henson 1965) a n d neurophysiological (Suga & Schlegel 1972)
m e c h a n i s m s reduce hearing sensitivity during calling. We determine w h e t h e r pulseecho overlap occurs during prey capture in the p o n d bat.
Breeding colonies of p o n d bats are only k n o w n in western Europe from The
Netherlands and Denmark (Daan 1980; Stebbings &Griffith 1986), and there may be
as few as 3000 bats of this species remaining in western Europe (Stebbings & Griffith
1986). The p o n d bat is highlighted for special protection of its roosts and feeding
habitats in the European Communities' Directive on the Conservation of Natural
Habitats a n d of Wild Fauna and Flora (1992). We therefore describe the diet of p o n d
bats in order to u n d e r s t a n d further the conservation needs of this endangered
(Stebbings 1988) species, and so that echolocation behaviour can be related to diet.
Methods
STUDY SITES
The study took place during July 1994 in Friesland, The Netherlands. Pond bats
{Myotis dasycneme) from a large nursery colony (400+ individuals) in the village of
Tjerkwerd used canals as flyways to c o m m u t e to feeding areas on the canal and over
the nearby IJsselmeer, a large m a n - m a d e freshwater lake u n d e r 10 km distant. Data
were collected from two canals of different width: one site (N - narrow) was 13 m
wide and near the roost at Tjerkwerd, and the other (W - wide) was 4 km away at
Exmorra and was 25 m wide. Commuting flight was defined as constant straight,
level flight by individuals along the length of the canal soon after emergence. All
commuting bats were flying in the same direction after dusk towards the IJsselmeer
47
T H E
U S E
OF
E D G E
H A B I T A T S
BY
C O M M U T I N G
A N D
F O R A G I N G
B A T S
/
C H A P T E R
from the roost. Data were collected from both sites, W and N. We assumed that no
bat commuting in the same direction was being photographed twice on the same
night. Data were used only from nights with negligible wind speed. Foraging flight
was distinct from commuting flight in that individuals would persist around a
particular area, flying low over the surface of the water, occasionally dipping or
climbing to catch insects. Only sequences containing attempted prey captures were
photographed. Data were collected from site W only, as regular foraging activity at
site Nwas very rare. Toincrease the feeding activity around an area, small moths and
caddis flies were collected from nearby light sources and placed in the water several
metres in front of the cameras. Most feeding activity, however, was recorded from
bats feeding on naturally occurring prey items. Additional recordings of
echolocation calls were made at a c. 100 m x 50 m lake near Deventer during July
1991.
RECORDING AND ANALYSIS OF ECHOLOCATION CALLS
Heterodyned echolocation signals, used for identification purposes, were monitored
in the field by using an Ultra Sound Advice S-25 bat detector. Microphone
sensitivity was -57 ± 13 dB (réf. IV/ubar) between 20-120 kHz. Signals were also
time-expanded by a factor of 10 by linking the detector to an Ultra Sound Advice S350 time-expansion unit, and recording on to Sony Metal-XR cassette tape with a
Sony WM-D6C Professional Walkman. This recording technique was also used in
conjunction with stereo multi-flash photography as described below. In most cases
the microphone was within approximately 2m of the height of the bats, to minimise
frequency-dependent atmospheric attenuation due to height (Jensen & Miller 1995).
Vocal commentary was recorded on to an Olympus Pearlcorder S906 portable
Dictaphone.
Echolocation recordings were analysed on a Kay DSP Sonagraph model 5500
with 512 point fast Fourier transform size giving 400 Hz frequency resolution.
Throughout the text we define interpulse interval as the duration between the onset
of a pulse and the onset of a subsequent pulse. The sound of the camera shutters
opening and closing, combined with the synchronisation pulses mixed from the
flash sequencer, enabled echolocation calls to be accurately correlated with
individual photographic images.
Echolocation calls from commuting bats were recorded on one night at each
site, to minimise the chances of recording the same bat more than once. The
fundamental harmonics of calls are described, as these generally contained
considerably more energy than did the higher harmonics, and are at least susceptible
to the effects of athmospheric attenuation. During foraging, frequency and time
measurements were made for pulses at the start and end of each distinct phase in
echolocation (e.g. approach phase, buzz 1 of terminal phase - as defined by Griffin
(1958) and Kalko & Schnitzler (1989a)), enabling changes in pulse design to be
observed both over the course of and between each phase.
MULTI-FLASH PHOTOGRAPHY
Stereo multi-flash photography was used to reconstruct the 3-dimensional flight
path of bats, using field techniques similar to those described by Jones & Rayner
(1988, 1991), and following calculations first described by Wolf (1983). For most
48
T H E
U S E
OF
E D G E
H A B I T A T S
BY
C O M M U T I N G
A N D
F O R A G I N G
B A T S
/
C H A P T E R
pictures, four Metz CL-3 flashguns were used in conjunction with a custom-built
flash sequencer to achieve flash repetition rates of 30 Hz for a duration of one
second. Flashgun intensity was modulated with Mecametz Mecablitz 45-46 sensors,
and power was supplied by two Quantum Battery-2 power packs. For synchronous
echolocation recording, time-expanded echolocation calls were recorded with the
apparatus described above, but with output from the S-25 bat detector being first
passed through a custom-built mixer, where echolocation calls were mixed with 1
ms synchronisation pulses of maximum frequency 6.25 kHz produced by the flash
sequencer. These synchronisation pulses were produced in conjunction with each
flashgun triggering event. The resulting mixed signal was then passed through the S350 unit, and the time-expanded signal recorded on to cassette. In later sonagraphic
analysis, the synchronisation pulses could be clearly seen alongside the
echolocation recordings. Time delay between the bat and the microphone was
corrected for assuming the speed of sound was 340 m/s, and hence echolocation
calls could be linked directly to specific bat images on each stereo picture.
Two Nikon 35 mm SLR cameras (FE and FM2 models), fitted with 55 mm f3.5
Micro-Nikkor lenses, were mounted 0.2485 m apart on a machine-cut metal plate,
and aligned in accordance with Jones &Rayner (1988). Both cameras were loaded
with Kodak TMAX ASA 400 or ASA 3200 black and white film. A dual shutterrelease cable was used to fire the two cameras synchronously. Once triggered, an
electronic pulse from the FE camera was used to activate the flash sequencer. The
shutters remained open for approximately one second while the sequencer fired the
flashguns.
RECONSTRUCTION OFTHE FLIGHTPATHS
Photographs of commuting flight were digitised from prints, by using a
Summagraphics Summasketch IIIbitpad (resolution 1016 dots/inch) connected to an
IBM-compatible computer running custom-written software (J.M.V. Rayner).
Reconstruction of 3-dimensional positions was performed by using custom-written
algorithms used in stereo-photogrammetry studies by Jones &Rayner (1988, 1991)
and Waters & Jones (1995).
Images of foraging bats were digitised using a more time-consuming, but more
accurate, method. This was necessary given the greater distance from the cameras to
the bats, and because of the more variable flight paths of the bats when foraging.
Errors introduced by the investigator during positional tracings and bitpad digitising
were eliminated by digitising single negatives directly using a Nikon Coolscan
negative scanner (resolution 2214 dots/inch) connected to an IBM-compatible
computer. Corresponding left and right bitmap files were then imported into Aldus
Photostyler SE, an image processing package, where the positional co-ordinates of
the nose of each bat image from left and right pictures could be directly compared
and recorded. These values could then be converted into a form identical to output
from the bitpad digitising program, enabling 3-dimensional reconstruction to
proceed. Although the scanner digitised an image 7 times smaller in linear
dimensions than that used on the bitpad, the scanner was more accurate overall
because of the elimination of tracing errors.
49
U S E
OF
E D G E
H A B I T A T S
BY
C O M M U T I N G
A N D
F O R A G I N G
B A T S
/
C H A P T E R
WINGBEAT ANALYSIS AND LINKAGE WITH ECHOLOCATION PULSE
EMISSION
Wingbeat frequencies were measured from photographs during both commuting and
foraging, at a flash frequency of 30 Hz. Additionaly, at site N, a flash frequency of 60
Hz (from 8 Metz CL-3 flashguns, powered by 2 further Q u a n t u m batteries), and
synchronised echolocation recordings, enabled pulse emission to be linked to the
wingbeat cycle with greater accuracy than pictures taken with a lower flash rate.
DIETARY STUDIES
Droppings collected from the roost during 1993 were analysed. Fifty pellets were
chosen at random, and percentage volume of prey taxa was determined following
methods described by Jones (1990, 1995).
Data are given as means ± standard deviation, unless otherwise stated.
Results
ECHOLOCATION CALLS
Myotis dasycneme echolocation calls are usually frequency m o d u l a t e d (FM), similar
to those p r o d u c e d by the trawling insectivorous bats Myotis daubentonii (Jones &
Rayner 1988), Myotis adversus (Thompson &Fenton 1982; Jones &Rayner 1991) and
Myotis ricketti (A.R.C. Britton, u n p u b l i s h e d data). All calls were classified as search,
approach or terminal phase echolocation signals (Griffin et al. 1960), with terminal
phase calls subdivided into buzz 1 and buzz 2 (Kalko & Schnitzler 1989a). Calls
recorded from commuting bats were similar to FM signals emitted during search
phase foraging. Example calls are illustrated in Figure 4.1,with descriptions in Table
4.1. For search phase calls on canals, there was a significant negative correlation
between b a n d w i d t h and duration of the calls (bandwidth (kHz) = 76.1 - 3.66
duration (ms), r 2 =38.4, F 5 3 =27.73, P<0.001). Mean pulse repetition rate during
commuting sequences was 10.8 Hz (n=24 sequences of 500 ms duration). Some
search phase calls contained a quasi-F portion (with a very shallow frequency
modulation, but not pure CF (Kalko & Schnitzler 1993)), with an initial FM sweep
(Fig. 4.1b). Very occasional calls were recorded w h i c h were almost entirely CF (Figs.
4.1c,d), producing a 'slapping' or 'plopping' noise on a heterodyne detector (Ahlén
1990).
The longer duration and narrower b a n d w i d t h calls that were recorded at the
lake in Deventer were analysed separately because the diameter of the water body
there was considerably larger than that at the canals. Search phase calls from the lake
were sigmoidal in structure (Fig. 4.le) with m u c h lower m a x i m u m frequencies,
shallower frequency m o d u l a t i o n a n d longer durations than those recorded at the
canal. Interpulse interval was longer at the lake site, resulting in a lower pulse
repetition rate of 8.4 Hz (n=20 sequences of 500 ms) (Table 4.1). Other u n u s u a l call
types recorded are s h o w n in Figure 4.1f,g. In addition, low-intensity interference
nulls were often visible in calls of lower intensity (relative to the microphone).
These artefacts are characteristic of echolocating bats flying close to a reflecting
surface, a n d are not a feature of the calls themselves (Jones &Rayner 1988; Kalko &
Schnitzler 1989b).
50
T H E
U S E
OF
E D G E
H A B I T A T S
C O M M U T I N G
A N D
F O R A G I N G
A T S
/
C H A P T E R
Figure4 . 1 .
Echolocation calls of Myotis dasycneme. (a-c) were recorded during commuting flight on
canals, while (d) isan almost CFcall recorded only occasionally in the same situation; (e)
isa long duration search phase call recorded over a lake, and (f) and (g) are probably
used in communication.
Table 4 . 1 .
Description of echolocation calls of Myotis dasycneme. Calls described are from
commuting flight at the canal (C),search phase over the lake at Deventer (L), first call of
the approach phase (AF), last call of the approach phase (AL), first call of buzz 1(B1F),
last call of buzz 1(B1L),first call of buzz 2 (B2F), last call of buzz 2 (B2L), and the first call
produced after the 'post-buzz pause' (R). Frequency and time measurements are
maximum frequency (FMAX), frequency of most energy (FMAXE), minimum frequency
(FMIN), duration (PD) and interpulse interval (IPI -defined asthe time from the start of
one pulse to the start of the next). All data refer to fundamental harmonics, and are
shown as means ± standard deviations, with sample sizes in brackets at the top of the
table.
CALLTYPE
C(54)
AF(2)
AL(9)
B1F(9)
B1L(9)
F M A X (kHz)
74.3 ± 6.8
F M A X E (kHz)
35.9 ± 2.8
47.6 ± 5.3
70.8 ± 10.3
69.7 ± 9.8
66.5 ± 9.4
50,1 ± 7 . 7
37.7 ± 3 . 8
21.5 ± 6.3
62.1 ± 6 . 0
34.7 ± 1.3
36.3 ± 4 . 3
33.1 ± 1 . 5
39.2 ±12.2
30.4 ± 5.4
25.1 ± 1 . 5
20.1 ± 6.5
FMIN (kHz)
36.6 ± 2.0
28.1 ± 2 . 2
28.1 ± 1.5
25.2 ± 2 . 0
23.4 ± 0 . 7
23.2 ± 0 . 5
21.2 ± 1 . 5
17.7 ± 2 . 4
15.6 ± 4.4
28.6 ± 2 . 6
PD (ms)
8.2 ± 1.1
18.0 ± 2.5
4.3 ± 1.2
3.4 ± 0 . 3
2.6 ± 0 . 3
1.6 ± 0 . 2
1.4 ± 0.2
0.6 ± 0.1
5.9 ± 1 . 7
IPI (ms)
95.2 ± 22.2
117.3 ± 19.1
34.0 ± 1 2 . 2
12.7 ± 7.5
8.6 ± 1.4
4.5 ± 0.4
4.3 ± 0 . 3
4.7 ± 0.2
83.1 ± 26.2
U31)
B2F(9)
B2L(9)
R(8)
The frequency structure of approach phase calls was similar to that of search
phase calls, but their durations were shorter (Table 4.1). The onset of the approach
phase was characterised by amarked decrease in both pulse duration and interpulse
interval, which continued over the course of the phase. The mean duration of two
entire approach phases was 384.4 ± 48.6 ms and they contained 15 ± 15.7 pulses.
51
T H E
U S E
OF
E D G E
H A B I T A T S
BY
C O M M U T I N G
A N D
F O R A G I N G
B A T S
/
C H A P T E R
Before the onset of the terminal phase buzz, a longer interpulse interval, named here
as 'pre-buzz pause', was always present, with a mean duration of 28.7 ± 15.8 ms.
The bandwidth of the fundamental harmonic began to reduce at the onset of
the feeding buzz, attributable primarily to a slight reduction in the maximum
frequency at the start of the call. Secondary harmonics were strongly defined,
maintaining the overall bandwidth of the pulses. Over the course of buzz 1, the
maximum frequency fell further, but with minimal reduction in terminal frequency.
Pulse duration also reduced further over the course of buzz 1, with a continuing
dramatic reduction in interpulse interval. Mean pulse repetition rate during buzz 1
was 113.1 ± 9.2 Hz. The onset of buzz 2 was characterised by a significant drop in
both the maximum and minimum frequencies of the fundamental. At this point, the
second harmonic became relatively more intense, maintaining bandwidth of the
pulses. Towards the end of buzz 2, bandwidth of the fundamental sweep was very
low (5.9 ± 2.0 kHz), with the second harmonic sometimes more intense than the
fundamental. Pulse durations were reduced yet further towards the final pulses of
the buzz, reaching a minimum of 0.6 ms (Table 4.1). Interpulse interval, however,
appeared to reach a minimum during buzz 2. Pulse repetition rate reached a mean
of 195.8 ± 3.1 Hz, the highest recorded rate being 201.2 Hz. Over the course of both
buzz 1 and buzz 2, there was a noticeable decrease in pulse intensity. The mean
duration of the feeding buzz, 205.0 ± 36.8 ms, was composed of 111.9 ± 33.7 ms for
buzz 1 and 93.1 ± 15.1 ms for buzz 2, and the mean number of pulses in buzzes 1
and 2was 12.4 ± 3.0 and 18.2 + 2.9 respectively. Apause after the final pulse of buzz
2, named here as the 'post-buzz pause', lasted 76.8 ± 41.1 ms. The first pulse
occurring after this pause (n=8) was similar in structure to a search phase call, but
with a significantly (t 60 =5.28, P<0.001) lower maximum frequency (62.1 ± 6.0 kHz)
at the start of the fundamental (Table 4.1). Mean duration of this pulse was also
significantly (t 60 =3.57, P<0.01) shorter than search phase pulse duration. The
frequency of maximum energy over the course of the entire feeding sequence
appeared to decrease towards the end of buzz 2, except at the very start of buzz 1.
FLIGHT HEIGHTAND SPEED DURING COMMUTING
Mean flight height at site N was 0.26 ± 0.02 m (n=17). No comparable data were
available at site W. Two models are frequently used for the calculation of V
(minimum power speed) and V m r (maximum range speed): Pennycuick (1975, 1989)
and Rayner (1986; Norberg & Rayner 1987). Each model relies upon different
assumptions, and predicts different optimal speeds (Jones 1993a). Ground effect can
have a significant effect on predicted optimal flight speeds, as it causes a reduction
in induced flight power (Norberg 1991). The magnitude of ground effect is very
dependent upon flight height above the surface (Aldridge 1988;Rayner 1991a). The
interference coefficient (a) can be calculated to show the magnitude of ground effect
as the percentage reduction in induced power. As height above the surface
decreases, the value of G increases. For mean commuting flight height O = 0.09,
which is a 9% reduction in induced power (Norberg 1991). Morphological data used
in the calculation of optimal flight speeds were taken from Schober &Grimmberger
(1989) and Norberg &Rayner (1987), as data from the Tjerkwerd colony were not
available.
Mean flight speed of commuting bats at site N was 9.13 ± 0.41 m/s (n=21),
52
T H E
U S E
OF
E D G E
A N D
H A B I T A T S
FO RA G
C H A P T E R
significantly higher (Mann-Whitney W=656, P<0.001) than that at site W,which was
7.35 ± 1.26 m/s (n=23). A unimodal distribution of flight speeds was apparent at
both sites. Predicted values for V and V m r from the Rayner model are 4.1 and 5.8
m/s, respectively. The Pennycuick model (mechanical power only) predicts V at
5.1 m/s and V m r at 8.3 m/s. Optimal speeds should be reduced in both models when
ground effect is included (see Norberg 1991). The bats flew considerably faster than
V m r close to the roost, reducing speed to V mr or slightly above it at the more distant
site, depending on which model was used to calculate optimal speeds.
WINGBEAT AND PULSE EMISSION DURING COMMUTING
Mean wingbeat frequency was 9.43 ± 1.24 Hz (n=15) at site N, and 10.19 ± 0.76 Hz
(n=23) at site W. The difference in frequencies between the two field sites was
significant (Mann-Whitney W=219, P<0.03). Wingbeat frequency was hence close to
the repetition rate of echolocation pulses (see above). A highly significant negative
relationship occurred between wingbeat frequency and flight speed (r 2 =18.3%,
F 35 =7.84, P=0.008; Fig. 4.2).
The mean number of pulses per wingbeat during commuting flight was 1.00 ±
0.25 (n=9 sequences photographed at 60 Hz flash frequency). Figure 4.3 illustrates
the link between wingbeat and pulse emission for a typical commuting sequence.
The image of each bat image below the sonagram shows the position of the wings at
progressive stages during the wingbeat cycle. The relative position of each image in
the echolocation sequence indicates the period of the wingbeat cycle in which
echolocation pulses were emitted. As wingbeat is cyclic, different wing positions
were assigned one of eight angular positions between 0° and 360°. A Rayleigh test
131211-
oo
if
7-
•
•
• •
*/
'
i
)ht speed
•
• "•*-
i
r
<o
01
•
••
•
•
•
6-
•
•
•
•
5-
•
49
10
12
Wingbeatfrequency(Hz)
Figure 4.2.
The relationship between wingbeat frequency and flight speed during commuting. The
regression equation isy=14.2-0.6x (F35=7.84, r2=18.3%, P<0.01).The open square shows
mean (± standard deviations) values for site N, closed square issite W.
53
T H E
U S E
OF
E D G E
H A B I T A T S
BY
C O M M U T I N G
A N D
F O R A G I N G
A T S
/
C H A P T E R
Figure4.3.
Synchronization between wingbeat and echolocation pulse emission during commuting
flight. The arrow above each bat image represents the bat's position relative to the
echolocation sequence. Pulses are produced just after the top of the upstroke. The blank
image represents aflashgun misfire.
shows that pulse distributions in the cycle differ significantly from random
^28"=3.90,P<0.02). Insufficient data were available to determine accurately the mean
position of pulse emission during the wingbeat cycle, but most pulses appeared to
be emitted at or just after the end of the upstroke.
FLIGHT BEHAVIOUR WHILE FORAGING
Mean flight speed during foraging flight was 3.21 ± 1.92 m/s (n=9). This was
significantly lower than commuting flight speed (t30=18.54, P<0.001), and includes
sequences of prey capture. Foraging flight speed is not therefore comparable with
measurements of speed while searching for prey in other trawling bats which
excluded prey capture sequences (Jones & Rayner 1988, 1991). As the bat
approached a potential prey item, there was a reduction in flight speed and a change
in wingbeat style (Fig. 4.4). As the bat descended to the water surface, wingbeat
amplitude was reduced, and wingbeat frequency dropped. Before reaching the prey,
the bat entered a short glide, or a wingbeat of very low amplitude. Just after entering
the glide, the bat lowered its feet and interfemoral membrane ('tail-down' stage, after
Kalko & Schnitzler 1989a). Mean distance before prey at 'tail down' was 0.21 + 0.15
m (n=9). Usually, as soon as the water surface was struck, the bat brought feet and
head together ('head-down' stage). Mean distance after prey at 'head-down' was 0.16
±0.08 m. The bat than repositioned its head and feet and resumed normal flight 1.05
+ 0.77 m (n=3) after prey capture. There was a significant correlation between the
duration of the 'head-down' stage and the duration of the post-buzz pause (r=0.86,
P<0.05, n=6)).Wingbeat style during the 'head-down' stage was much shallower than
in standard, commuting flight. However, once the 'head-down' stage was over,
wingbeat amplitude increased as the bat gained height. In addition to trawling
behaviour, high catches were observed frequently, whereby a bat flew upwards at a
steep angle in order to intercept an insect. These manoeuvres were never
photographed owing to their unpredictable timing.
54
T H E
U S E
O F
E D G E
1
2
H A B I T A T S
B Y
C O M M U T I N G
A N D
F O R A G I N G
B A T S
/
C H A P T E R
(a)
3
4 ^
5 ^ 6
7 ^
8
Pre-buzz
Approach
,MdM»fr*
^ 9
10
11
Buzz2
Buzzl
12
13 14
Post-buzz
15
Next
70
|
I I -
il i
liiimin
MU..IHIH,!,,,,,,,,
UU
33 ms
0)
iï
0
t
10
t
11
4
12
«
«
13
14
I
15
(b)
A È.
1
2
Hi
*3
Buzzl
**4
6
7
10 11 12 13
8 9
5Buzz2
14
Post-buzz
15 16 17
Next
TT70
I
LL
0
33 ms
t
t
1
2
t
9
t
10
•
11
t
12
(
13
I
14
t
15
t
16
t
17
(c)
^
H
2
3
4
Buzzl
5
6
7
ÎL.
M M' M i l l
0
33 ms
•
t
1
2
10 11
12 13
14 15
Next
I
I
\
)
> 1
c
3
9
Post-buzz
Buzz2
-N 70
IJ£
<D
8
I
S
lI
)
\
\
\
S
lllllllliilin
t
3
t
4
t
5
t
6
t
7
t
8
t
9
t
10
t
11
t
12
t
13
1
14
(
15
Figure 4.4.
Synchronous multi-flash sequences (30 Hz) and sonagrams of echolocation calls f o r t h r e e
a t t e m p t e d prey captures. N u m b e r e d bat images correspond t o n u m b e r e d flash
synchronization pulses on soangrams. The phase o f t h e echolocation sequence is
indicated above each sonagram. Prey position is m a r k e d w i t h a cross.
55
THE
USE
OF
EDGE
HAI
C O M M U T I N G
A N D
F O R A G I N G
BATS
C H A P T E R
ECHOLOCATION AND BEHAVIOUR DURING PREYCAPTURE
Prey capture was linked to echolocation behaviour for nine prey capture sequences,
three of which are illustrated in Figure 4.4. Two sequences contained echolocation
calls emitted before the approach phase. The last search phase call before the
approach phase is the assumed detection distance (Kalko &Schnitzler 1989a) and
was emitted 2.03 ± 0.09 m from the prey. The approach phase began at 1.82 + 0.10
m before prey capture, giving a measure of reaction distance (Kalko & Schnitzler
1989a). Pulse-echo overlap may be avoided during prey capture (Fig. 4.5).
Calculations take into account the duration of pulses emitted by thebat, the distance
from the bat to the reflecting target, and the change in flight speed of the bat during
0.4
0.0
0.5
0.6
0.8
Distancetoprey(m)
1.0
1.5
Distancetoprey(m)
1.0
1.4
2.5
Figure4.5.
Scatterplots of pulse duration (solid circles) asa bat approaches a prey item for (a) one
feeding buzz and (b) all feeding buzzes. Connected open squares represent the maximum
possible pulse duration, given the bat's flight speed and distance to the prey, before
overlap with returning echo would occur. Overlap would occur if the solid circles fall
above this line. Points that are grouped along the x-axis occurred between two sequential
images of the foraging bat.
56
T H E
U S E
OF
E D G E
H A B I T A T S
BY
C O M M U T I N G
A N D
F O R A G I N G
B A T S
/
C H A P T E R
4
its approach towards the target. It is assumed the target is stationary. Two sequences
showed no pulse-echo overlap. The mean distance from the prey at which there is
overlap between the emission of a single pulse and the reception of that same pulse's
echo (n=7) was 0.21 + 0.06 m.
DIET
Pond bats ate mainly small dipterans (68% of diet by volume; Fig. 4.6). Almost all
dipteran remains identified were the antennae and wings of chironomid midges.
About 11% of the diet by volume consisted of beetles, 8% was chironomid pupae,
1.5% caddis flies, and one lacewing was found.
Caddis flies
(1.5%) Lacewings
Moths
(11.2%)
<°-2%>
Beetles
(11.4%)
Chironomid
pupae
(7.6%)
Small dipterans
(68.2%)
Figure 4.6.
Diet of Myotis dasycneme asdetermined by volumetric analysis of faeces.
57
T H E
U S É
OF
E D G E
H A B I T A T S
BY
C O M M U T I N G
A N D
F O R A G I N G
B A T S
/
C H A P T E R
Discussion
ECHOLOCATION CALLS
Bandwidth of the search phase calls for M. dasycneme was comparable to that ofM.
daubentonii during commuting flight (Jones & Rayner 1988), although both
maximum and minimum frequencies were slightly lower in the pond bat - more
similar to values measured of Myotis adversus (Jones & Rayner 1991). Frequency of
maximum energy was 10 kHz lower than in the other two species. These frequency
differences are probably due to the larger size of M. dasycneme: Barclay &Brigham
(1991) showed a negative correlation between body mass and frequency of
maximum intensity in bats. The interpulse interval and pulse duration of M.
dasycneme (c. 17g(Schober & Grimmberger 1989)) were also, as predicted, of longer
duration than in M. daubentonii (c. 7.5 g) and M. adversus (c. 9.4 g) (see Jones 1994
and Waters et al. 1995, for scaling of interpulse interval and pulse duration). The
negative relation between bandwidth and pulse duration is expected because bats
shorten their pulses and increase bandwidth when flying in clutter (Zingg 1988).
Kalko & Schnitzler (1989a) and Jones & Rayner (1988, 1991) noted that in both
M. daubentonii and M. adversus the frequency sweeps of most search phase calls
were sigmoidal in shape. Asigmoidal structure is also apparent in most search phase
calls of M. dasycneme, even in the more CF calls. A sigmoidal call structure may
have a combination of different functions, making the signals Doppler tolerant
(Hartley et al. 1989) while still containing target information (Simmons & Stein
1980). Most of the longer, quasi-CF calls also contained a very rapid frequency
modulated sweep at the end of the pulse. This has also been noted in the calls of M.
daubentonii (Jones & Rayner 1988) and M. adversus (Jones & Rayner 1991;
Thompson & Fenton 1982). The latter authors noted that this low frequency
component resembles a 'honk' used by some bats in social communication, but Jones
&Rayner (1991) proposed that the sweeps occur too regularly for this and are more
likely to be involved in height detection by trawling bats.
Most of the long duration, quasi-CF calls were recorded over the lake at
Deventer. The bats here were foraging over a much larger area than on the canals,
distant from the banks. Why these calls were rarely emitted by bats on the canals is
not clear. Minimum detection distances (Kalko & Schnitzler 1993) correspond to
about 139 cm for 8 ms calls typical of those emitted over canals, 306 cm for the 18
ms pulses recorded at the lake. Long duration, quasi-CF calls may be adapted to
detecting glints from insect prey (Schnitzler 1987), and the calls recorded at the lake
are clearly adapted for long-range echolocation, of objects over 3 m away.
Alternatively, the bat may focus energy into a narrow bandwidth of the call, rather
than spreading over a wider range of frequencies. Interpulse intervals at the lake
were longer than those on the canal. Assuming that echo processing occurs before
emission of the next pulse (Roverud & Grinnell 1985), then the effective maximum
detection distance at the lake would be further (about 16.9 m for lake, 14.8 m for
canal). Bats at the lake were able to switch to more FM calls rapidly before
commencing feeding buzzes.
The unusual calls recorded as Figure 4.1 (f,g) were rarely recorded. Similar
calls have been recorded in M. daubentonii (A.R.C. Britton, unpublished data) prior
to a collision with another bat, and therefore may be a warning or distress call. This
58
T H E
U S E
OF
E D G E
H A B I T A T S
BY
C O M M U T I N G
A N D
F O R A G I N G
B A T S
/
C H A P T E R
could not be confirmed here.
Comparisons with other Myotis bats that forage by trawling reveal a degree of
similarity in both pulse design and the structure of the feeding buzz, w h i c h is not
surprising given their phenetic relationship (Findlay 1972). Myotis
dasycneme,
Myotis daubentonii (Jones & Rayner 1988; Kalko & Schnitzler 1989a) and Myotis
adversus (Jones & Rayner 1991) mostly produce relatively short, frequency
m o d u l a t e d calls during search, approach and terminal phase echolocation.
Therefore, all of these species presumably receive similar information about their
environment, and high-bandwidth, frequency m o d u l a t e d calls are well suited to
detecting objects on the water surface (Jones & Rayner 1988). Other trawling
microchiropteran species, such as Noctilio leporinus (Suthers 1965) and Noctilio
albiventris (Brown et al. 1983) also show a convergence towards rapid, linear-FM
pulses during prey capture, even though these bats use a combination of FM-CF and
CF pulses during search phase.
The 'pre-buzz pause' is relatively short in duration a n d may serve as an
extended inspiratory phase just prior to the emission of the group of terminal phase
pulses. Here, there is no correlation between duration of the pause and duration of,
or n u m b e r of, pulses during the interception buzz, despite the mean pause duration
being approximately 13-14% of the whole terminal phase duration in both this
dataset and data from M. daubentonii (A.R.C. Britton, u n p u b l i s h e d data). There is
some evidence to support a relationship between duration of the 'pre-buzz pause'
and c o m p o n e n t s of the terminal phase duration in M. daubentonii (A.R.C. Britton,
u n p u b l i s h e d data). Given the small sample for M. dasycneme, however, no similar
conclusions can be drawn.
Buzz 1 of the terminal phase shows c o m m o n trends in M. dasycneme, M.
daubentonii and M. adversus. There is a general decrease in both the m a x i m u m and
m i n i m u m frequencies of the fundamental harmonic, although Kalko & Schnitzler
(1989a) note a slight increase in the m i n i m u m frequency for M.
daubentonii.
However, both M. adversus and M. dasycneme produce pulses of longer duration
than M. daubentonii
during this phase (Jones & Rayner 1988, 1991). The
characteristic decrease in both pulse duration and interpulse interval continues as
the bat approaches prey in all species. This serves to prevent pulse echo overlap
w h e n the bat is close to the prey (Kalko & Schnitzler 1989a). In M. dasycneme, the
second h a r m o n i c appears to increase in intensity relative to the primary harmonic,
explaining the high variability in the frequency of m a x i m u m energy (Table 4.1). As
pulse intensity decreases so the relative intensity of the second harmonic appears to
decrease, u p to the end of buzz 1.
Buzz 2 is the period immediately before the bat attempts to catch the prey
item. M a x i m u m and m i n i m u m frequencies continue to fall, and reach their lowest
values by the end of the buzz. The interpulse interval is very similar for M.
dasycneme,
M. daubentonii
and M. adversus a n d remains virtually constant
throughout buzz 2, w h i c h implies that a physiological limit to calling rate has been
reached. The drop in both m a x i m u m and m i n i m u m frequencies between the final
pulse of buzz 1 and the first of buzz 2 has been noted before in M. daubentonii (Jones
& Rayner 1988; Kalko & Schnitzler 1989a), and also in other vespertilionid species
such as Pipistrellus kuhli (Schnitzler et al. 1987) and M. siligorensis (Surlykke et al.
1993). Previous studies (Griffin et al. 1960) suggested the frequency drop at such
59
T H E
U S E
OF
E D G E
H A B I T A T S
BY
C O M M U T I N G
A N D
F O R A G I N G
B A T S
/
C H A P T E R
high repetition rates is an inevitable by-product of limitations in muscle physiology.
However, Surlykke et al. (1993) provide evidence of its adaptive value to increase the
bandwidth of the final echolocation pulses produced before prey capture, and they
note that other species can maintain similarly high repetition rates without this drop
in frequency. Wilkinson (1995) suggested that the drop in frequency at the end of the
interception buzz allows a greater transmission range for the calls, which could
signal to conspecifics that feeding is occurring.
The first pulse emitted after the 'post-buzz pause' appears to be similar to the
pulses produced during search phase, although the maximum frequency is
significantly lower, as is the duration. It is possible that at least the first call after a
feeding buzz is affected by the events preceding it. Ifthe bat is then carrying prey in
its mouth, its echolocation ability will be temporarily impaired to some degree. This
may affect the frequency, duration, intensity or number of echolocation calls
produced while chewing. Preliminary data from M. daubentonii (A.R.C. Britton,
unpublished data) suggest that echolocation calls emitted immediately after prey
capture are different from normal search phase signals.
FLIGHT HEIGHT AND SPEED DURING COMMUTING
Sexual dimorphism exists in other trawling Myotis bats (Jones & Rayner 1991;Jones
&Kokurewicz 1994). Morphological measurements used in aerodynamic models of
optimal flight speeds were taken from literature. Most bats photographed in this
study were probably lactating females from a nursery roost, but data on the masses
of lactating females alone were not available. Hence, there are probably some slight
inaccuracies in our calculations of optimal flight speeds.
V ,minimum power speed, is the theoretical speed at which the bat should
fly in order to minimise power expenditure. V mr , maximum range speed, is the
speed at which a bat would achieve maximum flight range for a given amount of
energy. While searching for insects, bats are predicted to fly somewhere between
these two speeds (R.Â. Norberg in U.M. Norberg 1981; Jones & Rayner 1991) to
maximise feeding efficiency. For commuting flight, in order for a bat to reach its
destination in the shortest time while maximising overall energy gain, the bat should
fly faster than V mr (R.A. Norberg 1981). Commuting flight speed at site N exceeded
V mr for both models, while flight speed at site Wexceeded V m r for the Rayner model,
but was slightly less than V mr for the Pennycuick model. Flight speeds above V mr
when commuting were noted by Jones & Rayner (1989) for Pipistrellus pipistrellus.
Leptonycteris curasoae commuted at speeds below V mr (using the Pennycuick
model), however (Sahley et al. 1993). Although flights at speeds greater than V mr
involve increased energy expenditure, the bat reaches a foraging site more rapidly,
and can begin feeding earlier. Because insect density declines rapidly after dusk
(Racey &Swift 1985), any energy lost in commuting can be quickly recovered by
feeding on the insects available at the destination. Arriving at afeeding site later may
involve missing the dusk peak of insects, and the net energetic return of foraging
gains minus energy costs while commuting may be lower than if the bat flew to the
feeding site faster. Such decisions may not be applicable to L. curasoae, because
nectar abundance may not decline rapidly after dusk. Red Lasiurus borealis and
hoary L. cinereus bats both exceeded maximum range speeds even when foraging
(Salcedo et al. 1995).
60
T H E
U S E
OF
E D G E
H A B I T A T S
BY
C O M M U T I N G
A N D
F O R A G I N G
B A T S
/
C H A P T E R
As the bats emerged from the roost and began commuting along the canal (site
N), they flew significantly faster than bats from the same colony recorded
commuting through the more distant site W. Why did flight speed decrease further
from the roost? Perhaps, bats flying above V m r are not able to maintain such speeds
for extended periods. Maybe prédation risk is greater closer to the roost, hence
selecting for faster flight there. A further possibility is related to the bats' perception
of linear landscape elements associated with canal width. To maintain contact with
the canal banks, a bat would require an emitted pulse to be reflected back to itself
before emission of the next pulse. If this were not the case, then information from
this preceding echo would probably not be processed (Roverud &Grinnell 1985).
Therefore, to avoid this problem, the bat could increase its interpulse interval,
achieved through a decrease in wingbeat frequency and hence an increase in flight
speed at a wider canal. The higher flight speed at the narrow canal is in fact opposite
to that predicted by the above theory.
Mean commuting flight height at site N was such that flight power savings
from ground effect would have been fairly low -certainly less of a saving than during
foraging flight. The values of the interference coefficient (a) for foraging flight in M.
adversus and M. daubentonii were 0.30 and 0.25 respectively (Jones & Rayner 1991).
Aldridge (1988) calculated a maximum o value of 0.36 for M. lucifugus in a flight
tunnel. Therefore, induced flight power savings for the above three species were
around three to four times that saved during commuting flight in M. dasycneme.
This illustrates that the main advantages of ground effect for trawling bats are
usually associated with foraging flight (Rayner 1991a).Ground effect associated with
the lower flight height during attempted prey capture has been noted to be
significant (Jones & Rayner 1991;Rayner 1991a). Miller & Degn (1981) noted that M.
daubentonii spends most of its time flying no more than 0.5 m from the surface of
the water, whereas Baagoe (1987) noted that M. dasycneme generally flies and
forages at slightly higher average heights than M. daubentonii.
LINKS BETWEENWINGBEAT AND PULSE EMISSION
A negative relationship between flight speed and wingbeat frequency occurs in M.
dasycneme, which is to be expected from aerodynamic theory (Rayner 1993), and
indeed wingbeat frequency decreases at increasing flight speeds in laboratory
studies (Schnitzler 1971; Heblich 1986). This study reports the first demonstration
of the relationship between flight speed and wingbeat frequency under natural
conditions. This is confirmed by the significant difference in wingbeat frequency
between the two canal sites, which is reflecting the faster flight close to the roost.
Previous studies on bats (Suthers et al. 1972) have shown a facultative link
between wingbeat frequency and respiration, in similar ways to those of birds.
Echolocation pulses are produced in conjunction with expiration (Lancaster et al.
1995). Intense pulses can be very costly to produce at rest (Speakman et al. 1989).
During flight, however, the bat must produce a regular series of pulses, for without
them it will not receive sufficient information to navigate successfully (Thomas et al.
1990). Echolocation costs may be minimal for a flying bat (Speakman & Racey 1991)
because bats take advantage of the link between wingbeat and respiration and
produce echolocation pulses during the regular expiratory phase associated with
each wingbeat (Suthers et al. 1972; Rayner 1991b). Echolocation calls are usually
61
T H E
U S E
OF
E D G E
H A B I T A T S
BY
C O M M U T I N G
A N D
F O R A G I N G
B A T S
/
C H A P T E R
p r o d u c e d at the top of the upstroke (Suthers et al. 1972), and this appeared to be the
case in M. dasycneme. A 1:1 link is expected between calling and flapping for most
bats (including trawling species) during the search phase (Jones 1994), deviations
being due to specialised echolocation strategies, such as gleaning bats that produce
low-intensity calls. Bats may occasionally produce more than one echolocation call
per pulse during search flight, and may miss pulses out (Kalko 1994) or make very
short glides (Thomas et al. 1990), although no gliding flight was noted here during
commuting flight. This implies a greater flexibility, w h i c h is important during
terminal phase echolocation, as the 1:1 link must break d o w n w h e n pulse repetition
rate approaches 200 Hz.
PREYCAPTURE BEHAVIOUR
The significantly lower overall flight speed during capture attempts in Myotis
dasycneme is probably partly the consequence of a lower predicted o p t i m u m flight
speed during foraging compared with commuting (Jones &Rayner 1991). Moreover,
lower trawling speeds are a prerequisite to successful prey capture, and extension of
the wrings and interfemoral m e m b r a n e during the feeding sequence necessarily
d e m a n d or facilitate a decrease in flight speed. Changes in wingbeat a m p l i t u d e as the
bat approaches the water surface w o u l d be necessary to prevent hitting the water on
the downstroke and this may also enforce deceleration. Given the link between pulse
emission a n d wingbeat frequency, and the assistance given to vocalisation by the
action of beating the wings (Lancaster et al. 1995), this decrease in wingbeat
amplitude may affect the relative energy cost of terminal phase echolocation. The
'pre-buzz pause' may be a time of inspiration and help to counter these effects,
although the decrease in pulse intensity during terminal phase may still be
necessary given the limited energy available. The frequency structure of calls may
also be compromised, although the frequency drop noted in buzz 2 may not be
present in some species (Surlykke et al. 1993).
The short glide seen during actual prey capture may increase the accuracy of
feet placement or may result in increased lift the m o m e n t the bat strikes the water so
that powered flapping can then recommence to gain height. The distance to prey at
the start of 'tail down' stage is fairly constant. The bat w o u l d become aerodynamically
more unstable if it adopted this position too far from the prey, yet it cannot leave the
'tail-down' stage until too late, or it would miss the prey. Low variation in the onset
of the initial 'tail-down' stage w o u l d be expected, therefore. Once the bat has
attempted to pick u p the prey, it becomes necessary to transfer it from feet to m o u t h
as soon as possible, lest it be dropped. The duration of this transfer stage, however,
is somewhat variable, as Kalko &Schnitzler (1989a) noted w i t h M. daubentonii. Data
on capture success in M. dasycneme were not available, so its effect on the length of
the 'head down' period is not k n o w n . A bat's retrieval efficiency (handling time in
'head down') may d e p e n d u p o n prey size. Echolocation during the 'head-down' stage
generally does not occur, as implied by the significant relationship between 'head
down' period and post-buzz pause duration. This relationship has also been noted
in M. daubentonii (A.R.C. Britton, u n p u b l i s h e d data). However, in both of these
species, exceptions do occur w h e n pulses are p r o d u c e d in 'head down' (e.g. Fig.
4.4a), although there seems to be little reason for the bat to produce a high-intensity
echolocation pulse w h e n its head is in this position.
62
T H E
U S E
OF
E D G E
H A B I T A T S
BY
C O M M U T I N G
A N D
F O R A G I N G
B A T S
/
C H A P T E R
The theoretical m i n i m u m detection distance from search phase calls on
canals is calculated as 1.39 m for an 8.2 ms pulse, assuming avoidance of pulse-echo
overlap (Kalko & Schnitzler 1989a). Calculated detection distance was 2.03 m,
reaction distance was 1.82 m. These values are slightly longer than those for M.
daubentonii
(Kalko & Schnitzler 1989a), Myotis siligorensis,
Craseonycteris
thonglongyai (Surlykke et al. 1993) and Pipistrellus spp. (Kalko 1995), a n d this is
expected given that M. dasycneme emit calls of a slightly longer duration. Detection
distances should be greater on the lake site, given the longer pulse duration, and
hence predicted m i n i m u m detection distance of about 3 m.
AVOIDANCE OFPULSE-ECHO OVERLAP
As the bat approaches an object, there is a danger of pulses being produced w h i c h
overlap with their returning echo if the duration of the emitted pulse is too long
(Schnitzler et al. 1987; Waters et al. 1995). This w o u l d result in a loss of information
for the bat, partly due to decreased auditory sensitivity created by contraction of the
m i d d l e ear muscles (Henson 1965). Avoidance of pulse-echo overlap is therefore
particularly important during prey capture, and has been investigated previously in
M. daubentonii (Kalko & Schnitzler 1989a) and Noctilio leporinus (Hartley et al.
1989). The bat avoids overlap by decreasing pulse duration as interpulse interval
shortens prior to prey capture. In M. dasycneme, pulse-echo overlap generally is
avoided. Indeed, two sequences showed no evidence of pulse-echo overlap.
However, this may not be true for the entire terminal phase sequence. Overlap may
sometimes occur just prior to prey capture (mean distance of 0.17 ± 0.10 m before
prey). Kalko &Schnitzler (1989a) gave similar findings for M. daubentonii, but stated
that this may be an artefact due to both measurement inaccuracies a n d the
assumptions m a d e to perform the calculation. In this study, the need for most
assumptions has been minimised, although inevitable inaccuracies still exist. Unlike
the study of Kalko &Schnitzler (1989a), changes in flight speed during prey capture
were measured and taken into account. However, digitising inaccuracies still i n d u c e
a potential source of error. Distance to prey w h e n each pulse was produced cannot
be quantified exactly, but must be equated to the nearest measurable bat-to-prey
distance from the flash sequence closest in time to pulse emission. So, the final
pulses in buzz 2 were assumed to end at the closest measured distance from bat to
prey before capture. Given the above inaccuracies inherent in the measurement of
pulse-echo overlap, the occurrence of overlap may be difficult to determine
precisely, especially during the final m o m e n t s of prey capture.
So, w h y might this short period of overlap take place, if at all? The bat will
simply lose information from pulses w h e n it is very close to its intended target.
Perhaps the bat has accrued sufficient information about the target and its position
that such last-minute updates are unnecessary. If this were true, however, w h y does
the bat not terminate the echolocation pulses earlier to avoid wasting energy? It has
been suggested that some species can utilise overlap beneficially (Hartley et al. 1989;
S i m m o n s et al. 1990), but there is no evidence of this in Myotis bats. Looking at the
duration of interpulse interval a n d pulse duration during buzz 2, it appears that a
physiological limit to call repetition rate has been reached, and such overlap may be
inevitable close to a target.
63
U S E
OF
E D G E
H A B I T A T S
BY
C O M M U T I N G
A N D
F O R A G I N G
B A T S
/
C H A P T E R
DIET
The bulk of the diet of pond bats in this study comprised small dipterans, especially
chironomid flies. Inthis respect, the diet resembles that ofM. daubentonii (Swift and
Racey 1983; Beck 1994-5), so overlap in diet of the two species may occur where
they are sympatric. Ithas been suggested that population increases ofM. daubentonii
over much of Europe are the consequence of eutrophication of water increasing the
abundance of pollution-tolerant chironomids (Daan 1980; Kokurewicz 1994-5;
Vaughan et al. 1996). While M. daubentonii has increased in numbers in The
Netherlands over the past 50 years, M. dasycneme has decreased (Daan 1980). It is
not possible therefore to apply general arguments about diet to explain the changes
in numbers of these species of trawling bats. The occurrence of pupal cases in the
faeces suggests that the bats often take chironomids at the moment of adult
emergence at the water surface.
Overall, in comparison with other studies, this study highlights some
similarities in the flight and echolocation of trawling Myotis bats. Morphological
differences appear to contribute to variation in flight and, to a lesser extent,
echolocation characteristics between the three species discussed. Comparative
investigations such as these can reveal more information than that provided by the
species under study alone. This adds to the evidence which suggests that
echolocation during feeding behaviour is generally similar between different species
of vespertilionid bats - all of which have reached a common solution, or utilise a
common solution used by ancestral forms.
64
T H E
U S E
OF
E D G E
H A B I T A T S
BY
C O M M U T I N G
A N D
F O R A G I N G
B A T S
/
C H A P T E R
5
5. Acoustic perception of landscape elements by
echolocating pond bats Myotis dasycneme
Summary
The hypothesis that echolocating bats use landscape elements as acoustic landmarks
was tested. If so, bats should be able to perceive distant landscape elements by
echolocation and hence change their echolocation behaviour in relation to landscape
elements. Echolocation parameters of commuting pond bats Myotis dasycneme
(Boie, 1825) were related to the distance to the banks of differently sized canals.
Pulse durations emitted at canals of 13, 19, and 25 m wide successively increased.
Interpulse intervals were equally long at 13, 19, and 25 m wide canals, but
significantly longer at a 30 m wide canal. The mean interpulse intervals at the 30 m
wide canal were just sufficiently long to prevent overlap of an echo from the canal
bank and anew outgoing pulse for bats flying on average halfway between the banks.
The results indicate that pond bats perceive the canal banks by gradually adapting
their pulse emissions to the distance to the banks. This suggests a role of the banks
as acoustic cues.
A pond bat approaching prey on the water surface (photo: Zomer Bruijn).
65
T H E
U S E
OF
E D G E
H A B I T A T S
BY
C O M M U T I N G
A N D
F O R A G I N G
B A T S
/
C H A P T E R
Introduction
While moving through landscapes, many bat species follow edge habitats, such as
forest lanes, forest edges, hedgerows, tree lines, river banks, and canals (Nyholm
1965; Voûte 1972; Glas 1978; Racey &Swift 1985; Limpens &Kapteyn 1990; De Jong
1994). But for what reasons? Possible explanations suggested for this p h e n o m e n o n
are that these landscape elements provide (1) shelter from w i n d , (2) shelter from
predators, (3) foraging habitats, a n d / o r are used as (4) acoustic cues for navigation
and orientation (Limpens et al. 1989; De Jong 1994; Verboom &Huitema 1997).
This paper deals with the possible role of landscape elements as acoustic
landmarks for commuting bats, either as orientation cues, or to stay on course. In
chapter 3, we found that the distribution of pipistrelle bats relative to treelines was
strongly related to the distance to the trees. Wind-speed and direction did also have
an effect on the distribution of bats, and bat and insect a b u n d a n c e were related w h e n
insect a b u n d a n c e in the open area adjacent to the treeline was relatively high. W h e n
insect a b u n d a n c e was low, virtually all bat activity took place on the leeside within
the range perceptible by their echolocation system. This generated the hypothesis
that bats are acoustically linked to landscape elements.
Previously, Limpens et al. (1989) postulated that orientational constraints
with respect to long distance perception inherent in the use of echolocation, force
bats to follow vertical landscape elements as guidelines. However, this idea is
challenged by field observations. Commuting pipistrelle bats Pipistrellus
pipistrellus
(Schreber, 1774) sometimes cross o p e n m e a d o w s and fields over distances u p to 200
m as part of their daily flight routes (personal observations), or h u n t in grasslands 50
m or more from the nearest trees or bushes (Kalko & Schnitzler 1993; personal
observations). This is well beyond the m a x i m u m sonar range of this species, w h i c h
may be the range of 15-20 m, as estimated from mean interpulse intervals.
Nevertheless, it can still be argued that vertical landscape elements are used as
reference landmarks, although bats, apparently, are not restricted to stay within
acoustic reach all the time.
In this study we hypothesize that bats use vertical landscape features as
acoustic navigation and orientation cues. If so, changes in the distance between a bat
and surrounding landscape elements will be reflected in its echolocation. While
m a n y authors have investigated species specific sonar variation in cluttered versus
uncluttered environments (e.g. Ahlén 1981; Miller &Degn 1981; Belwood & Fullard
1984; Thomas et al. 1987; Zingg 1988; Brigham et al. 1989; Zbinden 1989; S c h u m m
et al. 1991; Kalko & Schnitzler 1993; Rydell 1990, 1993; Obrist 1995), the relation
between echolocation and quantified landscape variables has not yet been
examined. In most studies the bats' environment was complex and threedimensional. In such an environment a bat's echolocation is affected by many
variables, like distance to surrounding objects, height above the ground, echoreflecting surface and prey availability.
The p o n d bat Myotis dasycneme
(Boie, 1825) commutes and forages
predominantly over waters (canals, p o n d s , lakes). While commuting between
nursery roosts and hunting sites over canals, p o n d bats seldom h u n t for insects and
maintain a straight course approximately along the midline of the canal at an average
height of 26 cm above the water surface (Britton et al. 1997). As its flyway is in a two-
66
T H E
U S E
OF
E D G E
H A B I T A T S
BY
C O M M U T I N G
A N D
F O R A G I N G
B A T S
/
C H A P T E R
dimensional plane, this makes a relatively uncomplicated situation to study
echolocation in relation to landscape features. This paper presents a study of the
relation of the echolocation of commuting pond bats to one landscape parameter,
that is, distance to canal banks. Echolocation parameters were: interpulse intervals,
pulse duration and peak-frequency. With increasing distance to a canal bank, we
expect bats to increase interpulse intervals and to emit longer pulses of lower peakfrequency.
Study sites and methods
STUDY AREA
The pond bat nursery roost was in the church of the small village of Tjerkwerd
(province of Friesland, The Netherlands), containing approximately 650 individuals
in the year the study took place (pers. comm. A.M. Voûte). Bats commuted along
canals to their main hunting sites at Lake IJssel. Recordings of commuting bats were
made south-west of Bolsward, near Tjerkwerd and Exmorra (53°04'N, 5°27'E), at
respective (straight-line) distances of 8 and 4.5 km from Lake IJssel. The area
represents a typical open polder landscape with an extensive network of canals and
ditches in a matrix of cattle-grazed grasslands. Canals varied between 12 and 40 m
in width. The wooden sheetpiling of the canal banks protruded approximately 0.3 m
above the water surface. The short vegetation on the banks was dominated by Lolium
perenne L.
RECORDINGS OFCOMMUTING BATS
Commuting bats were recorded in July and August 1994, when flying from their
nursery roost in Tjerkwerd to hunting sites at Lake IJssel, using canals as flyways.
Recordings were made at canals of 13,19, 25,and 30m wide, referred to as canal 13,
canal 19, canal 25, and canal 30. At all four sites, passing bats (usually several
hundreds within one hour) seldom produced terminal buzzes, indicating that the
bats were actually commuting.
The microphone of a Pettersson D-980 bat detector (sampling frequency 350
kHz; resolution 8bits) was pointed perpendicular to the bats' flyway and placed on
a small, horizontal standard. Single passing bats were recorded using timeexpansion by a factor 10 and heterodyning (Pettersson 1993), and both were
simultaneously stored on an Aiwa HD-S100 DAT-recorder. The heterodyning circuit
was tuned to the estimated peak frequency of the emitted signals: 35 kHz.
Recordings were converted to digital signals with an LP900 A/D interface (12 bits;
Pettersson Elektronik, Uppsala, Sweden). Sound analysis was carried out with an
LP900 signal analyzer (Version 3).
ECHOLOCATION PARAMETERS
Pulse durations and peak-frequencies were obtained from the same time-expanded
recordings. Recordings were digitised by computer using a sampling frequency of 50
or 100 kHz. Time-expanded signals with asignal-to-noise ratio of less than 8dB were
omitted from the analysis. Pulse durations were measured as the interval between
the points where the signal amplitudes exceeded the noise level in the oscillogram.
67
T H E
U S E
OF
E D G E
H A B I T A T S
BY
C O M M U T I N G
A N D
F O R A G I N G
B A T S
/
C H A P T E R
Peak-frequency was defined as the frequency with the strongest amplitude.
Peak-frequencies were calculated from Fast Fourier Transforms (FFT) over the
second half (measured in time) of the pulse. We used either 2048 or 4096 points FFT,
resulting in a frequency resolution of 244 and 122 Hz respectively, at a sampling rate
of 50 kHz.
Interpulse intervals were measured from heterodyned recordings. Computer
samples (sampling frequency 20 kHz) of these recordings were taken in an identical
way for each bat. The e n d of each sample was defined by the abrupt fall in a m p l i t u d e
of the pulses w h i c h always occurred w h e n the bat h a d travelled several meters past
the m i c r o p h o n e (and the m i c r o p h o n e was n o longer reached by the s o u n d beam). An
interpulse interval was defined as the interval between the peaks of two subsequent
heterodyned pulses. Since the detector was t u n e d to 35 kHz, peak frequencies of the
emitted sonar signals were well w i t h i n the tuning b a n d w i d t h (±4 kHz) of the
detector. This means that the sharp peaks revealed by the signal analyser coincided
(in time) with the actual peak-frequencies of the emitted pulses.
Intervals outside the range of 40-200 m s were omitted from the analyses, and
were a s s u m e d to be associated w i t h approach phases of the bats or caused by very
weak, undetected, pulses. Before analysis of the recordings, a selection was m a d e of
bats that h a d passed the m i c r o p h o n e while flying in 4 0 % of the canal w i d t h bisected
by the midline.
ESTIMATION OFBAT-TO-BANK DISTANCES
The distance from bats to the canal bank was estimated from polystyrene foammarkers w h i c h protruded 0.02 m above the water surface at k n o w n distances. We
investigated a possible influence of these markers on the bats' echolocation or
behaviour but found no effects. Only w h e n the markers were left floating on the
water surface, the majority of passing bats s h o w e d disturbed behaviour by making
s u d d e n turns or gaining height a n d emitting more pulses per second than usual. At
canal 13, distance estimations were verified by measuring the time lapse between
pulses and echoes returning from the opposite bank.
REACTION DISTANCE
Heterodyned recordings were m a d e of commuting p o n d bats approaching a bridge
over a canal. The position of the m i c r o p h o n e was perpendicular to the flight-path of
the bats. Loud pulses w i t h strong echoes on the oscillogram marked the time w h e n
the bats passed the microphone. A dramatic drop in a m p l i t u d e indicated that a bat
had entered the space u n d e r the bridge. The time difference between these two
observations was t h e n reconciled with a flight speed of 9 m/s. Hence, each
interpulse interval could be correlated to a specific distance to the bridge. It was
assumed that the bats w o u l d increase their pulse repetition rate and thus shorten the
duration of their interpulse intervals at the m o m e n t the bridge was detected.
To establish the distance to w h i c h p o n d bats react to a large clutter producing
object, we used the data of commuting bats approaching a bridge in combination
with data of commuting bats at the canals. Bats were hereby assumed to fly over the
midline of the canals. A piece-wise linear model was fitted to estimate the breakpoint, that is the distance where bats started shortening their interpulse intervals:
the reaction distance.
68
T H E
U S E
O F
E D G E
H A I
C O M M U T I N G
A N D
F O R A G
C H A P T E R
STATISTICALANALYSIS
For statistical analysis we used the Number Cruncher Statistical System (NCSS 5.x
series, Kaysville, Utah, 1991). Data are presented as mean values ± standard
deviations, unless stated otherwise. Pairwise differences were analysed by t-tests,
not by multiple procedures, with a 5% significance level per pairwise comparison
(Saville 1990). We accepted a significance level of more than 5% for the total set of
pairwise comparisons.
Results
BAT-TO-BANK DISTANCES
There was no difference in mean bat-to-bank distance calculated from the time-lapse
between pulse and echo from the opposite bank and the estimates from foam
markers at canal 13 (paired t-test, P=0.26, n=14), which shows that the latter were
quite accurate. The pulse-echo measurements showed that 95% of the passing bats
flew between 5.1 and 6.1 m from the opposite bank.
PULSE DURATIONS
Mean pulse durations increased from 8.22±1.26 ms (n=41) at canal 13 to 8.71±1.27
ms (n=32) at canal 19 and 9.83±1.39 ms (n=32) at canal 25, and decreased again to
9.16+2.28 ms (n=38) at canal 30 (Fig. 5.1a). There were significant differences
between canals 13 and 25 (paired t-test, P<0.001), 19 and 25 (P<0.005), and 13 and
30 (P<0.05).
z z
Y
X
Y
X
a
X
X X
X
c
140
120
100
80
60
40
20
0
13
19
25
30
canal width (m)
13
19
25
30
canal width (m)
1
19
25
30
canal width (m)
Figure 5.1.
Mean pulse durations (a), interpulse intervals (b) and peak-frequencies (c) emitted by
commuting bats at four canals of different width. Error bars represent standard
deviations. Non-significant differences (t-tests, P>0.05) are indicated by corresponding
letters above bars.
69
T H E
U S E
OF
E D G E
H A B I T A T S
BY
C O M M U T I N G
A N D
F O R A G I N G
B A T S
/
C H A P T E R
INTERPULSE INTERVALS
Mean interpulse intervals were 93.17±26.09 (n=230), 91.26±25.16 (n=201) and
93.99±24.26 (n=209) ms at canals 13, 19 and 25 respectively (paired t-test,
differences not significant). At the widest canal, intervals increased significantly to
an average value of 100.29126.45 ms (n=209; paired t-test, P<0.02; Fig. 5.1b). As
intervals were measured between the heterodyned peak-frequencies of the pulses,
the (mean) pulse durations have to be subtracted in order to obtain the actual
interpulse intervals.
PEAK-FREQUENCIES
Mean peak-frequencies at different canals showed an opposite trend compared to
pulse durations (Fig. 5.1c). Mean peak-frequencies were 34.07±0.99 kHz (n=28) at
canal 13 and 33.9310.79 ms (n=29) at canal 19, then decreased to 32.8410.95 kHz at
canal 25 (n=22;paired t-test, P<0.001), and increased again to 34.3311.42 kHz (n=27)
at canal 30 (paired t-test, P<0.001).
Peak-frequency and pulse duration were negatively related (linear regression
analysis, r=-0.36, P<0.001). As the bandwidth of the fundamental is expected to
reach a minimum with increasing pulse duration, we also fitted a non-linear
hyperbolic model (F(3,103)=29423.7, P<0.001).
REACTION DISTANCE
There was a significant relation between the length of interpulse intervals and the
distance of commuting pond approaching a canal bridge (linear regression,
F(l,91)=10.74, n=93, P=0.001).In the piece-wise model we used data from canals 13,
19 and 25, which had equal interpulse intervals (Fig. 5.1b). The model estimated a
break-point at 4.71 m (standard error=1.07; Fig. 5.2). The results indicate that bats
started reacting to the bridge by shortening their interpulse intervals at
approximately 4.71 m from the bridge.
Discussion
THE PERCEPTION OF DISTANT LANDSCAPE ELEMENTS BY COMMUTING
BATS
Aerial insectivorous bats use echolocation to detect and catch prey and to avoid
obstacles. For many vespertilionid species, these tasks are performed within several
meters from the bat. According to Kalko & Schnitzler (1993), Pipistrellus species
only begin to react to objects at a distance of 3-5 m by switching to a pulse type with
a different frequency-time course. In the present study, a similar reaction distance of
approximately 4.7 m was found for commuting pond bats flying towards a bridge
(Fig. 5.2). For the perception of more distant objects, e.g. landscape elements, bats
need to adapt the emitted echolocation signals to receive processable and useful
echoes. Our data indicate that commuting pond bats gradually adapted their
echolocation signals to the distance to canal banks, which ranged from 6.5 to 15 m.
With distances to the banks increasing, they emitted signals with longer pulses and
interpulse intervals. It was not possible to make sound recordings from commuting
bats flying further away from the bank due to low signal-to-noise ratios.
70
T H E
U S E
OF
E D G E
H A B I T A T S
BY
C O M M U T I N G
A N D
F O R A G I N G
B A T S
/
C H A P T E R
180
160
140
. »
'M*
£
«
>
CD
120
. ' •
•
• • ••
100
80
a.
a
60
c
« .
i
•
i
•
-•••
* •\ •« %
• •• •• • . .
« -.
V * .•
•• - . - ••• • ••
C
CD
at
3
• • •*
40
•
•
>
20
0
0
2
4
6
8
10
12
distance to bridge (.) or bank ( B ) (m)
Figure 5.2.
Interpulse intervals of pond bats approaching a bridge (circles; n=93), and of bats
commuting over canals 13(n=230), 19 (n=201), and 25 (n=209) (squares; error bars
represent standard deviations). Bats reacted to the bridge by shortening their interpulse
intervals at an estimated distance of 4.71 m (standard error=1.07) from the bridge.
ECHOLOCATION DESIGN IN RELATION TO DISTANCE
Pulse durations
Detection and discrimination capabilities of a bat are largely determined by the
frequency-time course of an echolocation signal. Vespertilionid bats using longduration narrowband pulses usually forage in open spaces, often at high altitudes,
w h e r e detection of objects is more important than structural information.
Vespertilionids w h i c h h u n t in dense or cluttered environments generally use short,
broadband pulses. As distances to surrounding objects are short, detection is easily
accomplished, whereas information about the structure of objects becomes more
important (for reviews see Neuweiler &Fenton 1988; Fenton 1990; Neuweiler 1990).
Similar differences in signal design are visible on the intraspecific level, where bats
adapt the frequency-time structure of their pulses to the surrounding habitat (e.g.
Ahlén 1981;Miller &Degn 1981; Belwood &Fullard 1984; Thomas et al. 1987; Zingg
1988; Brigham et al. 1989; Zbinden 1989; S c h u m m et al. 1991; Kalko & Schnitzler
1993; Rydell 1990, 1993; Obrist 1995).
From theoretical models it can be derived that range resolution, and hence
discrimination performance, improves w h e n using short, broadband pulses, and
decreases w h e n using long narrowband pulses (Cahlander 1967; Simmons & Stein
71
T H E
U S E
OF
E D G E
H A B I T A T S
BY
C O M M U T I N G
A N D
F O R A G I N G
B A T S
/
C H A P T E R
1980;Menne 1988;Zbinden 1989; Saillant et al. 1993).Theory also predicts that long
narrowband pulses are optimised to solve detection problems since most signal
energy is concentrated into a narrow frequency-band on which the receiver can
concentrate (Simmons &Stein 1980). In laboratory experiments, Schmidt &Thaller
(1994) found that Tadarida brasiliensis can enhance its sensitivity to echoes by
increasing pulse duration within the integration time of its nervous system.
In the present study we would expect the bats to emit relatively short
duration, high bandwidth pulses at short distances from the canal banks (at narrow
canals) and relatively long duration narrowband calls at longer distances (at wider
canals). Bandwidth, however, degrades over large distances as a consequence of
atmospheric attenuation, which affects the higher frequencies more severely.
Therefore, we focused on pulse duration, which is much less affected by
atmospheric attenuation since the steepest frequency modulation in pond bats is at
high frequencies (Britton et al. 1997).As expected, our data show longer pulses with
increasing canal width.
Interpulse intervals
The distance perceptable by bats is limited by the time between two subsequent
pulses. Each emitted pulse triggers a neuronal time-window which measures the
range to objects by the delay of the returning echoes (Dear et al. 1993). Every new
outgoing pulse triggers a time-window again, thus overriding the processing of
echoes from the earlier emission (Simmons & Grinnell 1988). This means that if abat
wants to echolocate an object outside its perceptible range at that moment, it should
increase the intervals to be able to receive and process the object-echoes before each
subsequent emission. It has been observed in Pipistrellus species that interpulse
intervals are significantly longer in uncluttered compared to cluttered environments
(Kalko & Schnitzler 1993;Kalko 1994). It is also possible that bats flying in cluttered
environments need more detailed information from their surroundings than bats
flying in uncluttered environments.
Mean interval durations in pond bats in the present study were approximately
84 ms at canals 13, 19, and 25. At canal 30 an overlap between echoes and new
outgoing pulses would occur at intervals shorter than 88 ms (assuming the bat's
position is halfway between the banks). Thus, the mean interval length of 91 ms at
canal 30 would just prevent pulse-echo overlap, and enable the bats to echolocate
the canal bank.
Several studies (e.g. Schnitzler 1971; Kalko 1994) demonstrate a 1:1 relation
between the bat's wingbeat frequency and pulse emission. Kalko (1994) suggests that
the wingbeat frequency in pipistrelles is higher in cluttered than in uncluttered
environments. This means that the longer pulse intervals at the widest canal in our
study could be the result of a lower wingbeat frequency. However, in their study at
two canals in the same area, Britton et al. (1997) found higher wingbeat frequencies
at the widest of two canals. This would imply shorter interpulse intervals, which is
contradictory to our results.
Peak-freq uencies
Lower frequencies are better suited to detect objects over long distances than higher
frequencies as a result of a lower attenuation coefficient of low frequencies.
72
T H E
U S E
OF
E D G E
H A B I T A T S
BY
C O M M U T I N G
A N D
F O R A G I N G
B A T S
/
C H A P T E R
However, the difference in attenuation between 34 and 32 kHz (Fig.5.1c) is only 0.08
dB/m, as calculated from Weast (1979). Consequently, the advantage of lowering the
peak-frequency from 34 to 32 kHz may be negligible. The observed differences in
peak-frequency can also be caused by differences in frequency-time course of pulses
at the different canals. The observed correlation in the pond bat between pulse
duration and peak-frequency is also found in several other species [Eptesicus
nilssonii, Rydell 1993; Nyctalus leisleri and Hypsugo savii, Zingg 1988). It is likely
that the observed differences in peak-frequency are a side-effect of different pulse
durations emitted at narrow versus wider canals. At shorter pulses the peakfrequencies are somewhat raised, while longer pulses cause the opposite effect.
LANDSCAPE ELEMENTSASACOUSTICCUES
The ability of pond bats to receive (processable) echoes from a bank is probably
restricted to a limited range of less than 30 m. This can be demonstrated by a simple
calculation. Assuming that the bat is a point source, that the atmospherical
attenuation is 1.0 dB/m at 35 kHz and at 50% relative humidity (Lide 1995-1996),
and that the banks reflect 100% of the incident sound, we expect the bats to receive
an echo from abank at 30m which is about (10*log(l/47t602)-1.0*60)=107 dB weaker
than the emitted pulse. Under ideal circumstances (the banks reflecting all the
incident energy, absence of external noise, the bat's hearing threshold at 0 dB SPL
and the emitted sounds at 110 dB SPL) the bat would just be able to detect the bank.
However, under normal circumstances, when not all sound energy is reflected,
external noise will be present, and the bats have a higher hearing threshold, the
maximum detection range will be smaller.
On the other hand, observations of pond bats foraging at their main foraging
areas over Lake IJssel, sometimes at distances of more than 100 m from the bank
(unpublished results), show their ability to leave echo-contact with the bank. Hence,
we do not conclude that bats need acoustic contact with landscape elements.
Cognitive space maps may play a significant role in bat movements through a
landscape. We can only speculate how detailed such cognitive maps are. Homing
experiments have demonstrated that bats are able to return to their roost after being
removed to locations which may be well outside their home range (e.g. Davis &
Cockrum 1962; Mueller 1965; Barbour et al. 1966; Stones &Branick 1969). Visual
cues, for instance street lamps or urban illumination, may also play an important
role. Nevertheless, if movements rely on spatial memory, the information stored in
cognitive maps still has to be based on acoustic and, possibly, visual cues, and
reference landmarks may still be useful or even necessary for a bat's navigation
and/or orientation.
73
T H E
74
U S E
OF
E D G E
T A T S
8 Y
C O M M U T I N G
A N D
F O R A G I N G
B A T S
C H A P T E R
T H E
U S E
OF
E D G E
H A B I T A T S
BY
C O M M U T I N G
A N D
F O R A G I N G
B A T S
I
C H A P T E R
6
6. The influence ofwind protection on commuting
and foraging pipistrelle bats Pipistrellus
pipistrellus near treelines
Summary
The influence of' w i n d protection on the occurrence and distribution of commuting
and foraging pipistrelle bats, Pipistrellus pipistrellus, was examined in an area with
a relatively w i n d y climate. Wind protection provided by treelines was quantified by
their height, width, and permeability. General occurrence and feeding activity of
pipistrelles were positively related to height, w i d t h and foliage density of treelines.
The preference for commuting routes leading from a maternity roost in a small
village to the surrounding landscape was explained by the distribution of potentially
good feeding sites at close distance from the roost. The results stress the importance
of w i n d protected areas where bats can feed during w i n d y conditions, and hence
have implications for the conservation of bats and their habitats. It is argued that the
n u m b e r a n d distribution of sheltered feeding sites are a major constraint on bat
density, especially in areas with a w i n d y climate.
Introduction
Many bat species show a tendency to follow edge habitats such as treelines,
hedgerows, forest edges, banks of rivers, canals and lakes, and drainage channels
(e.g. Voûte 1972; Bateman &Vaughan 1974; Racey & Swift 1985; Rieger et al. 1990;
Krull et al. 1991; Limpens & Kapteyn 1991; De Jong 1994; Walsh &Harris 1996a/b;
Verboom & Huitema 1997). The use of edge habitats as flight paths is most obvious
in bats commuting between their roost and foraging areas at dusk and dawn, but
foraging sites too are very often situated close to the edges of vertical elements. This
apparent choice seems to be widely spread among bats w h i c h are specialized to fly
and h u n t in semi-open situations, but also occurs in species which are adapted to
use more confined spaces, such as members of the vespertilionid genera Plecotus
and Myotis. A n u m b e r of large bats, such as the vespertilionid Nyctalus
noctula
(Schreber, 1774) and several molossid and emballonurid species, however, seem to
move i n d e p e n d e n t l y from vertical landscape features, and can frequently be
observed in large open areas (e.g. Norberg & Rayner 1987; Ahlén 1990; Kronwitter
1988), or at high altitudes (e.g. Williams et al. 1973; Fenton & Griffin 1997), where
they encounter less clutter (e.g. background echoes from vegetation or ground). The
pipistrelle bat, Pipistrellus pipistrellus
(Schreber, 1774), seems to occupy an
intermediate position in this spectrum: while its echolocation is not typically
adapted to cluttered environments, and it may frequently move into open areas, the
pipistrelle makes extensive use of edge habitats for several reasons (Racey & Swift
1985; Limpens &Kapteyn 1991; De Jong 1994; Ekman &De Jong 1996; Rydell et al.
1996). So far, our studies in The Netherlands were focused on bat occurrence in
75
T H E
U S E
OF
E D G E
H A B I T A T S
BY
C O M M U T I N G
A N D
F O R A G I N G
B A T S
/
C H A P T E R
relation to insect distribution and w i n d protection on the leeside of landscape
elements, and discussed the possible role of shelter from avian predators (Verboom
& Huitema 1997; see also Chapters 2 and 3). Furthermore, our results suggest that
pipistrelles (as well as p o n d bats, Myotis dasycneme: Chapter 5) are acoustically
linked to vertical landscape features, suggesting a role of these as navigational
reference landmarks (Chapter 3).
The m a i n question in this paper is: what is the influence of w i n d protection
on the distribution of commuting and foraging pipistrelle bats along a network of
treelines? Several workers have reported an impact of w i n d on the commuting and
foraging behaviour of bats (Nyholm 1965; Voûte 1972; Racey &Swift 1985; Rieger et
al. 1990; Verboom &Huitema 1997). For the bats themselves, exposure to w i n d may
considerably increase their flight cost and negatively influence their
manoeuvrability (Schnitzler 1971;Norberg 1990). Furthermore, in addition to factors
such as species composition of the vegetation and specific seasonal changes in insect
peak activity, w i n d protection obviously affects the distribution of insects.
Especially in areas w i t h a w i n d y climate, such as coastal areas, w i n d shelter may
thus be a primary factor causing temporal and spatial variations in food a b u n d a n c e .
Daily variations in w i n d - s p e e d and direction may cause a temporal variation in
w i n d shelter patterns and hence in food abundance. Differences in treeline structure
(height, width, permeability; Lewis 1969b) may cause considerable spatial variations
in w i n d shelter and hence in food a b u n d a n c e w i t h i n nights.
In the present study I first examined w h i c h characteristics determine the
profitability of treelines as feeding sites. To quantify the degree of w i n d protection,
treelines were characterized by their height, w i d t h and permeability. I predict a
strong relation between the occurrence of foraging pipistrelles and the degree of
shelter provided by treelines.
In the second part of the study, the distribution of potentially good feeding
sites a r o u n d a maternity roost was used to predict the choice of evening commuting
routes leading from the roost to the surrounding area. Like m a n y other bat species
(e.g. Bell 1980; Furlonger et al. 1987; Wilkinson 1992), pipistrelles are believed to be
generalist feeders (Swift et al. 1985; Hoare 1991; Sullivan et al. 1993), adapted to
exploit food patches varying in time and space in an opportunistic way (Racey &
Swift 1985). After emerging from their roost a r o u n d dusk, pipistrelle bats c o m m u t e
to their feeding areas along fixed flight paths, with hardly any feeding activity on
their way (personal observations). Although the energetic cost of bat flight is
relatively low (Norberg 1990), one w o u l d expect commuting pipistrelles to reduce
travel time and distance in order to reach their feeding sites more rapidly a n d thus
maximize the net rate of energy gain by maximizing the exploitation of insect
activity peaks at dusk. An important additional benefit w o u l d be the reduction of
time exposed to potential avian predators. In this paper I hence predict that
pipistrelles select the shortest commuting routes leading to suitable feeding sites,
given that these flyways provide sufficient shelter and can be used for navigation,
and assuming that the bats possess information on potentially good feeding sites.
Commuting time could further be reduced by increasing flight speed. This
hypothesis is supported by data from Jones & Rayner (1989) showing that flight
speed of commuting pipistrelle bats is higher t h a n foraging flight speed, even
exceeding the predicted speed w h i c h minimises flight costs per unit distance
76
THE
USE
OF
EDGE
HA
C O M M U T I N G
A N D
F O R A G I N G
C H A P T E R
(maximum range speed) as predicted from Norberg & Rayner (1987).
Methods
STUDY AREA
The study took place in Walcheren, in the south-western part of The Netherlands
(province of Zeeland), near two small villages, Meliskerke and Grijpskerke (Fig. 6.'I),
between May and August 1993-1996. Walcheren is a coastal area with a relatively
windy climate. The area is primarily agricultural, with small villages surrounded by
pastures and fields. The intensive use of agricultural land has resulted in an
extremely poor insect fauna in the meadows and fields. Single and double treelines
border many of the roads, thus forming an extensive network. The absence of forest
in most of the area leaves only treelines and small tree stands near farmhouses as
sheltered habitat. Apparently, these landscape elements offer sufficient
opportunities to the local bat populations to commute and forage, given the presence
Figure6.1.
Schematic map of Walcheren. Indicated are built-up areas (shaded) and woody
vegetation (treelines and woodlots; black). M = Meliskerke, G= Grijpskerke. Numbers 1-6
refer to commuting routes.
77
U S E
OF
E D G E
H A B I T A T S
BY
C O M M U T I N G
A N D
F O R A G I N G
of pipistrelle bat maternity roosts in virtually all villages in the area and the occurrence
of foraging pipistrelle bats around many of the treelines in fairly high densities. There
was a maternity roost of about 35 pipistrelles in Meliskerke (counts in 1994,1995, and
1996) and one of 145 animals in 1994 and 108 in 1996 in Grijpskerke.
BAT OCCURRENCE ON LINE-TRANSECTS
Bat occurence was monitored at points on line-transects. Data were collected from
four transects, two a r o u n d the village of Meliskerke (transects M l a n d M2), a n d two
around Grijpskerke (Gl a n d G2). Respective lengths of the transects were 10,760 m
(Ml), 11,670 m (M2), 11,080 m (Gl), and 4,550 m (G2). Per night, one transect was
monitored. The line-transects were representative samples of single a n d double
treelines in the area, and partly crossed open area as well. Street lamps, w h i c h may
attract pipistrelles and thus influence their distribution (e.g. Haffner & Stutz 19851986; Rydell 1992; Blake et al. 1994), were hardly present outside built-up areas.
Single (orange s o d i u m (Na) and white mercury (Hg) vapour) street lamps were
present along roads in open area, >25 m from trees, on transects M l (one white, one
orange), M2 (one white, one orange), G l (one orange), and G2 (two orange).
Beforehand, pipistrelles had been recorded all along the transects. Point
observations along line-transects took place between one hour after sunset a n d one
hour before sunrise. It was assumed that during that period, pipistrelles w o u l d
spend most of their time foraging at selected sites. Transects were surveyed by two
persons driving on bicycles at a constant speed of about 6 k m / h . Two ultrasonic bat
detectors (type Petterson D-960, Lars Pettersson Elektronik, Uppsala, Sweden) were
used in order to detect bats flying at both sides of the road and above the road. Bat
detectors were t u n e d at 45 kHz, w h i c h corresponds to the approximate frequency of
highest intensity of the echolocation s o u n d s of P.pipistrellus. This m e t h o d did not
allow the assessment of densities, since individual bats could not be distinguished.
Observation points along transects were selected in two ways:
1. 'Fixed observation points' were established on fixed locations with fixed
interpoint distances of 0.9 km.
2. 'Feeding observation points': w h e n a bat was detected, a stopwatch was
triggered for one minute; if a bat was detected a second time w i t h i n that
minute, an observation point was assigned. This m e t h o d was used to select
feeding sites along the transects. All single records in between feeding
observation points were noted as well. M i n i m u m interpoint distances
were 100 m.
Fixed observation point data were collected from all four transects (11
nights altogether). In four nights I did not finish a fixed point transect due
to rain (which affects the equipment). Feeding observation point data were
collected in nine nights from transects M l (four nights), G l (three nights),
and G2 (two nights). Different starting points were used for each time a
transect was surveyed.
At each point, pipistrelle occurrence, relative insect density, wind-force, and
w i n d direction were assessed. In case of a double treeline, bat occurrence was
monitored simultaneously both from the road between the tree rows a n d on the
leeward side. After monitoring bat occurrence, insects were sampled w h e r e bats
were most abundant, either on the road or on the leeward side of the treeline. The
78
T H E
U S E
OF
E D G E
H A B I T A T S
BY
C O M M U T I N G
A N D
F O R A G I N G
B A T S
/
C H A P T E R
occurrence of pipistrelles was scored as the total time bat s o u n d was recorded and
as the n u m b e r of feeding buzzes recorded during a five-minute period. Insects were
sampled by sweepnetting with a handnet, 0.45 m in diameter (Bioquip Products,
Gardena, California, USA). Per observation point, fifty sweeps, each 4 m in length,
were taken at a height of 3.5-4.5 m, while walking slowly, taking a step every two
sweeps parallel to the treeline, a n d another 50 while returning to the starting point
(40 m vice versa). Wind-forces were estimated according to the Beaufort scale and
transformed to w i n d - s p e e d s in m / s by taking the midpoints of corresponding
Beaufort classes. Wind direction was expressed as the angle between w i n d and
treeline (incidence angle; 0-90°).
COMMUTING FLIGHT ROUTES
Six different roads, all bordered by double treelines, linked the village of Grijpskerke
w i t h the surrounding landscape, potentially providing commuting bats sheltered
flyways to foraging grounds. Routes 1-3 and routes 4-6 (Fig. 6.1) were connected
with two networks of treelines, one lying south and one lying north of Grijpskerke.
Both networks were interconnected through Grijpskerke only. Outside Grijpskerke,
the two networks were separated by more than one km of open agricultural land.
During three evenings, simultaneous counts of pipistrelle bats leaving the village
were carried out from fixed points along all six routes. Counting points were located
50-100 m from built-up area. Counts were m a d e both visually and with the aid of bat
detectors (Pettersson D-100; QMC-mini, QMC Instruments Ltd., London), t u n e d at 45
KHz, from 5-10 m breaks in the treelines. Road, leeward and w i n d w a r d side of
treelines could be w a t c h e d from these locations. Commuting flight was defined as a
straight flight at a relatively high speed, and with only occasional feeding activity.
The end of the commuting period was estimated by the absence of bats for at least
10 minutes or by increased foraging activity (feeding buzzes, bats flying in the
opposite direction).
VEGETATION FEATURES
After a flood during World War II, all treelines in Walcheren died. During the Fifties,
the local government started planting treelines along roads, as part of a recovery
plan. As a result of this planting policy, treelines in the study area consist of
stretches of varying length, w h i c h are very similar in vegetation structure and
composition. Tree species in both treelines and woodlots were Fraxinus excelsior L.,
Acer pseudoplatanus
L., Ulmus minor Miller and Populus x canadensis Moench.
Common species in the generally present b u s h layer were Crataegus
monogyna
Jacq., Acer campestre L. and Sambucus nigra L.
Vegetation structure of the treelines and woodlot edges along the transects,
and in both networks within 1, 2, and 3 km from Grijpskerke built-up area if
measured along treelines, was quantified by visual estimation of height, w i d t h and
foliage density (100% - permeability). When treelines were double, 1 0 % of the
density of the treeline with the lowest density was a d d e d to the treeline with the
highest density. There was one 1.7 ha woodlot along transects M l and M2, one 0.8
ha woodlot along transect G l , and two woodlots along transect G2 with areas 0.8 and
1.8 ha along the Grijpskerke transect. Foliage density at edges of woodlots was
considered to be 100% (0% permeability).
79
T H E
U S E
OF
E D G E
H A B I T A T S
BY
C O M M U T I N G
A N D
F O R A G I N G
B A T S
DATA ANALYSES
Fixed observation point data were analysed with mixed models, in which linear
modelling (regression and analysis of variance) was generalized to REML (Residual
Maximum Likelihood; Patterson & Thompson 1971) and IRREML (Iteratively
Reweighted REML; Engel & Keen 1994; see appendix). REML, IRREML and Poisson
regression analyses were performed with the statistical program GENSTAT (Genstat
5 Committee 1993, 1995). For remaining statistical tests I used STATISTIX (vs. 4.0;
Analytical Software, St. Paul, MN).
Results
DISTRIBUTION PATTERN
Thirty-eight fixed observation points on roads in open area were surveyed, on four
of which single passing pipistrelles were recorded (mean occurrence 0.37 (standard
deviation = 1.2) s / 5minutes). Distances to the nearest trees were 100, 175, 250, and
680 m. The latter observation was done one hour before sunrise at relatively high
light levels. During the surveys, pipistrelles were not observed foraging in open
areas.
Bat occurrence in open area was much lower than along treelines (fixed
observation points; t-test, P<0.0001). Along treelines, the average distance between
feeding observation points was 831 m (1.2 feeding observation points/km), and the
average distance between pipistrelle records (including single observations) was 412
m (2.4 records/km; Table 6.1). Observations were not randomly distributed. The
distribution ofpipistrelle observations (feeding observation points +single observations)
along treelines and wood edges (number per 1000 m) was compared to a random
(Poisson) distribution. Pipistrelle occurrence was significantly overdispersed (parameter:
number ofobservations per 1000m, dispersion parameter =1.85, Chi-square =92.59, d.f.
=45,P<0.001), indicating that they were patchily distributed.
Wind-speed and wind incidence angle affected bat occurrence around double
treelines (fixed observation points, n=72). In most cases, bats occurred both over the
road and on the leeside, or over the road only (n=62); less often bat occurrence was
restricted to the leeward side (n=10; Table 6.2). When bats were active on the leeside
only, wind-speeds, wind incidence angles and bat occurrence were higher.
Table 6.1.
Number of observations (points and single records) and distances covered in open areas
and along treelines and woodlot edges.
FEEDING OBSERVATION POINTS
# FIXED OBSERVATION
POINTS
open area
single treelines
double treelines
woodlot edge
treelines + woo Hot edg es
80
38
95
72
0
81
DISTANCE
MONITORED (m)
25570
# FEEDING OBSERVATION POINTS
/SINGLE OBSERVATIONS
0/0
534
11 / 1 1
38121
2093
45748
39 / 4 3
5/2
55 / 56
T H E
U S E
OF
E D G E
H A B I T A T S
BY
C O M M U T I N G
A N D
F O R A G I N G
B A T S
/
C H A P T E R
Table 6.2.
Pipistrelle occurrence along double treelines, wind-speed and wind incidence angle on
fixed observation points when bats were active over the road only or both over the road
and on the leeside, and when bat occurrence was restricted to the leeside.
SOUND
RECORDED (s)
FEEDING
BUZZES
WIND INCIDENCE
ANGLE (°)
WINDSPEED (m/s)
r o a d (+ l e e s i d e )
m e a n ± s.d.
n
16.1 ± 25.5
61
0.5 ± 1.1
61
2.5 ± 2.6
62
33.6 ± 28.9
43
leeside only
m e a n ± s.d.
n
P (t-test)
6 6 . 9 ± 81.1
10
<0.05
1.8 ± 2.7
10
NS
6.1 ± 2.8
10
0.001
70.2 ± 16.9
10
<0.0001
FIXED OBSERVATION POINTS
The estimated effects of the REML and IRREML analyses in Table 6.3 show that bat
occurrence is most clearly related to treeline width, height and foliage density. The
estimated marginal effects for bat occurrence are additive effects on a logarithmic
scale. This means that they can be interpreted as multiplicative effects on the
original bat occurrence scale. For not too large values (bat occurrence less than 150
s, which is half of the 'binomial' total 300 s), the estimates can directly be read as
fractional increases. E.g. the coefficient 0.052 for maximum foliage density suggests
a 5.2% increase in bat occurrence if the maximum density would be 1% higher. The
Table 6.3.
Estimates (± standard errors) of marginal effects on bat occurrence. Insect densities were
skewly distributed and transformed by adding one and taking the natural logarithm.
Effects may be interpreted approximately as relative change in bat occurrence when the
explanatory variable is increased by one unit. Asterisks mark significance in approximate
Wald-tests at the 95% confidence level.Variance components (emplogit; see appendix) of
bat occurrence calculated with REMLare indicated by A, B, C,and D, referring to
respectively transect, night within transect, observation point within transect, and
observation case random effects.
IRREML
In ( i n s e c t + 1 )
h e i g h t (m)
w i d t h (m)
foliage d e n s i t y at 3 m (%)
foliage d e n s i t y at 5 m (%)
foliage d e n s i t y at 7 m (%)
m e a n foliage d e n s i t y (%)
m a x i m u m foliage d e n s i t y (%)
foliage d e n s i t y > 5 0 % (m)
w i n d - s p e e d (Bft)
i n c i d e n c e a n g l e (degree)
0.08 (0.19)
0.27 (0.17)
0.17 (0.08) *
0 . 0 5 0 (0.016) *
0.021 (0.012)
0.012 (0.008)
0.034 (0.013) *
0.052 (0.026) *
0.32 (0.12) *
-0.10 (0.23)
0.001 (0.008)
REML
0.12 ± 0.26
0.24 ± 0.16
0.21 ± 0.08 *
0.050 ± 0.014 *
0.022 ± 0.011 *
0.017 ± 0.008 *
0.043 ± 0.012 *
0.069 ± 0.027 *
0.32 ± 0 . 1 1 *
0.22 ± 0.19
0.009 ± 0.009
A
0.6
0.3
0.3
0.2
0.3
0.3
0.2
0.3
0.2
0.5
0.4
B
C
0.2
0.0
0.0
0.1
0.0
0.0
-0.1
0.1
0.0
0.0
0.5
0.8
0.8
0.5
0.1
0.6
0.5
0.1
0.3
0.4
0.7
0.9
D
2.9
3.0
3.1
3.2
3.1
3.2
3.4
3.1
3.1
3.0
2.7
81
T H E
U S E
OF
E D G E
T A T S
BY
C O M M U T I N G
A N D
F O R A G I N G
B A T S
/
C H A P T E R
standard error 0.026 indicates that this increase percentage may be any value
between 0 and 10%.
The variance components estimated with REML (Table 6.3) indicate that most
variability is found at the level of observation points. Some relevant variability may
exist between transects and between observation points within transects, but
variability between nights within transects seems unimportant or even absent.
Figure 6.2 illustrates the marginal relation between bat occurrence and four of
the treeline parameters. Although the relations are significant, there must be many
other factors contributing to the noise in these relations. The results do not indicate
3"
I 8.... „ . i 8 9
6
9
c>
„
12
15
"
Qo " o
«S-eo oSSsoo
20
40
meanfoliage density {%}
treeline width (m)
... '
8 e8
60
70
80
maximum foliage density (m)
o"*? rfl "
°4*°i^60
90
-i
2
i-S
8
4
é8ö
6
foliage density >50% (m)
Figure 6.2.
Bat occurrence on fixed observation points against four treeline parameters.
82
6
T H E
U S E
OF
E D G E
H A B I T A T S
BY
C O M M U T I N G
A N D
F O R A G I N G
B A T S
/
C H A P T E R
that a relation with insect density or wind is absent. The measurements of insect
density might have been too imprecise to indicate 'insect-for-bats' availability. Also
the effective number of wind-force measurements (11,one per night) may have been
too low, and the wind-force itself showed perhaps not enough variation to disclose
the relationship.
FEEDING SITES
On feeding observation points, I frequently found more than one, but seldom more
than three, pipistrelles foraging. General occurrence and feeding activity were higher
than on fixed observation points (Table 6.4). Feeding observation points were hence
considered to be feeding sites.
For each 100 m of treeline and woodlot edge, the average height, width, and
foliage density of the vegetation was estimated. Bats were recorded all over the
transects, including along most of the lowest, narrowest and most permeable
treelines (usually single observations; Table 6.5). I compared treeline parameters on
feeding observation points to overall mean values ofboth transects, that is excluding
feeding observation points, each feeding observation point representing 100 m of
treeline or woodlot edge. In transects Ml and G1/G2, height and foliage density of
the treelines and woodlot edges were significantly higher on the feeding observation
points than the overall means (Table 6.5). As expected, values on single observation
points were a little lower than on feeding observation points. Many of these single
animals were probably commuting between foraging sites or between foraging sites
and their roost.
There were differences between transects Ml and G1/G2. Treelines in transect
Ml were lower, narrower and more permeable (except for 'density at 5 m' and
'maximum density') than in transects G1/G2 (t-tests, P<0.05). Nevertheless, mean
values of treeline height and foliage density on feeding observation points were
equal for both transects (t-tests, P>0.05). This indicates that pipistrelles, although
they were recorded all over transects Ml and G1/G2, selected only the highest and
most densely vegetated treelines as foraging sites.
COMMUTING FLIGHT ROUTES
Simultaneous evening counts of commuting pipistrelle bats from fixed points (Fig.
6.1) showed a strong temporal and spatial variation in the numbers of bats using a
Table 6.4.
General occurrence and feeding activity (means ± s.d.) along treelines on fixed and
feeding observation points. Mann-Whitney U-tests: * P<0.05 ** P<0.005 * * * P<0.0001
FEEDING OBSERVATION POINTS
(ALONG TREELINES)
INCLUDING WOODLOTS
n=39
sound recorded (s)
number of feeding buzzes
72.4 + 64.9***
2.1 ± 2.7 **
EXCLUDING WOODLOTS
n=34
67.1 ± 62.0 ***
1.6 ± 2.3 *
FIXEDOBSERVATION POINTS
(ALONG TREELINES)
NOWOODLOTS PRESENT
n=81
19.7 + 32.9
0.6 ± 1.2
83
T H E
U S E
OF
E D G E
H A B I T A T S
BY
C O M M U T I N G
A N D
F O R A G I N G
B A T S
/
C H A P T E R
6
Table 6.5.
Treeline parameter values (means ± s.d.) on transects (overall means), single observation
points and feeding observation points, t-tests were performed to compare overall means
to feeding observation points. * P<0.05 * * P<0.01 * * * P<0.001.
TRANSECT M1
OVERALL
PARAMETER
MEAN
SINGLE
FEEDING POINTS
OVERALL
MEAN
OBSERVATIONS OBSERVATION
(MIN-MAX)
(MIN-MAX)
<n=24)
height (m)
TRANSECTSG1/G2
5.6
(3-14)
7.0 + 1.7
(5-14)
(MIN-MAX)
(n=22)
(MIN-MAX)
7.3 + 2.4***
(5-14)
7.1
(3-12)
SINGLE
FEEDING
OBSERVATIONS OBSERVATION
POINTS
(MIN-MAX)
(MIN-MAX)
(n=26)
(n=27)
7.0 ± 1.5
(3-10)
7.8 ± 1.6*
(6-12)
width (m)
9.5
7.9 ± 3.3
9.1 ± 2.9
6.8
8.0 ± 1 . 5
7.5 ± 2.2
(2.5-14) (2.5-14)
(4-14)
(4-12)
(5-12)
(4-12)
foliage density 60.9
65.7 ± 18.1 76.2 ± 14.9*** 78.7
79.3 ± 9.9
81.8 ± 11.0*
at 3 m (%)
(26-100) (26-100)
(41-100)
(17-100) (55-93)
(66-100)
foliage density 43.0
64.9 ± 17.7
at 5 m (%)
(26-100) (26-100)
73.4 ±14.3*** 39.8
(41-100)
(0-100)
54.6 ± 19.3 65.5 + 18.7***
(0-77)
(30-100)
foliage density 14.0
at 7 m (%)
(0-100)
42.7 ±39.0*** 33.4
(0-100)
(0-100)
44.3 ± 33.2 62.0 ±28.8***
(0-77)
(0-100)
34.0 ± 33.2
(0-100)
foliage density 44.3
54.9 ± 16.5 64.1 + 18.6*** 53.2
59.4 ± 15.6 69.8 + 16.1**
mean of 3, 5,
(26-100) (26-100)
(41-100)
(28.3-100) (28.3-80.7) (38.3-100)
and 7 m (%)
max. foliage
density (%)
49.6
64.9 ± 17.7
(26-100) (26-100)
73.4 ± 14.3*** 46.6
57.9 ± 19.0 68.5 ± 16.9***
(41-100)
(0-100)
(0-77)
(30-100)
foliage density
>50% (m)
4.2
(2-14)
6.8 ± 2.9***
(2-14)
5.9 ± 2.6
(2-14)
5.8
(0-12)
6.2 ± 2.3
(3-12)
7.1 ±2.1*
(3-12)
Table 6.6.
Simultaneous evening counts of pipistrelle bats commuting over exit roads of Grijpskerke.
For route numbers see Figure 1;mv = missing value.
NUMBER OF PASSING BATS (% of t o t a l )
% COMMUTING OVER ROAD/ ON LEEWARD/ ON WINDWARD
DATE
84
WIND-DIRECTION AND
WIND-FORCE (BFT)
N
ROUTE 1
ROUTE 2
ROUTE 3
ROUTE 4
ROUTE 5
ROUTE 6
N
total
roost
24.6.94
SE 3
12 (10)
80/20/0
31 (25)
87/13/0
19 (15)
mv
24 (19)
85/15/0
30 (24)
100/0/0
10 (8)
100/0/0
126
145
21.6.96
NNW 5
39 (31)
0/100/0
43 (34)
100/0/0
18 (14)
100/0/0
10 (8)
58/42/0
12 (9)
100/0/0
5(4)
100/0/0
127
108
18.7.96
N3
27 (23)
24/76/0
31 (27)
97/3/0
12 (10)
100/0/0
12 (10)
57/36/7
17 (15)
mv
17 (15)
71/29/0
116
108
T H E
U S E
OF
E D G E
H A B I T A T S
BY
C O M M U T I N G
A N D
F O R A G I N G
C H A P T E R
specific route (Table 6.6). In 11 out of 16 counts (for two counts I have no data), 80100% of commuting bats passed over the road between the tree rows. Two times on
route 1only, the majority of bats flew along the leeward side. During 16 counts, only
one bat was recorded commuting along the windward side.
More bats used the three routes leading to the southern network (routes 1-3 in
Fig. 6.1) as compared to the three routes leading to the northern network (routes 46; Poisson regression, F a 14 =5.23, P<0.05, after correction for wind-speed and wind
incidence angle). There was no effect of wind-speed and wind incidence angle on
the number of pipistrelles using a particular commuting route (F116=0.05 and 0.04
respectively, P>0.05). Table 6.7 shows the amount of treelines and woodlot edges
within 1, 2, and 3 km from Grijpskerke built-up area. It was assumed that the
majority of bats foraged within 3 km of the roost and that they travelled along
treelines only. Within 3km, the length of treeline and woodlot edge in the southern
network was 14,069 m and in the northern network 12,569 m. The significance of
both networks as foraging areas for pipistrelles was quantified by calculating the
amount of 'potentially good foraging area' at 0-1, 1-2, and 2-3 km. Mean parameter
values at feeding observation points (Table 6.5) defined 'potentially good foraging
areas'. In the southern network, the total length of treelines and woodlot edges
meeting these criteria was higher than in the northern network, especially within 2
km from the village (Table 6.7). This shows that there were more potential foraging
areas available at closer distance in the southern network, which supports the
hypothesis that pipistrelles use the shortest commuting routes leading to the best
foraging areas.
Table 6.7.
Amount of treelines and woodlot edges (m) within 1,2, and 3 km north and south from
Grijpskerke built-up area. Mean parameter values at feeding observation points (Table
6.5) were used asminimum values to define 'potentially good foraging areas'.
AMOUNT OF TREELINE + WOODLOT EDGE IN m
2-3 KM
TOTAL
0-1 KM
1-2 KM
PARAMETER
total
north
south
4049
3858
4085
5146
42121
51921
2346
4196
height >7.8 m
north
south
2270
2715
1788
2730
1443
1460
5501
6905
mean foliage density >70%
north
south
1286
1334
1382
2158
1958
133
4626
34825
maximum foliage density>69%
north
south
1477
1572
2271
3460
3212
5097
6960
10129
foliage density >50% >7.1 m
north
south
2667
3001
1551
3143
2577
2445
6795
8589
height >7.8 m and
mean foliage density >70%
north
south
1286
1334
1191
2158
491
730
2926
4222
85
THE
U S E
OF
E D G E
H A [
C O M M U T I N G
A N D
F O R A G I N G
C H A P T E R
Example of atreeline in Walcheren, showing variation in foliage density at different
heights (photo: Ben Verboom).
Discussion
This study demonstrates the significance of sheltered habitats where bats can find
relatively wind-free sites to feed. The study was performed in a coastal area with a
relatively windy climate, where the presence of landscape elements with dense
vegetation as windbreaks is believed to be crucial for resident bat populations.
Especially in the intensively used agricultural areas of north-western Europe, fields
and meadows can be extremely poor in insects, and bats may be largely dependent
on woody vegetations to feed.
Furthermore, this study shows that bats preferably choose commuting routes
to areas where good foraging patches are relatively close to the maternity roost. The
presence of such patches at close distance to the roost may be of critical importance,
especially to lactating females which, on average, make short foraging flights (Racey
&Swift 1985) and usually return to the roost more than once during a night to suckle
their young (Swift 1980).
In Walcheren, the landscape is relatively uncomplicated. Treelines and other
woody vegetation are rather uniform in species composition over most of the area.
Spatial and temporal variations in food abundance are mainly caused by wind in
combination with treeline structure. Hence, the locations and profitability of insectrich patches may vary from day to day or even change within a night. In areas with,
86
T H E
U S E
OF
E D G E
H A B I T A T S
BY
C O M M U T I N G
A N D
F O R A G I N G
B A T S
/
C H A P T E R
for instance, riparian woodland, patches rich in insects may be less affected by
weather conditions, and persist for longer periods. Here, the distribution of
predictable, high density food patches may allow bats to adopt a different optimal
foraging strategy with longer commuting flights (Charnov 1976: marginal value
theorem), in spite of increased prédation risk.
Protection from wind may affect bats in two ways. First, small insects
concentrate on the leeside of the windbreaks (Lewis 1969a/b, 1970; Lewis &
Stephenson 1966; Lewis &Dibley 1970). The origin of these insects may be in the
windbreak itself or in the meadow or field neighbouring the windbreak, but a
significant proportion may be the result of accumulation of small insects which have
been blown from elsewhere. Unfortunately, due to strong variation in the samples,
our insect sampling method proved to be inappropriate to allow proper conclusions
with respect to insect densities. More sweeps per sample at a reduced height (for
instance 2.5-3 m above the ground) might give better results.
Wind furthermore affects the flight performance and energy expenditure of
the bats themselves. The groundspeed of a flying animal decreases with increasing
headwind strength, and a small and relatively slow flying animal such as the
pipistrelle bat, is strongly affected by wind (e.g.Pennycuick 1969;Norberg 1990). At
a headwind of 7 m/s or more, a pipistrelle would not be able to fly in a forward
direction at all (Pennycuick 1969). Tailwinds have the opposite effect of headwinds,
and winds from besides the animal have an intermediate effect: when the angle
between flight direction and wind direction is greater than 90°°, flight costs increase
(Pennycuick 1969; Norberg 1990). Furthermore, wind affects the manoeuvrability of
bats (Schnitzler 1971), thus decreasing feeding efficiency.
Bats used all treelines in the study areas near Meliskerke and Grijpskerke as
flyways, including the lowest, narrowest and most permeable ones, but were seldom
observed in the open areas during the study. Nevertheless, pipistrelle bats are able
to traverse open areas over several hundreds of meters, as reported from earlier
studies (De Jong 1994; Verboom & Huitema 1997; Chapter 2) and personal
observations. These observations suggest that they use well-defined flyways through
fields and meadows to reach isolated feeding areas. With the methods applied here,
such flyways may have been overlooked.
SIGNIFICANCE FOR BAT CONSERVATION
The conclusions of this study have implications for the conservation of bats. In
particular in insect poor agricultural areas with a windy climate, bats may largely be
dependent on windbreaks providing shelter toboth bats and the insects they feed on.
Land management and development should hence focus on the conservation and
creation of wood patches and linear vegetations, such as hedgerows and treelines
which are sufficiently high, wide, and densely vegetated, and hence provide
sufficient shelter in windy conditions, to be useful as feeding sites. Double treelines
are more suitable as commuting corridors than single ones. Furthermore, potential
feeding sites should be close to roost sites, and interconnected and connected to
roosts by vegetation corridors.
87
T H E
U S E
OF
E D G E
H A B I T A T S
BY
C O M M U T I N G
A N D
F O R A G I N G
B A T S
/
C H A P T E R
Appendix
Application of REML and IRREML in modelling
relations between bat occurrence and environmental
variables
The statistical analysis should respect the structure of the 81 observation cases.
Observations were m a d e in four transects, during 11 nights, and at 36 different fixed
observation points. Nights a n d observation points are nested w i t h i n transects,
observations are m a d e at certain combinations of night and observation point. A
schematic representation is as follows:
transect
(n=4)
treeline
^ observation
v a r i a b l e s - * point (n=36)
insect and wind
variables
^
night v
(n=il)«
observation
c a s e (n=si)
, . ,.
,
(wind-force)
^ bat occurrence
measurements
The direction of the arrows indicates the intention to m o d e l bat occurrence as
a function of the other variables.
Standard tools for the statistical analysis of relations between variables are
linear and generalized linear models (GLMs, McCullagh & Neider 1989). Examples
of GLMs are logistic regression (appropriate w h e n the response variable is a fraction,
such as recorded bat s o u n d per 5 minutes), and Poisson regression (appropriate
w h e n the response variable is a count). If the data are not really from a binomial or
Poisson distribution, w h i c h is the case for the bat data, a standard option is to
estimate one extra dispersion factor (quasi-likelihood method; see McCullagh &
Neider 1989, chapter 9). However, all these m o d e l s assume that the structure in the
set of observation cases is modelled via the explanatory variables, so that the r a n d o m
(error) terms are i n d e p e n d e n t . To account for d e p e n d e n c e between observations the
models should be extended w i t h extra r a n d o m terms representing the structure of
the data. The resulting models are k n o w n as mixed models, i.e. models w i t h mixed
fixed a n d r a n d o m explanatory variables. In this way, linear modelling (regression
and analysis of variance) has been generalized to REML (Residual M a x i m u m
Likelihood, Patterson & T h o m p s o n 1971), and, more recently, generalized linear
modelling to IRREML (Iteratively Reweighted REML, Engel &Keen 1994). See Engel
(1997) for a recent overview. Computations are easily performed w i t h the statistical
88
6
T H E
U S E
OF
E D G E
H A B I T A T S
BY
C O M M U T I N G
A N D
F O R A G I N G
B A T S
/
C H A P T E R
program Genstat (Genstat 5 Committee 1993, 1995). REML is a standard feature of
the program, IRREML is available as a procedure (Keen 1996).
For analysis of the bat data (sound recorded per 5 minutes), use of IRREML
seems the most rational approach. No analysis of number of feeding buzzes has been
undertaken, as there seemed to be too little information in the values (mostly 0 or 1).
For our problem, the specification of the random terms is easy if one considers the
scheme above. There are four levels of random variation: transect, observation point
within transect, night within transect, and observation case.
In Genstat, REML and IRREML will estimate variance components (with
standard errors) for each of the four random terms. These components may be
compared to see which random terms are most important. However, in IRREML the
unit level variance component is estimated at a completely different scale than the
other ones, so that the direct comparison of variance components is restricted to the
higher-level estimates. Mainly for this reason the IRREML analyses were
supplemented with REML analyses on transformed data: the empirical logit
(emplogit) transformation for recorded sound per 5minutes (t soun[ j):
emplogit (t smind ) = In { (t s o u n d + 0.5) / (300 -t s o u n d + 0.5) )
This data transformation implies a certain variance function (variance as a function
of the level) for t u d . This function is not compatible with the variance function in
the IRREML model. However, REML on the transformed data is a relatively standard
approach for analyzing this type of data, so large differences between the results
from both approaches would be areason tobe more concerned with the precise form
of the variance function for these data. In this sense, performing both analyses
provides a protection against important misspecification of the model.
The fixed effects can be included in the model either each on its own
(marginal effects) or together (conditional effects). In the problem presented here,
many of the explanatory variables were approximately measuring the same treeline
characteristics. Hence it is not sensible to estimate effects of changing one variable
while keeping all others fixed (as is done with conditional modelling). Therefore all
analyses have been performed with only one explanatory variable as a fixed term in
conjunction to the four random terms mentioned above. For t
d and an
explanatory variable x the (quasi-binomial) IRREML model can be written as:
l n
I E^soundV^OO-Ettsound)] »= H + « i + ßij + Yik +
(tsound) = ° 2 3 0 0 E ( t s o u n d ) I 3 0 0 - E ( t s o u n d ) |
8x
ijk
v a r
where cCj, ß-, yik are the random effects of transect i, observation point ij, and night
ik, respectively, u and ôare the fixed effects: the constant and the marginal effect of
variable x, respectively, o 2 is the dispersion factor which has to be estimated from
the data.
89
T H E
90
U S E
OF
E D G E
H A B I T A T S
C O M M U T I N G
A N D
F O R A G I N G
A T S
/
C H A P T E R
T H E
U S E
OF
E D G E
H A B I T A T S
BY
C O M M U T I N G
A N D
F O R A G I N G
B A T S
/
C H A P T E R
7. Summary and general discussion
The significance of edge habitats to bats has been demonstrated in several studies
(Furlonger et al. 1987; Grindal 1996; Krusic & Neefus 1996; Walsh & Harris 1996a,
1996b). This thesis deals with the use of edge habitats, in particular hedgerows,
treelines, forest edges, a n d canal banks by c o m m u t i n g and foraging bats. The results
are applicable in semi-natural and natural habitats as well. The studies were aimed
to separate the effects of different factors explaining the association of bats w i t h edge
habitats, in order to point out their relative importance. Indications were found that
all factors considered, i.e. food a b u n d a n c e , shelter from w i n d , shelter from
predators, and the use of vertical landscape elements as acoustic navigational
landmarks, play a role in the assessed relations between bats and edge habitats, and
that their relative importance varies d e p e n d i n g on the situation.
This chapter starts with a general discussion of results. After that, the
implications of this study for bat conservation are discussed and a n u m b e r of
recommendations are provided to i m p l e m e n t the results into the management and
creation of bat habitats in agricultural areas.
Predators, food and wind
COMMUTING ROUTES
Prédation risk is often emphasized as an important factor controlling the movements
of bats (e.g. Rieger et al. 1990; De Jong 1994; Rydell et al. 1996). Unfortunately, the
impact of this factor is hardly testable in the field, and for m u c h of the observed
behaviour in relation to vertical elements, prédation risk can be put forward as an
alternative explanation. However, prédation on bats is likely to take place mainly
w h e n light levels are high (Rydell et al. 1996), that is during dusk and d a w n or at
high latitudes, and near roosts or on commuting routes, w h e r e bats can be expected
at relatively high densities (Fenton et al. 1994). This hypothesis is supported by the
data (Chapter 3): pipistrelle bats mainly c o m m u t e d over the road between the
treelines, in spite of stronger w i n d and lower insect a b u n d a n c e as compared to the
leeward side.
FORAGING AREAS
Food a b u n d a n c e clearly is a major factor affecting the m o v e m e n t s and distribution
of bats (e.g. Racey & Swift 1985; De Jong &Ahlén 1991). From an optimal foraging
perspective, it can be predicted that bats avoid open areas where insect a b u n d a n c e
is lower than near landscape elements. Ekman &De Jong (1996), however, argue that
the energetic cost of crossing insect poor open areas is relatively low and that the
avoidance of open areas with low insect densities by commuting bats cannot be
explained by energetic constraints due to scarcity of food. They conclude that
another factor, such as predator avoidance, must be responsible for the low presence
of m a n y species in open areas. In support of this conclusion, Ekman & De Jong found
that pipistrelle bats preferred forest edges in spite of higher insect a b u n d a n c e in the
adjacent open areas. In the present study areas (Chapter 3), insect a b u n d a n c e was
91
T H E
U S E
OF
E D G E
H A B I T A T S
BY
C O M M U T I N G
A N D
F O R A G I N G
B A T S
/
C H A P T E R
found to decrease with distance to treelines. Insect abundance in open areas,
however, apparently does influence the distribution pattern of bats near treelines.
When insect abundance in the open area adjacent to the treeline was relatively high,
there was a strong correlation between bat and insect abundance, and bat activity
only slightly decreased with distance from treeline (Chapter 3). When the open area
was poor in insects, a bat-insect relation was absent, and bats stayed close to the
treeline.
An experiment to test the hypothesis that pipistrelle bats exploit patches of
prey in an open area with, normally, relatively low insect abundance was carried out
(H. Huitema & B. Verboom, unpublished results). The response of pipistrelle bats to
artificially induced insect patches at 25 m from a (double) treeline on the leeward
side was examined. Insect concentrations were attracted by ultraviolet light. Soon
after turning on a UV-light, a dense cloud of insects was formed close to the lamps.
During the four on/off sessions, pipistrelle foraging activity increased rapidly around
the light, and a maximum of 17 feeding buzzes per 5minutes were recorded.
The same experiment was carried out at 3 m on the windward side of the
treeline. During one out of 10 on/off sessions, a pipistrelle reacted by feeding around
the lamp. During all sessions, both on the leeward and the windward side,
pipistrelles passed or foraged close to the treeline on the leeside or over the road
between the treelines. The results prove that pipistrelle bats are capable and willing
to forage in open areas once insect abundance is high. The poor reaction on the
windward side may be explained by the conservative searching behaviour ofthe bats,
which may have constrained them to locate insect concentrations outside their
regular foraging routes between the treelines and on the leeside.
Shelter from wind affected the occurrence of foraging bats as well (Chapters 3
and 6). Wind and insect abundance are interrelated effects on bat distribution near
vertical elements, since wind strongly affects the distribution of insects as well (e.g.
Lewis 1970). This explains why bats mainly forage on the leeward side of vertical
elements during strong winds (Chapter 3).This also explains the strong influence of
wind-protection on the activity of foraging pipistrelles along treelines (Chapter 6).
Furthermore, the distribution of wind-protected feeding sites proved to influence the
use of commuting routes to foraging sites (Chapter 6).
In conclusion, both food abundance and shelter from wind affect the foraging
behaviour and distribution ofthe bats studied near landscape elements. However, the
results furthermore suggest the involvement of one or more additional explanatory
factors for the relationship between bats and treelines (Chapter 3). Firstly, because a
distance relation of pipistrelle bats to treelines remained significant after the effects
of wind and insects were ruled out. Secondly, when insect abundance was low, the
average peak of pipistrelle occurrence on the leeward side was significantly closer to
the treeline than both the average peaks of insect abundance and wind reduction.
There are two alternative explanations:
Prédation risk. For bats, the risk of being caught by owls and other avian
predators that hunt by vision, may be considerable (Speakman 1991). However,
prédation risk is likely to become less significant when light levels decrease. This
might explain why bats commuting between the treelines at dusk shifted to the more
exposed leeward side after the commuting period (Chapter 3). It is assumed that
predator avoidance played a less significant role then. Similar behavioural responses
92
T H E
U S E
OF
E D G E
H A B I T A T S
BY
C O M M U T I N G
A N D
F O R A G I N G
B A T S
/
C H A P T E R
to decreasing light levels were found in previous studies (Nyholm 1965;Rydell et al.
1994).
Echolocation contact seems a plausible explanation. Support for this
hypothesis is given in Chapter 3, where pipistrelle occurrence in the insect-poor
situation was almost entirely restricted to a zone where acoustical perception of the
treeline was possible. Hence, the logical step was taken to further examine the
possible role of echolocation contact to vertical landscape elements.
Echolocation:
landscape elements as navigational landmarks
Although echolocation studies have demonstrated that many bat species are very
flexible in their echolocation behaviour (e.g. Rydell 1990; Obrist 1995), it is
commonly accepted that the design of echolocation pulses emitted by bats is adapted
to characteristics of their specific environment, and hence to an optimal flying
distance from clutter producing objects. In this study it was hypothesized that bats
use vertical landscape elements as landmarks when navigating through an area. The
first step was to prove that bats maintain contact with vertical landscape elements by
echolocation. The pond bat study (Chapter 5) indeed provides evidence that
landscape elements are perceived by these bats over long distances. They adapt
echolocation signals to increasing distances to canal banks to enable acoustic
perception over long distances. A next step would be to prove that bats actually need
landscape elements as navigational landmarks. This study provides no evidence for
this. There are many observations of commuting and foraging bats in open areas, far
from vertical landscape elements, where perception of these elements by
echolocation is not possible. For instance, the presence of pipistrelles and serotines
along relatively isolated forest fragments in Twente (province of Overijssel), strongly
suggests that open areas of 150 m or more are frequently crossed (Chapter 2). During
a mapping of flight routes in Walcheren (province of Zeeland), two daily pipistrelle
commuting routes appeared to bridge open areas of 140 and 170 m respectively (B.
Verboom, unpublished data). The latter crossing even included a four-lane motorway.
These observations at least imply that bats do not need landscape elements for
acoustical reasons.
Vision might play arole here. Previous studies have demonstrated that in some
bat species vision is involved in orientation over long distances (Davis 1966;
Williams et al. 1966), or obstacle avoidance (Chase & Suthers 1969), or even in
finding prey on the ground (Bell 1985). Vision may especially be important in
commuting bats around dusk and dawn, when light levels are relatively high.
Nevertheless, many bats still seem to prefer to stay close to vertical landscape
elements, rather than to cross open areas. Mostert &Van Winden (1989) describe an
example of commuting Myotis daubentonii, which, to reach their feeding grounds over
a canal, made a considerable detour along awell developed hedgerow, instead of flying
a shorter route along more sparsely vegetated hedgerows with a 100 m wide gap. In
Walcheren, bats crossed the 170 m open area which included the motorway at the
narrowest point only, that is where the distance between woody elements was smallest
(see also De Jong 1995). To reach the point of crossing, the bats first had to make a
93
T H E
U S E
OF
E D G E
H A B I T A T S
BY
C O M M U T I N G
A N D
F O R A G I N G
B A T S
/
C H A P T E R
significant detour along atreeline.Apparently, they were aiming toreduce the travel time
and distance in open area, which indicates that the latter is abarrier to pipistrelle bats.
To examine whether or not commuting bats would use a newly created
(artificial) vertical structure as an acoustical guideline to a patch rich in insects, I
conducted a brief experiment in Walcheren in 1995. Bamboo sticks were used to
exclude possible effects of shelter from wind (to bats and insects) and from
predators. The structure was placed in agrassland between the treeline and an insect
rich patch, and consisted of a 100 m long row of 3 m high bamboo sticks. The
treeline was used as a daily commuting corridor by ca. 30 pipistrelle bats. The angle
between the row and the treeline was 45° and the direction of the row corresponded
with the direction of evening commuting flight. Distances between the bamboo
sticks varied from 0.5 m close to the treeline to 1 m further away from it.
During evening commuting periods and the first two hours of darkness over a
period of eight days, bat activity was monitored by two persons, one close to the
treeline, the other walking along the row of sticks. On two occasions only, a
pipistrelle commuting along the treeline obviously responded to the sticks by
making several turns around the first 5 m of the row. No bats were recorded flying
along the line of sticks. If pipistrelle bats had followed the line of bamboo sticks, the
conclusion would have been that the sticks were acting as an acoustic guideline, and
that this feature was sufficient to attract the bats. The negative response by the bats,
however, does not allow for conclusions. Firstly, the element might have been
unattractive to bats due to the absence of shelter from predators (commuting bats),
and/or the lack of food and shelter from wind (foraging bats). Secondly, the duration
of the experiment might have been too short. If information about their environment
is stored in cognitive maps, this may result in conservative behaviour in the use of
flight routes. Hence, the bats may need a longer period to respond to anew situation.
This agrees with the outcome of the experiment with UV-lamps, which suggested
that conservative commuting and foraging behaviour prevented bats to detect and
exploit insect patches on the windward side of a treeline.
In Chapter 3, the duration of interpulse intervals is assumed to be a measure
for the maximum sonar range. For species intolerant of pulse-echo overlap, this
interval indeed sets the maximum of sonar range. Under field conditions, however,
the effective distance over which echolocation signals and their reflected echoes are
perceived may be smaller, because the perception of sound through air is limited by
geometrical spreading loss and by energy absorption (Neuweiler 1990). Since the
latter increases with frequency, maximum sonar ranges estimated from interpulse
intervals will be better approximated by bats emitting low frequency QCF signals
than by bats emitting high frequency FM signals.
A further test of the 'acoustical link hypothesis' for other species would be to
correlate their interpulse intervals with their flying distance from landscape
elements. Table 7.1 shows average search phase interpulse intervals of several
vespertilionid species recorded in The Netherlands, the corresponding maximum
sonar range, and data by Baag0e (1987) of estimated flying distances from large
vertical objects (trees, walls, etc.). Although the distance-to-object estimations in
Table 7.1 are rather crude to draw conclusions, all species listed seem to fly mainly
within their presumed maximum sonar range from large objects. To further establish
this relation, more detailed investigations are needed.
94
7
T H E
U S E
OF
E D G E
H A B I T A T S
BY
C O M M U T I N G
A N D
F O R A G I N G
B A T S
/
C H A P T E R
Table7.1.
Average durations of search phase interpulse intervals, corresponding maximum sonar
ranges, and estimated flying distances from large vertical objects (trees, walls, etc.) of
vespertilionid species recorded in The Netherlands. 1 Intervals between search phase calls
(range of means) given by different authors: Ahlén (1981, 1990), Zingg (1988), Jones &
Rayner (1988), Kalko & Schnitzler (1989a, 1993), Schumm et al. (1991), Vaughan et al.
1997, Verboom (unpublished data) and Chapters 4 and 5). ?no data. 1 * when flying in
buildings; 2 Data from Baagoe (1987). Distances to large objects e.g.vegetation were
roughly divided into three classes:<1 m, 1-8 m, and >8 m.The most important classis
presented in the table.
SPECIES
M. daubentonii
M. dasycneme
P. auritus/austr.
M. emarginatus
M. nattereri
M. bechsteinii
M. myotis
M. myst./brandtii
B. barbastellus
P. pipistrellus
P. nathusii
E. serotinus
E. nilssonii
N. leisleri
V. murinus
N. noctula
N. lasiopterus
INTERPULSE
INTERVAL1 (ms)
MAXIMUM SONAR
RANGE(m)
65-79
90-110
45 / 190
26-91
77-80
ss^-gß
11-13
15-19
8 / 32
4-15
13-14
14-16
?
?
88-95
64-115
80-98
134
116-150
200
177-350
210
300-336
15-16
11-20
14-17
23
20-26
34
30-60
36
51-57
?
?
DISTANCE TO
OBJECTS2 (m)
1-8
1-8
1-8
?
1-8
1-8
?
1-8
?
1-8
>8
>8
>8
?
>8
>8
?
Habitat fragmentation
The apparent importance of edge habitats for many bat species (Furlonger et al. 1987;
Limpens & Kapteyn 1991; Grindal 1996; Krusic & Neefus 1996; Walsh & Harris
1996a/b) explains why a low or moderate degree of forest fragmentation may have a
positive effect on bat abundance (Perdue & Steventon 1996).This positive effect may
exist as long as the habitat fragments are sufficiently interconnected by woody
landscape elements to allow bats to travel between them. When the process of
fragmentation proceeds, discontinuities in connective landscape elements may
become larger. For commuting bats, a newly created open gap in a fixed flight route
of less than twice its maximum sonar range, may not be a problem. But when
distances between fragments become larger, barriers may arise and fragments may
become isolated. This situation is expected to decrease bat abundance. Eventually,
due to large-scale clearcutting of forest and other woody landscape elements,
landscapes with large open areas, devoid of significant vertical elements, may be
left. In large open areas, bats generally occur in low numbers or are even absent
(Furlonger et al. 1987; Estrada et al. 1992; Crampton & Barclay 1996; Grindal 1996;
Walsh & Harris 1996a/b; Chapter 2). Large open areas may simply be unattractive to
95
T H E
U S E
OF
E D G E
H A B I T A T S
BY
C O M M U T I N G
A N D
F O R A G I N G
B A T S
/
C H A P T E R
bats because there are no suitable feeding areas. Close to vertical elements, bats
generally find more food and shelter from wind and predators. This mav explain
why many species use fixed commuting and foraging routes. Furthermore, in the
light of optimal foraging, it seems less efficient to search for food in open areas, even
when rich patches of insects are present.
For many bat species, there will be an optimal situation, in which the amount
of continuous edge habitats reaches a maximum. It is likely that the degree of
fragmentation established in old agricultural landscapes used to promote bat
abundance as compared to the former natural situation of continuous forest. In
several parts of Twente, for instance, the old configuration of woody landscape
elements is still intact, and discontinuities in the network of treelines and
hedgerows are generally small. In many other areas in The Netherlands and northwestern Europe, however, fragmentation has reached a more advanced stage and has
become, or is likely to become, a major constraint on the occurrence of bats.
The use of edge habitats by bats in The Netherlands
Bats show specific adaptations in flight morphology and echolocation signal design
to a particular habitat type (e.g. Norberg & Rayner 1987; for reviews see Neuweiler
1989; Fenton 1990; see also Chapter 1).Hence, interspecific differences in the use of
edge habitats are expected. The relationship between abat's functional "design", and
its commuting and foraging behaviour may help us to make predictions about the
use of landscape elements by particular bat species.
Morphological and perceptual (echolocation) differences between species
appear to be related to the bats' flying distance to large objects, e.g. vegetation, walls
or the ground, in their preferred habitat type. In Table 7.2, the species recorded in
The Netherlands (Kapteyn 1995; Limpens et al. 1997) are tabulated according to
their main foraging habitat and foraging technique. Most species in The Netherlands
occur in closed habitats, whereas fewer species are typical for edge or open habitats.
Species from closed habitats include the Rhinolophus and Plecotus species, and the
gleaning Myotis species. The remaining species are all aerial hawkers. Edge species
are slow-hawking species, and at least include both Pipistrellus and Eptesicus
species, although the latter are frequently found in more open situations. Species
from open habitats are fast aerial hawkers, and include Vespertilio murinus and
Nyctalus species. On average, species of closed habitats are smaller than species of
open habitats.
There are clear differences in wing-morphology and the types of echolocation
used between species from open, edge and closed habitats (see also Chapter 1).Jones
(1993b) grouped British bat species (all of which are in Table 7.2 as well) according
to their wing morphology. Principal Component Analysis (PCA) was used to correct
for size-effects (see Norberg &Rayner 1987). When wing-loading components were
plotted against aspect ratio component, this revealed three clusters which mainly
differed in their wing-loading components (low,average and high;Jones 1993b:Fig.1).
Species with low and high wing-loading components roughly contained
species of closed and open habitats, respectively. Species with intermediate wingloading components consisted of edge species and several species of more closed
96
T H E
U S E
OF
E D G E
H A B I T A T S
BY
C O M M U T I N G
A N D
F O R A G I N G
B A T S
/
C H A P T E R
habitats. The positions of the small P. pipistrellus and the much larger E. serotinus
in the scatter plot are very close (Jones 1993b:Fig. 1),indicating similar wing shapes.
Thus, flight performance, that is after controlling for body size, cannot explain the
assessed differences between these species with respect to their flying distance from
vertical landscape elements (Chapters 2 and 3).
There is,however, evidence that specific foraging and echolocation behaviour
can be predicted from a bat's size. In general, flight speed increases with body size,
and with wing-loading (Norberg & Rayner 1987). Large and fast flying bats are likely
to be less sensitive to wind, and less vulnerable with respect to prédation, which
may explain differences between E. serotinus and P. pipistrellus.
A bat's size is also correlated to echolocation features. Signal frequency, for
instance, is negatively correlated to body size (Barclay & Brigham 1991).
Furthermore, many large species emit signals ofhigher intensity and longer duration
(due to a longer QCF component) than small species. These features should result in
a longer echolocation range, and, assuming that bats keep acoustic contact with
vertical landscape elements, this may explain why large bats, such as E. serotinus,
generally fly at greater distance from vertical objects than small ones, such as P.
pipistrellus. Furthermore, signal frequency seems to be negatively correlated to
dietary niche breadth (Barclay 1986). E. serotinus has a larger dietary niche breadth
than P. pipistrellus and includes large insects in its diet as well. Since large insects
occur in more open areas than small insects, this may explain the frequent
occurrence of E. serotinus in open environments.
In conclusion, the conservation and creation of edge habitats in cultivated
areas is expected to influence the occurrence of virtually all species in The
Netherlands in a positive way, but the response to conservation measurements is
expected to differ between species. Small species of closed environments strongly
avoid open areas, and stay close to vegetation during both commuting and foraging.
In fragmented landscapes, the presence of continuous and dense vegetation
corridors connecting woods is essential for these species.
In The Netherlands, several species, especially M. daubentonii, M.
dasycneme, and P. pipistrellus, often have commuting routes over several kilometers
along hedgerows, treelines and forest edges, and several edge species also find
feeding areas along these elements. For them, a cohesive network of edge habitats
over a wide area is of major importance, especially in cultivated areas where travel
distances are relatively long.
According to Fenton (1990), the occurrence of bats in particular habitat types
is constrained by their ability to deal with narrow spaces and clutter. Consequently,
bat species cannot forage effectively in habitats which are more closed (cluttered)
than the habitat they are specifically adapted to. Practically, this means that species
of closed (cluttered) habitats can be expected along edges as well, and that open air
foragers are expected to be absent from edge habitats. For large species which are
adapted to open habitats, edge habitats may be less important as foraging areas or as
connective elements. However, for those
species that feed on large insects, the presence of windbreaks may increase
foraging opportunities in open areas (Chapter 2).
97
T H E
U S E
O F
E D G E
C O M M U T I N G
A N D
F O R A G
i A T S
I
C H A P T E R
Table 7.2.
Wing morphology, echolocation features, and habitat use of bat species recorded in The
Netherlands* known to reproduce in The Netherlands. Foraging techniques: ah aerial
hawking, ph perch-hunting, fg foliage gleaning, gg ground gleaning, tr trawling (main
technique(s) in bold). Use of commuting corridors: +follows commuting corridors, ++
WING MORPHOLOGY
WING
LOADING
SPECIES
FORAGING
TECHNIQUE(S)
PULSE-TYPE(S)
PULSE
PEAK FREQUENCY DURATION
greater horseshoe bat
Rhinolophus
fernimequinum
12.21
10.632
6.11
5.152
p h , a h , fg, gg
fm 8 0 - 8 5
30-40
lesser h o r s e s h o e b a t
Rhinoloph us
hipposideros
7.ll
5.7 1
ah, fg, gg, p h
fm-CF-fm 1 0 5
50
D a u b e n t o n ' s b a t*
Myotis
daubentonii
7.0l
8.262
6.3I
6.152
tr, a h
FM 45
3-5
p o n d bat*
Myotis
dasycneme
l o n g - e a r e d b a t*
Plecotus
auritus
grey l o n g - e a r e d bat *
Plecotus
austriacus
G e o f f r o y ' s / n o t c h - e a r e d b a t*
Myotis
emarginatus
N a t t e r e r ' s b a t*
Myotis
nattereri
10.41
6.81
tr, a h
7.ll
5.892
7.9I
5.7I
5.982
6.11
fg, a h
F M 35
fm-QCF 35
F M 50-35
5-7
15-25
1-2
fg, a h
FM 50-35
1-2
7.ll
5.91
6.41
6.322
F M 45-55
(no c l e a r p e a k )
F M 50 ( n o c l e a r
peak)
1-3
6.1'
6.022
fg, a h
(gg. Ph)
fg, a h , tr, gg
Bechstein's bat
Myotis
bechsteinii
mouse-eared bat
Myotis
myotis
w h i s k e r e d b a t*
Myotis
mystacinus
9.Ol
9.512
11.21
6.0 1
5.572
6.3I
fg. gg. a h ?
F M 50
2-3
gg. fg. a h
F M 35
?
7.1'
6.412
6.0'
6.532
a h , fogl
FM 45
2-3
Brandt's bat
Myotis
brandtii
barbastelle
Barbastella
barbastellus
pipistrelle *
Pipistrellus
pipistrellus
6.472
6.212
ah, fg
FM 45
2-3
6.0l
ah
C F - F M 32-35
4-5
8.11
5.972
7.5I
6.472
ah
FM-qcf 45-50
fm-QCF 4 2 - 4 5
5
7
Nathusius' pipistrelle *
Pipistrellus
nathusii
serotine *
Eptesicus
serotinus
7.2 1
9.132
12.21
11.092
9.8l
6.562
6.5I
6.572
ah
ah, fg
FM-qcf 38-40
fm-QCF 35-37
F M - Q C F 25-30
5-7
5-10
5-8
northern bat
Eptesicus
nilssonii
8,ll
6.6i
ah
F M - Q C F 27-32
10
L e i s l e r b a t*
Nyctalus
leisleri
19.31
15.242
7.9I
7.02 2
ah
FM-QCF 28
fm-QCF 25
8-10
14
p a r t i - c o l o u r e d bat
Vespertilio
murinus
10.21
7.Ol
ah
fm-QCF 25-27
F M - Q C F 27
?
noctule *
Nyctalus
16.11
17.282
7.4I
8.212
ah
?
?
ah
QCFand
FM-QCF 20
F M 20-30
QCFand
FM-QCF <20
noctula
greater noctule
Nyctalus
lasiopterus
98
ECHOLOCATION
ASPECT
RATIO
9.1
1
2-3
18->20
2-5
?
THE
U S E
OF
E D G E
C O M M U T I N G
HAI
A N D
F O R A G I N G
A PTER 7
strongly follows commuting corridors, - no well defined commuting corridors.
Data on wing morphology: 1Norberg & Rayner (1987), 2Jones (1991);
echolocation: Weid (1988), Schumm et al. (1990), Limpens et al.(1997), Verboom
& Huitema (unpublished results); habitat use: Limpens et al. (1997), Sierro &
Arlettaz (1997), H.J.G.A. Limpens (pers. comm.).
HABITAT USE
/IAIN FORAGING HABITAT
lose to vegetation in open,
road-leaved woodland
ledgerows, treelines, banks,
iparian woodland
sheltered) ponds, ditches,
anals, slow-flowing streams,
arest openings
ikes, ponds, wide canals
OPEN, EDGE,
CLOSED
USE OF COMMUTING
CORRIDORS
COMMUTING DISTANCE
(km)
closed
?
max. 2 (?)
closed
++ hedgerows, treelines
mean 2-3
'closed/edge'
++ hedgerows,
treelines, wood edges
max. 5
'closed/edge'
++ treelines, hedgerows,
canals
forest lanes/edges,
treelines
max. >15
arest, forest lanes/ openings,
ouble treelines, wooded banks
•eelines, hedgerows,
rchards, forest edges, buildings
Drest edges, among treecrowns,
uildings
iparian woodland,
heltered streams and ponds
dges of forest and woodlots
closed
closed
îrest lanes/openings/ edges
closed
west clearings/openings/
mes/edges, open woodland
)rest clearings/openings/
mes/edges/ponds
bove forest canopy,
jrest edges/lanes
'eelines, hedgerows, forest
dges, vegetated banks,
îrdens, street lamps
>rest edges/openings,
eelines, above waters
max. 1.5, mean <1
?
?
+ treelines, hedgerows,
banks
+ forest lanes/
edges, treelines
+ forest lanes
max. >10
max. >10
closed
+ forest lanes, over
forest canopy
+ forest lanes, treelines
closed
+ forest lanes ?
?
closed/edge
?
?
edge
++ treelines, hedgerows,
wood edges, buildings
max. 5
edge
+
?
'assland with treelines/
edgerows, woodlot edges,
pen marshland
irest and woodlot edges/
aenings, marshland
aen spaces in forest,
prest edges, over forest canopy,
30ve waters, street lamps
aen spaces in forest,
rmland, above waters,
reet lamps
arshland, above lakes, rivers,
mais, meadows, fields
edge/open
+ treelines,
hedgerows, hanks
mean <1
max. 3-4
edge/open
?
?
open
-
open
_?
jen spaces ?
open
closed
closed
closed
open
?
?
max. <1.5
?
?
mean 3-6, max. 20
-
?
99
T H E
U S E
OF
E D G E
H A B I T A T S
BY
C O M M U T I N G
A N D
F O R A G I N G
B A T S
/
C H A P T E R
Application of results in landscape planning
Since bats generally use a mosaic habitat landscape with spatially separated feeding
grounds, summer roosts and winter roosts, bat abundance provides a good
indication of the spatial connectivity of different landscape parts. Therefore,
conservation efforts should especially focus on the management, restoration and
creation of bat habitat and landscape elements connecting habitat patches in
agricultural areas. This is especially important because of the recent attention to
multifunctional areas with nature outside the reserve network (e.g. Ministry of
Agriculture, Nature Management & Fisheries 1990, 1995).
Currently, there is a need for tools to evaluate and improve the quality of
natural habitats in agricultural landscapes. Guidelines for bat conservation should
form a part of the tool kit of landscape planners. In this study, several multivariate
models were derived which can be used to predict the numerical response of bat
occurrence to changes in the density and configuration of edge habitats (Chapter 2),
and in the structural features of treelines (Chapter 6).These models are, for example,
useful in scenario comparisons. The following recommendations, extracted from
this thesis, are directly applicable to the management, restoration, and creation of
treelines and hedgerows for the benefit of bats:
(1) On a landscape scale, increasing the density of woody elements will positively
influence bat abundance (Chapter 2). Continuity of edge habitats is essential for
an optimal exploitation of feeding habitats. Maximum allowable gaps in
hedgerows and treelines are species-specific. A distance of twice the maximum
sonar range (Table 7.1) provides a safe measure which can be used to minimise
effects of habitat fragmentation.
(2) For commuting bats, edge habitats are important not only as connective corridors
(Chapter 6), but also provide shelter from predators (Chapter 3). So double
treelines are more effective than single ones.
(3)When planning ahedgerow or treeline, it isbest orientated perpendicularly to the
prevailing wind direction in order to provide maximum wind protection
(Chapter 3). When planning several of these elements, it is important that
different orientations are represented.
(4) The suitability of a treeline or hedgerow as a feeding site depends on its
structural features (Chapters 2 and 6). Increased foliage density, width, and
height improves the suitability as a feeding site. This is especially important in
areas with a windy climate. For example, from Table 6.3, it can be derived that
an increase of mean foliage density of 1% would correspond with an average
increase in bat activity of 3.4%. To enhance wind protection, treelines should
have a dense bush layer to increase shelter below the tree crowns. For small bats,
such as pipistrelles, the minimum height of treelines and hedgerows should be 6
m (Chapters 2 and 6).
(5) Open areas adjacent to treelines should be rich in insects to facilitate the
exploitation of open areas outside the bats' acoustical range from treelines.
Data on habitat use by bats in The Netherlands have always been very scarce.
Recently, this situation changed. This thesis provides important information on the
use of edge habitats by bats and the barrier effect of the open matrix in agricultural
areas. The recently published results of the Dutch Bat Survey (Limpens et al. 1997)
100
T H E
U S E
OF
E D G E
H A B I T A T S
BY
C O M M U T I N G
A N D
F O R A G I N G
B A T S
/
C H A P T E R
provide detailed distribution maps of species on a national scale. Both information
sources should be combined to develop models which can be powerful tools in
landscape management and planning. Effects of guidelines presented above will not
be restricted to bats alone, but will generally affect biodiversity in agricultural
landscapes, and may positively affect species typical ofhedgerows and treelines (e.g.
ortolan bunting Emberiza hortulana), forest species using hedgerows and treelines
as connective corridors between forest patches (e.g. European nuthatch Sitta
europea L., red squirrel Sciurus vulgaris L., carabid beetles) and species using edge
habitats in small-scaled, mosaic habitat landscapes (e.g. amphibians, European
badger Mêles mêles L.).
101
T H E
102
U S E
OF
E D G E
H A I
C O M M U T I N G
A N D
F O R A G I N G
THE
USE
OF
EDGE
H A B I T A T S
BY
C O M M U T I N G
AND
F O R A G I N G
BATS
/
S A M E N V A T T I N G
EN
DISCUSSIE
Samenvatting en discussie
Vleermuizen hebben als enige zoogdieren het vermogen ontwikkeld om zich vliegend
voort te bewegen. Daarnaast m a k e n zij gebruik van een hoog ontwikkeld akoestisch
waarnemingssysteem, echolocatie. Door deze combinatie van eigenschappen zijn ze
in staat zich in het nachtelijk luchtruim te begeven en er h u n prooien te bejagen.
Sinds het einde van de jaren zeventig m a k e n h a n d z a m e , draagbare vleermuis-detectors het mogelijk de nachtelijke vliegbewegingen van vleermuizen door het landschap te bestuderen. Zonder deze apparaatjes, die de ultrasone echolocatiesignalen
van vleermuizen o m v o r m e n tot hoorbare geluiden, had dit proefschrift niet tot stand
k u n n e n komen.
Waarom dit onderzoek?
Dit proefschrift gaat over het gebruik van lijnvormige, opgaande elementen in het
l a n d s c h a p door vleermuizen. In het moderne, versnipperde c u l t u u r l a n d s c h a p zijn
verblijfplaatsen en foerageergebieden van vleermuizen vaak kilometers van elkaar
verwijderd. Veel soorten overbruggen deze afstanden via vaste vliegroutes langs lijnvormige landschapselementen, zoals boslanen, bosranden, bomenlanen, bomenrijen,
houtwallen, rivieroevers en kanalen. Dergelijke routes worden soms jarenlang achtereen gebruikt en vormen belangrijke verbindingen voor vleermuizen. Genoemde
l a n d s c h a p s e l e m e n t e n zijn voor een aantal soorten tevens foerageergebieden.
Lijnvormige elementen zijn van oudsher typerend voor het Nederlandse cult u u r l a n d s c h a p . Ontwikkelingen in de l a n d b o u w hebben, vooral in de laatste decennia, drastische veranderingen tot gevolg gehad, waardoor n a t u u r w a a r d e n in het agrarisch gebied sterk achteruitgingen en veel diersoorten in h u n verspreiding w e r d e n
teruggedrongen tot opgaande landschapselementen. Door het verdwijnen van de
behoefte aan 'boerengeriefhout', en als gevolg van schaalvergroting en ruilverkavelingen v e r d w e e n tussen 1900 en 1990 bijna 6 0 % van de houtwallen, heggen en
b o m e n l a n e n in ons land. Bovendien zijn lijnvormige begroeiingen steeds meer
onderbroken geraakt. Deze ontwikkelingen k u n n e n een negatieve invloed hebben op
de aantrekkelijkheid van gebieden voor vleermuizen, enerzijds op grond van de verm i n d e r d e hoeveelheid foerageerhabitat, anderzijds doordat verbindingen tussen foerageergebieden w o r d e n aangetast of wegvallen, waardoor de bereikbaarheid van
delen van het l a n d s c h a p , en daarmee de hoeveelheid exploiteerbaar foerageerhabitat, afnemen.
Het hier gepresenteerde onderzoek is uitgevoerd om gegevens te verzamelen
over de manier waarop vleermuizen houtwallen, b o m e n l a n e n en bosranden gebruiken. Zo k u n n e n adviezen w o r d e n gegeven bij de aanleg en het beheer van landschapselementen ten behoeve van vleermuizen. In hoofdstuk 2 wordt de vraag
gesteld in hoeverre het voorkomen van enkele soorten vleermuizen gerelateerd is
aan lijnvormige landschapselementen. Tevens w o r d e n gezocht naar een functionele
verklaring voor de gevonden relaties. In de daarop volgende hoofdstukken (3-5) worden verschillende potentiële functies van lijnvormige l a n d s c h a p s e l e m e n t e n voor
vleermuizen in detail bestudeerd. In hoofdstuk 6 wordt het voorkomen van foerage-
103
THE
USE
OF
EDGE
H A B I T A T S
BY
C O M M U T I N G
A N D
F O R A G I N G
BATS
/
S A M E N V A T T I N G
EN
DISCUSSIE
rende dwergvleermuizen in verband gebracht met structuurkenmerken van houtsingels, en wordt de keuze van vliegroutes gerelateerd aan de verspreiding van potentieel goede foerageerplekken over het landschap. Tenslotte worden aanbevelingen
gedaan, waarmee de onderzoekresultaten toepasbaar kunnen worden gemaakt voor
het natuurbeheer (hoofdstuk 7).
Verschillen tussen soorten
Elke vleermuizensoort wordt gekenmerkt door een bepaalde combinatie van eigenschappen die maakt dat hij optimaal is aangepast aan een bepaalde foerageerstrategie in een bepaald habitat (Hoofdstuk 1). Morfologische kenmerken, met name de
vorm van de vleugels en de lichaamsgrootte, geven aan wat zijn optimale (meest
energiezuinige) vliegsnelheid is en hoe wendbaar hij is. Kenmerken van de echolocatiesignalen (pulslengte, pulsduur, frequentie) en de duur van de intervallen tussen
pulsen, duiden aan of een soort voorkomt in een open omgeving, of juist in de beslotenheid van bijvoorbeeld vegetatie. Deze aanpassingen maken het mogelijk voorspellingen te doen over het gebruik van opgaande landschapselementen, zoals houtwallen, bomenlanen en bosranden, door vleermuizen.
Bij in Nederland voorkomende vleermuizen kunnen we twee uitersten onderscheiden. Enerzijds zijn er soorten die hun prooien bejagen in een besloten omgeving, dicht bij vegetatie, gebouwen of de grond. Open terrein wordt door hen zoveel
mogelijk gemeden. Vliegafstanden zijn doorgaans niet groot, routes lopen vaak via
open plekken in het bos, zoals boslanen en -paden. Voorbeelden zijn de gewone
grootoorvleermuis (Plecotus auritus) en een aantal soorten van het geslacht Myotis.
Aan de andere kant van het spectrum bevinden zich de soorten die een open jachtomgeving prefereren. Deze vleermuizen kunnen in de loop van een nacht relatief
grote afstanden afleggen. De binding met vegetatie en opgaande landschapselementen lijkt niet of nauwelijks aanwezig. Voorbeelden zijn de rosse vleermuis (Nyctalus
noctula) en de tweekleurige vleermuis [Vespertilio murinus). Daarnaast is er een
middengroep, waartoe de gewone dwergvleermuis (Pipistrellus pipistrellus), de
ruige dwergvleermuis (P nathusii), de laatvlieger (Eptesicus serotinus), de watervleermuis (Myotis daubentonii) en de meervleermuis (M. dasycneme) kunnen worden gerekend. Inhet algemeen vertonen deze soorten aanpassingen aan een halfopen
omgeving, waarbij enige afstand wordt gehouden tot grote objecten. Vooral deze
soorten maken gebruik van opgaande, lijnvormige landschapselementen in cultuurlandschappen.
Verschillen tussen soorten in het gebruik van landschapselementen hangen
dus samen met verschillen in morfologie, voedselecologie en echolocatiegedrag. In
het kleinschalige houtwallenlandschap van Twente bleek de gewone dwergvleermuis vrijwel uitsluitend op korte afstand (<25 m) van houtwallen en bomenrijen te
foerageren, terwijl de laatvlieger geregeld op tientallen meters of meer in het open
terrein vloog (hoofdstuk 2). Toch vertoonde ook de laatvlieger een binding met
opgaande elementen, gezien de dichtheidsafname van deze soort in open terrein bij
een toenemende afstand tot het landschapselement.
Er zijn verschillende functies van lijnvormige landschapselementen voor
vleermuizen denkbaar, waarmee de gevonden relaties kunnen worden verklaard:
104
THE
USE
OF
EDGE
H A B I T A T S
BY
C O M M U T I N G
A N D
F O R A G I N G
BATS
/
S A M E N V A T T I N G
EN
DISCUSSIE
1. foerageerhabitat: verschillen in voedselkeuze
De insectenrijkdom rond opgaande landschapselementen is in het algemeen groter dan in het aangrenzende open terrein. Enerzijds vormen deze
landschapselementen voor veel insecten een geschikt voortplantingshabitat, anderzijds worden vooral kleine insecten op passieve wijze door de
wind meegevoerd en aan de beschutte lijzijde van de elementen geaccumuleerd. De laatvlieger jaagt in het algemeen op grotere insecten dan de
dwergvleermuis. Grote insecten zijn krachtige vliegers, die bij sterkere
wind -en dus verder van opgaande elementen -nog actief kunnen vliegen.
De kleine insecten, het voedsel van de dwergvleermuis, bevinden zich
vooral in de meest tegen wind beschutte delen, d.w.z. dicht bij opgaande
elementen.
2. beschutting tegen wind: verschillen in windgevoeligheid
Door in de windluwte van opgaande landschapselementen te vliegen, kunnen vleermuizen hun energieverbruik beperken. De relatief kleine dwergvleermuis is gevoeliger voor wind dan de veel grotere laatvlieger. De eerste moet dan ook uit energetische overwegingen meer in de beschutting
van, dus dichter bij, opgaande elementen blijven.
3. beschutting tegen predatoren: verschillen in predatiekans
Opgaande begroeiingen kunnen dekking tegen predatoren verschaffen.
Brits onderzoek geeft aan dat predatoren, zoals uilen, verantwoordelijk
zijn voor ca. 10% van de jaarlijkse sterfte onder vleermuizen. De laatvlieger is een snellere vlieger dan de dwergvleermuis, en is daardoor beter in
staat te ontsnappen aan een aanval van, bijvoorbeeld, een uil. De laatvlieger kan zich daarom beter permitteren in het onbeschutte open terrein te
vliegen.
4. navigatiebakens: verschillen in sonar-reikwijdte
Opgaande landschapselementen zouden een functie kunnen vervullen als
geleidende structuren voor vleermuizen. Indien vleermuizen hun sonar
gebruiken om via deze structuren hun weg door het landschap te zoeken
(te navigeren), dan dienen zij hiermee contact te houden ('sonar' is de
afkorting van 'sound navigation and ranging' en wordt vaak in de plaats
van het begrip 'echolocatie' gebruikt). De dwergvleermuis zendt minder
luide echolocatiesignalen met een hogere frequentie uit dan de laatvlieger.
Hoge frequenties doven sterker uit, en reiken daardoor minder ver, dan
lage frequenties. Daardoor heeft de sonar van de dwergvleermuis een kleinere reikwijdte dan die van de laatvlieger. De dwergvleermuis moet dus
dichter bij opgaande landschapselementen blijven om hiermee contact te
kunnen houden.
Op landschapsschaal zijn er ook verschillen tussen beide soorten. De dichtheid (per vierkante kilometer) van dwergvleermuizen nam evenredig toe met de
dichtheid aan houtwallen en bomenlanen. De dichtheid van laatvliegers daarentegen
nam meer dan evenredig toe met de dichtheid van lijnvormige landschapselementen, hetgeen betekent dat ook per lengte-eenheid lijnvormig element meer laatvliegers werden waargenomen. De grote waarde van landschappen met een hoge dichtheid aan houtwallen voor de laatvlieger kan verklaard worden uit het feit dat in dergelijke landschappen de windbeschuttingszones van de opgaande elementen elkaar
105
THE
USE
OF
EDGE
H A B I T A T S
BY
C O M M U T I N G
AND
F O R A G I N G
BATS
/
S A M E N V A T T I N G
EN
DISCUSSIE
in het tussenliggende open terrein overlappen. In deze overlappingsgebieden ontstaan luwtes waarin de wind voldoende getemperd worden om actief vliegen van
grote insecten mogelijk te maken, terwijl kleinere insecten hier nog steeds niet in
staat zijn te vliegen. Hiervan profiteert de laatvlieger.
Voedsel, wind en predatoren
In het voorafgaande is duidelijk geworden dat er plausibele verklaringen zijn voor
het gebruik van opgaande, al dan niet lijnvormige, landschapselementen door vleermuizen, en voor de verschillen tussen soorten (hoofdstuk 2). Voor een nadere analyse van de functies van deze elementen voor vleermuizen en hun relatieve belang,
is een gedetailleerd onderzoek uitgevoerd naar dwergvleermuizen en laatvliegers
rond houtsingels in relatie tot voedsel, wind en predatoren (hoofdstuk 3).
VLIEGROUTES
Vleermuizen die de afstand tussen verblijfplaats en foerageergebieden overbruggen,
vliegen doorgaans sneller en rechtlijniger dan foeragerende vleermuizen. Sommige
soorten, zoals de watervleermuis, jagen onderweg niet. Dwergvleermuizen foerageren onderweg slechts in geringe mate.
In de avondschemering, op een vliegroute tussen verblijfplaats en foerageergebieden, bleek 81% (gemiddeld over 39 avonden) van de dwergvleermuizen boven
de weg tussen de bomenrijen te vliegen. De loefzijde werd slechts incidenteel
gebruikt. Dit gedrag kan niet verklaard worden uit de verdeling van voedsel en wind:
insectendichtheden waren gemiddeld genomen lager en windsnelheden hoger tussen de bomenrijen dan aan de lijzijde. Anti-predatiegedrag lijkt in deze situatie een
plausibele verklaring voor de vliegroute van de vleermuizen. Uit onderzoek van
anderen is gebleken, dat predatierisico's het grootst zijn rond de avond- en ochtendschemering, wanneer het relatief licht is. Het risico is ook groot nabij verblijfplaatsen en nabij regelmatig gebruikte vliegroutes.
Ook wind beïnvloedde de vliegroute: het aandeel aan de lijzijde langsvliegende dieren nam toe bij toenemende windsnelheid en wanneer de wind onder een
grote hoek (45°-90°) inviel.
FOERAGEERGEBIEDEN
Voor foeragerende vleermuizen lijkt de verdeling van voedsel een voor de hand liggende factor. De invloed van voedsel en wind werd onderzocht in drie situaties: aanwezigheid van wind én een relatief insectenarm open terrein (situatie 1), windstilte
én een relatief insectenarm open terrein (situatie 2) en windstilte én een relatief
insectenrijk open terrein (situatie 3). Het onderzoek richtte zich op de dwergvleermuis (situaties 1, 2 en 3) en de laatvlieger (situaties 2 en 3) en leverde de volgende
resultaten op:
Het voorkomen van foeragerende vleermuizen rond houtsingels bleek samen te
hangen met zowel voedsel als wind:
Tussen de bomenrijen werd minder gefoerageerd dan aan de insectenrijkere en meer windluwe lijzijde.
In het geval van een insectenrijk open terrein (situatie 3) was de verdeling
106
THE
USE
OF
EDGE
H A B I T A T S
BY
C O M M U T I N G
A N D
F O R A G I N G
BATS
/
S A M E N V A T T I N G
EN
DISCUSSIE
van dwergvleermuizen en laatvliegers over verschillende afstanden (3-48
m) tot de bomenlanen significant gecorreleerd met die van insecten.
De vleermuizen concentreerden zich zowel bij toenemende windsnelheid
als bij toenemende invalshoek dichter bij de bomenlaan (situatie 1; invalshoek 0° = evenwijdig aan bomenlaan, 90° = loodrecht op bomenlaan). Bij
een grote invalshoek (> 45°) was de totale vleermuisactiviteit aan de lijzijde groter dan bij een kleine invalshoek (<45°).
Echter, de samenhang tussen vleermuizen, insecten en wind ontbrak in
insectenarme situaties:
In situatie 1vlogen dwergvleermuizen aan de lijzijde significant dichter bij
de bomenlaan dan de aanwezige insecten (maxima op respectievelijk op 3
en 6m van de bomenlaan) en wind (maximale windluwte op 24 m van de
bomenlaan).
In situaties 1en 2 was er geen relatie tussen de verdeling van dwergvleermuizen over verschillende afstanden tot de bomenlaan en de afstandsverdelingen van insecten (dichtheden en biomassa) en windluwte. Hier
bepaalde een andere factor, de 'afstand tot de bomenlaan', waar de dwergvleermuizen vlogen. Bij laatvliegers was dit afstandseffect afwezig.
Naast voedsel en wind, duiden de resultaten dus op het bestaan van een of
meer andere factoren, die debinding van de vleermuizen aan bomenlanen verklaren.
Er zijn twee mogelijkheden:
Predatie. Omdat de jacht op vleermuizen voor zichtjagers als uilen in het
nachtelijk duister, naar verwachting, veel minder kans op succes biedt dan tijdens
de schemering, is het risico om gepredeerd te worden voor foeragerende vleermuizen rond bomenlanen vermoedelijk veel kleiner dan voor vleermuizen die tijdens de
avond- en ochtendschemering tussen verblijfplaats en foerageergebieden pendelen.
Bovendien zijn foerageerplekken van vleermuizen voor een predator minder voorspelbaar (in ruimte en tijd) dan vliegroutes.
Echolocatiebinding met landschapselementen. Dit zou een verklaring kunnen
zijn voor het feit dat vleermuizen in de insectenarme situatie 1 dicht bij de bomenlaan vlogen, onafhankelijk van voedsel en windbeschutting.
De resultaten gaven aanleiding om het verdere onderzoek te richten op het
bestaan van een echolocatiebinding van vleermuizen met landschapselementen.
Echolocatie in relatie tot het landschap
De variatie in echolocatiesignalen onder vleermuizensoorten is groot. Deze variatie
lijkt vooral samen te hangen met de openheid van het habitat waarin de soort voorkomt. Individuen kunnen daarnaast op flexibele wijze hun echolokatiesignalen aanpassen aan veranderende situaties, bijvoorbeeld wanneer zij uit de beslotenheid van
een boslaan een meer open omgeving invliegen.
Indien vleermuizen met hun sonar navigeren en daarbij landschapselementen
gebruiken als geleidende structuren, dan moeten zij hiermee contact onderhouden.
Dit zou tot uiting moeten komen in een geleidelijke aanpassing van echolocatiesignalen aan de afstand tot landschapselementen. Deze hypothese is getoetst bij de
meervleermuis (hoofdstuk 5). Omdat over de meervleermuis weinig literatuur
107
THE
USE
OF
EDGE
H A B I T A T S
BY
C O M M U T I N G
AND
F O R A G I N G
BATS
/
S A M E N V A T T I N G
EN
DISCUSSIE
bestaat, is vooraf een studie gemaakt van het vlieg-, foerageer- en echolocatiegedrag
van deze soort (hoofdstuk 4).
De meervleermuizen in het studiegebied in Friesland gebruiken kanalen om
de afstand tussen verblijfplaats en foerageergebieden te overbruggen. Geluidsopnamen maakten duidelijk dat de vleermuizen hun echolocatiegeluiden aanpassen
aan de afstand tot de kanaaloever. Bij toenemende afstand werden langere pulsen
uitgezonden. Lange pulsen zijn beter geschikt voor detectie van objecten over grote
afstand dan korte pulsen, omdat de kans op waarneembare echo's toeneemt. Het uitzenden van langere pulsen is dus een manier om het sonarbereik te vergroten. Het
tijdsinterval tussen pulsen kan worden beschouwd als een maat voor het maximale
sonarbereik (zie ook hoofdstuk 1).De duur van dit interval dient lang genoeg te zijn
om de echo van het uitgezonden signaal terug te kunnen ontvangen. In het onderzoek bleek dat de vleermuizen bij toenemende afstand tot de kanaaloever de intervallen verlengden op het moment dat, bij een toenemende afstand tot de kanaaloever, deze niet meer toereikend waren om degeluidssignalen de afstand tot de kanaaloever (heen en terug) te laten overbruggen.
Uit de resultaten mag worden afgeleid dat meervleermuizen contact houden
met kanaaloevers. Verdere ondersteuning voor deze hypothese kwam uit het onderzoek naar de afstandverdeling van vleermuizen in Walcheren. Dwergvleermuizen
bleken zich hier vrijwel uitsluitend op te houden in een zone waar contact met de
bomenlaan via echolokatie mogelijk was, d.w.z. op afstanden tot de bomenlaan die
kleiner waren dan hun maximale sonarbereik van ca. 15 m.
Afweging van kosten en baten
Uit dit onderzoek blijkt dat opgaande (lijnvormige) landschapselementen om verschillende redenen van belang zijn voor vleermuizen. Het gebruik van landschapselementen varieert, en blijkt te worden bepaald door de situatie met betrekking tot
voedselaanbod, wind en predatierisico.
Al kan op grond van de resultaten, niet direct worden geconcludeerd dat
vleermuizen landschapselementen gebruiken, of zelfs nodig hebben, als akoestische
navigatiebakens, er zijn toch duidelijke aanwijzingen dat vleermuizen contact houden met opgaande landschapselementen. Hiervoor zijn goede redenen te bedenken.
Het onderhouden van sonarcontact met bekende structuren, kan de efficiëntie waarmee een vleermuis een gebied exploiteert, verhogen. Mogelijk speelt hierbij een in
zijn ruimtelijk geheugen opgeslagen 'cognitieve kaart' van vliegroutes en foerageergebieden in het gebied een rol. Referentiepunten, bijvoorbeeld in de vorm van
opgaande landschapselementen, kunnen een belangrijke rol spelen bij het totstandkomen van dergelijke kaarten.
Vleermuizen zijn in staat het sonarcontact met landschapselementen los te
laten. Dit hoeft echter niet tebetekenen dat opgaande elementen geen betekenis zouden hebben als akoestische bakens. Wanneer bijvoorbeeld de voedseldichtheid in
open terrein hoog is en/of het windstil is, zou het lonend kunnen zijn om de foerageeractiviteiten meer in de richting van het open terrein uit te breiden (hoofdstuk 3).
Dit weegt wellicht op tegen mogelijke extra navigatiekosten en een hoger predatierisico.
108
THE
USE
OF
EDGE
H A B I T A T S
BY
C O M M U T I N G
A N D
F O R A G I N G
BATS
/
S A M E N V A T T I N G
EN
DISCUSSIE
Evenzo hoeft het feit dat vleermuizen zo nu en dan open terreinen van tientallen of zelfs enkele honderden meters oversteken, niet te betekenen dat open terreinen of onderbrekingen in landschapselementen geen barrières vormen. De voedselsituatie aan 'de overzijde' kan voldoende compensatie vormen voor eventuele kosten en risico's die de oversteek met zich meebrengt. Daarnaast speelt mogelijk het
gezichtsvermogen een rol bij de oriëntatie en navigatie, naar verwachting vooral in
de schemering.
Geconcludeerd kan worden, dat opgaande elementen in het cultuurlandschap, zoals houtwallen, bomenlanen en bosranden, een belangrijke rol vervullen
voor een aantal soorten vleermuizen. Dit gegeven is van belang voor het beheer van
landschappen en landschapselementen ten behoeve van vleermuizen. Uit het voorgaande is echter nog niet duidelijk geworden wanneer een opgaand landschapselement aantrekkelijk is voor vleermuizen. Dit is een van de vragen die worden gesteld
in hoofdstuk 6.
De structuur van houtsingels
De geschiktheid van een gebied voor vleermuizen hangt voor een belangrijk deel
samen met de aanwezigheid van geschikte foerageergebieden, alsmede met de
bereikbaarheid daarvan via corridors. In hoofdstuk 6 wordt allereerst de vraag gesteld welke eigenschappen van een opgaand landschapselement zijn geschiktheid
als foerageerplek bepalen. In Walcheren, waar houtsingels vrijwel de enige vorm van
opgaande begroeiing vormen, blijkt de geschiktheid van houtsingels als foerageerplek voor dwergvleermuizen gecorreleerd te zijn met de hoogte, breedte en vegetatiedichteid (permeabiliteit) van de singels. Deze structuurkenmerken bepalen de
mate van windbeschutting, een belangrijke eigenschap in een winderig kustgebied
als Walcheren.
Deverspreiding van potentieel geschikte foerageerplekken in het studiegebied
bleek bepalend voor de keuze van vliegroutes tussen een verblijfplaats van dwergvleermuizen in een klein dorp en het omliggende landschap. Het meest gebruikt
werden routes die leidden naar die delen van het landschap waar (potentieel) hoogkwalitatieve foerageerplekken op relatief korte afstand van de verblijfplaats gelegen
Toepassing
Door hun mobiliteit zijn vleermuizen in staat grote afstanden af te leggen tussen hun
ruimtelijk gescheiden dagverblijven en foerageergebieden. Connectiviteit tussen
deze deelhabitats is dus een belangrijke voorwaarde voor de overlevingskansen van
vleermuispopulaties. Het zijn juist de landschappelijke veranderingen in de afgelopen decennia, met name in het agrarisch gebied, die een belangrijke rol hebben
gespeeld bij de achteruitgang van veel soorten vleermuizen.
Voor een effectieve bescherming van vleermuizen en hun habitats zijn richtlijnen noodzakelijk. Dit onderzoek levert daar een belangrijke bijdrage aan in de
vorm van een aantal concrete adviezen voor de inrichting en het beheer van land109
THE
USE
OF
EDGE
H A B I T A T S
BY
C O M M U T I N G
AND
F O R A G I N G
BATS
/
S A M E N V A T T I N G
EN
DISCUSSIE
schappen en landschapselementen in agrarische gebieden ten behoeve van vleermuizen. Juist deze agrarische gebieden, die buiten de Ecologische Hoofdstructuur
vallen, staan momenteel in de belangstelling bij beleidsmakers. De in hoofdstuk 7
gegeven aanbevelingen hebben betrekking op de dichtheid, configuratie en structuurkenmerken van lijnvormige, opgaande begroeiingen, de (soortspecifieke) maximaal toelaatbare grootte van open 'gaten' in lijnvormige elementen, en de insectenrijkdom van open terreinen. De regressiemodellen met betrekking tot vleermuizen in
relatie tot dichtheid, mate van fragmentatie en structuurkenmerken van lijnvormige
landschapselementen (hoofdstuk 2 en 6) kunnen een toepasing vinden in studies
waarin inrichtingsscenario's met elkaar worden vergeleken. De toepassingswaarde
van de gegevens zou echter belangrijk kunnen worden vergroot door de ontwikkeling van een modelinstrumentarium, waarin alle kennis wordt samengebracht. In
combinatie met het omvangrijke databestand van het Vleermuis Atlas Project
(Limpens et al. 1997), dat gegevens bevat over de verspreiding en habitatkeuze van
soorten op nationale schaal, dient een 'decision support system' te worden ontwikkeld voor beheerders en inrichters van landschappen en landschapselementen.
110
T H E
U S E
OF
E D G E
H A B I T A T S
BY
C O M M U T I N G
A N D
F O R A G I N G
B A T S
/
R E F E R E N C E S
References
Acharya, L. & M.B. Fenton 1992. Echolocation behaviour of vcspertilionid bats (Lasiurus cinereus and Lasiurus borealis) attacking airborne targets including arctiid moths. Canadian
Journal of Zoology 70: 1292-1298.
Ahlén, I. 1979. Dammfladdermus Myotis dasycneme (Boie, 1825) funnen i Uppland. Fauna och
Flora 74: 259-262.
Ahlén, I. 1981.Identification of Scandinavian bats by their sounds. Report 6.The Swedish
University of Agricultural Sciences, Department of Wildlife Ecology, Uppsala.
Ahlén, I. 1990. Identification of bats in flight. Swedish Society for Conservation of Nature and
the Swedish Youth Association for Environmental Studies and Conservation,
Stockholm.
Aldridge, H.D.J.N. 1986a. Manoeuvrability and ecology in British bats. Myotis 23/24: 57-60.
Aldridge, H.D.J.N. 1986b. Manoeuvrability and ecological segregation in the little brown
(Myotis lucifugus) and Yuma (M. yumanensis) bats. Canadian Journal of Zoology 64:
1878-1882.
Aldridge, H.D.J.N. 1988. Flight energetics and kinematics in the little brown bat, Myotis lucifugus (Chiroptera: Vespertilionidae), with reference to the influence of ground effect.
Journal of Zoology (London) 216: 507-517.
Aldridge, H.D.J.N. & I.L. Rautenbach 1987. Morphology, echolocation and resource partitioning
in insectivorous bats. Journal of Animal Ecology 56: 763-778.
Altringham, J.D. 1996. Bats. Biology and Behaviour. Oxford University Press.
Baag0e, H.J. 1987. The Scandinavian bat fauna: adaptive wing morphology and free flight in
the field. In: M.B. Fenton, P.A. Racey & J.M.V. Rayner (eds.), Recent advances in the
study of bats. Cambridge University Press; 57-74.
Baker, R.R. 1978.The evolutionary ecology of animal migration. Hodder & Stoughton, London.
Baidock, D. 1990. Agriculture and habitat loss in Europe. Discussion paper 3.World Wide
Fund for Nature International, London.
Barbour, R.W., W.H. Davis & M.D. Hassell 1966. The need of vision in homing by Myotis sodalis. Journal of Mammalogy 47: 356-357.
Barclay, R.M.R. 1986. The echolocation calls of hoary (Lasiurus cinereus) and silver-haired
(Lasionycteris noctivagans) bats as adaptations for long- versus short-range foraging
strategies and the consequences for prey detection. Canadian Journal of Zoology 64:
2700-2705.
Barclay, R.M.R. & R.M. Brigham 1991.Prey detection, dietary niche breadth, and body size in
bats: why are insectivorous bats so small? American Naturalist 137:693-703.
Barclay, R.M.R. & R.M. Brigham 1994. Constraints on optimal foraging: a field test of prey discrimination by echolocating insectivorous bats. Animal Behavior 48:1013-1021.
Barr, C, R. Bunce, R. Clark, R. Fuller, M. Furse, M. Gillespie, G. Groom, C. Hallam, M.
Horning, D.Howard & M. Ness 1993.Countryside Survey 1990: Main Report.
Department of the Environment, London.
Bateman, G.C. & T.A. Vaughan 1974. Nightly activities of mormoopid bats. Journal of
Mammalogy 55, 1:45-65.
Beck, A. 1994-1995. Fecal analysis of European bat species. Myotis 32/33: 109-119.
Bell, G.P. 1980. Habitat use and response to patches of prey by desert insectivorous bats.
Canadian Journal of Zoology 58:1876-1883.
Bell, G.P. 1985.The sensory basis of prey location by the California leaf-nosed bat Macrotus
californiens (Chiroptera: Phyllostomatidae). Animal Behavior 34: 409-414.
Ill
T H E
U S E
OF
E D G E
H A B I T A T S
BY
C O M M U T I N G
A N D
F O R A G I N G
B A T S
/
R E F E R E N C E S
Bell, W.J. 1991. Searching behaviour: the behavioural ecology of finding resources. Chapman &
Hall, London.
Belwood, J.J. &J.H. Fullard 1984. Echolocation and foraging behaviour in the Hawaiian hoary
bat, Lasiurus cinereus semotus. Canadian Journal of Zoology 62: 2113-2120.
Blake, D., A.M. Hutson, P.A. Racey, J. Rydell &J.R. Speakman 1994. Use of lamplit roads by
foraging bats in southern England. Journal of Zoology (London) 34: 453-462.
Brigham, R.M., J.E. Cebek &M.B.C. Hickey 1989. Intraspecific variation in the echolocation
calls of two species of insectivorous bats. Journal of Mammalogy 70, 2: 426-428.
Britton, A.R.C., G. Jones, J.M.V. Rayner, A.M. Boonman &B. Verboom 1997. Flight performance, echolocation and foraging behaviour in pond bats, Myotis dasycneme (Chiroptera:
Vespertilionidae). Journal of Zoology (London) 241: 503-522.
Broekhuizen, S., B. Hoekstra, V. van Laar, C. Smeenk &J.B.M. Thissen (red.) 1992. Atlas van de
Nederlandse zoogdieren. KNNV, Utrecht.
Brown, P.E., T.W. Brown &A.D. Grinnell 1983. Echolocation, development and vocal communication in the lesser bulldog bat, Noctilio albiventris. Behavioral Ecology and
Sociobiology 13: 287-298.
Cahlander, D.A. 1967. Theories of sonar systems and their application to biological organisms.
Control Data Corporation, Minneapolis.
Cahlander, D.A., J.J.G. McCue &F.A. Webster 1964. The determination of distance by echolocating bats. Nature 201: 544-546.
Charnov, E.L. 1976. Optimal foraging: The marginal value theorem. Theoretical Population
Biology 9: 129-136.
Chase, J. &R.A. Suthers 1969. Visual obstacle avoidance by echolocating bats. Animal Behavior
17: 201-207.
Crampton, L.H. &R.M.R. Barclay 1996. Habitat selection by bats in fragmented and unfragmented A s p e n m i x e d w o o d stands of different ages. In: R.M.R. Barclay &R.M. Brigham
(eds.), Bats and Forests: proceedings of the first bats and forests conference, Victoria.
British Columbia Ministry of Forests, Victoria; 238-259.
Daan, S. 1980. Long-term changes in bat populations in The Netherlands: a summary. Lutra 22:
95-104.
Davis, R. 1966. Homing performance and homing ability in bats. Ecological Monographs 36:
201-237.
Davis, R.B. &E.L. Cockrum 1962. Repeated homing exhibited by a female pallid bat. Science
137: 341-342.
Dear, C R , J.A. Simmons &J. Fritz 1993. A possible neuronal basis for representation of acoustic scenes in auditory cortex of the big brown bat. Nature 364: 620-623.
De Jong, J. 1994. Distribution patterns and habitat use by bats in relation to landscape heterogeneity, and consequences for conservation. PhD thesis, Swedish University of
Agricultural Sciences, Uppsala.
De Jong, J. &I. Ahlén 1991. Factors affecting the distribution pattern of bats in Uppland, central Sweden. Holarctic Ecology 14: 92-96.
Dijkstra, H., J.F. Coeterier, M.A. van der Haar, A.J.M. Koomen &W.L.C. Salden 1997.
Veranderend cultuurlandschap. Signalering van landschapsveranderingen van 1900 tot
1990 voor de Natuurverkenning 1997. Report 544. DLO Winand Staring Centre,
Wageningen.
Doekemeijer, D. 1994. Do Noctules (Nyctalus noctula, Schreber 1774) a n d Leisler's bats
(Nyctalus leisleri, K u h l 1817) migrate? Report 3146. Department of Terrestrial Ecology
and Nature Conservation, Wageningen Agricultural University.
Efron, B. &R.J. Tibshirani 1993. An introduction in the bootstrap. Chapman &Hall, London.
Ekman, M. &J. De Jong 1996. Local patterns of distribution and resource utilization of four bat
112
T H E
U S E
OF
E D G E
H A B I T A T S
BY
C O M M U T I N G
A N D
F O R A G I N G
B A T S
/
R E F E R E N C E S
species (Myotis brandtii, Eptesicus nilssoni, Plecotus auritus and Pipistrellus pipistrellus) in patchy and continuous environments. Journal of Zoology (London) 238: 571-580.
Engel, B. 1997. Extending generalized linear models with random effects and components of
dispersion. PhD thesis, Wageningen Agricultural University.
Engel, B.& A. Keen 1994. A simple approach for the analysis of generalized linear mixed
models. Statistica Neerlandica 48: 1-22.
Faure, P.A. & R.M.R.Barclay 1994. Substrate gleaning versus aerial-hawking: plasticity in the
foraging and echolocation behaviour of the long-eared bat, Myotis evotis. Journal of
Comparative Physiology A 174: 651-660.
Fenton, M.B. 1986. Design ofbat echolocation calls: implications for foraging ecology and communication. Mammalia 50, 2:192-203.
Fenton, M.B. 1990. The foraging ecology of animal-eating bats. Canadian Journal of Zoology 68:
411-422.
Fenton, M.B.& G.P. Bell 1981.Recognition of species of insectivorous bats by their echolocation calls. Journal of Mammalogy 62:233-243.
Fenton, M.B. & M.B.Griffin 1997. High-altitude pursuit of insects by echolocating bats. Journal
of Mammalogy 78, 1:247-250.
Fenton, M.B.,I.L.Rautenbach, CM. Swanepoel, J. Grosell & J.van Jaarsveld 1994. Raptors and
bats: threats and opportunities. Animal Behavior 48:9-18.
Findley, J.S. 1972. Phenetic relationships among bats of the genus Myotis. Systematic Zoology
21: 31-52.
Findley, J.S. 1993.Bats:A Community Perspective. Cambridge University Press.
Forman, R.T.T. & J. Baudry 1984. Hedgerows and hedgerow networks in landscape ecology.
Environmental Management 8: 495-510.
Furlonger, C.L., H.J. Dewar & M.B. Fenton 1987. Habitat use by foraging insectivorous bats.
Canadian Journal of Zoology 65:284-288.
Genstat 5Committee 1993.Genstat 5Release 3 Reference Manual. Clarendon Press, Oxford.
Genstat 5Committee 1995.Genstat 5Release 3.2 Reference Manual Supplement. Numerical
Algorithms Group, Oxford.
Getz, L.L., F.R. Cole & D.L. Gates 1978. Interstate roadsides as dispersal routes for Microtus
pennsylvanicus. Journal of Mammalogy 59: 208-212.
Glas, G.H. 1978.Inleidend onderzoek naar de biologie van de laatvlieger, Eptesicus serotinus
Schreber, 1774 (Mammalia, Chiroptera) met name in de zomerverblijfplaats. PhD thesis,
University of Amsterdam.
Griffin, D.R. 1958.Listening in the Dark. The Acoustic Orientation of Bats and Men. Yale
University Press / Cornell University Press, New York.
Griffin, D.R. 1988.Cognitive aspects of echolocation. In:P.E.Nachtigall & P.W.B.Moore (eds.),
Animal Sonar: Processes and Performance. NATO ASI Series A: Life Sciences Volume
156. Plenum Press, New York; 683-690.
Griffin, D.R., FA. Webster & C.R. Michael 1960. The echolocation of flying insects by bats.
Animal Behavior 8: 141-154.
Grindal, S.D. 1996. Habitat use by bats in fragmented forests. In: R.M.R. Barclay & R.M.
Brigham (eds.), Bats and Forests: proceedings of the first bats and forests conference,
Victoria. British Columbia Ministry of Forests, Victoria; 260-272.
Haffner, M. & H.P. Stutz 1985-1986. Abundance of Pipistrellus pipistrellus and Pipistrellus
kuhlii foraging at streetlamps. Myotis 23/24: 167-172.
Hartley, D.J., K.A. Campbell & R.A. Suthers 1989. The acoustic behavior of the fish catching
bat, Noctilio leporinus, during prey capture. Journal ofthe Acoustical Society of
America 86: 8-27.
Heblich, K. 1986. Flügelschlag und Lautaussendung bei fliegenden und landenden
113
T H E
U S E
OF
E D G E
H A B I T A T S
BY
C O M M U T I N G
A N D
F O R A G I N G
B A T S
/
R E F E R E N C E S
Fledermäusen. Biona Report 5: 139-156.
Helmer, W. 1983. Boombewonende watervleermuizen Myotis daubentonii (Kuhl, 1817) in het
Rijk van Nijmegen. Lutra 26: 1-11.
Helmer, W., H.J.G.A. Limpens &W. Bongers 1987. Handleiding voor het inventariseren en
determineren van Nederlandse vleermuissoorten met b e h u l p van batdetectors. Stichting
Vleermuis-onderzoek, Soest.
Henderson, M.T., G. Merriam &J. Wegner 1985. Patchy environments a n d species survival:
c h i p m u n k s in an agricultural mosaic. Biological Conservation 31: 95-105.
Henson, O.W., Jr. 1965. The activity and function of the inner ear muscles in echolocating bats.
Journal of Physiology 180: 871-887.
Hoare, L.R. 1991. The diet of Pipistrellus pipistrellus during the prehibernal period. Journal of
Zoology (London) 225: 665-670.
Jensen, M.E. & L.A. Miller 1995. A field study of the echolocating serotine bat, Eptesicus serotinus. In: N. Eisner &R. Menzel (eds.), Göttingen Neurobiology Report 1995. Thieme,
Stuttgart; 290.
Jones, G. 1990. Prey selection by the greater horseshoe bat (Rhinolophus ferrumequinum): optimal foraging by echolocation? Journal of Animal Ecology 59: 587-602.
Jones, G. 1993a. Flight and echolocation in bats: coupling, and constraints on optimal design.
In: G. Menon (ed.), Trends in Comparative Biochemistry and Physiology. Trivandrum:
Council for Scientific Research Integration; 595-606.
Jones, G. 1993b. Flight morphology, flight performance and echolocation in British bats. In: K.
Kapteyn (ed.), Proceedings of the First European Bat Detector Workshop. Netherlands
Bat Research Foundation, Amsterdam; 59-78.
Jones, G. 1994. Scaling of wingbeat and echolocation pulse emission rates in bats: w h y are
aerial insectivorous bats so small? Functional Ecology 8: 450-457.
Jones, G. 1995. Flight performance, echolocation and foraging behaviour in noctule bats
Nyctalus noctula. Journal of Zoology (London) 237: 303-312.
Jones, G. &T. Kokurewicz 1994. Sex a n d age variation in echolocation calls and flight morphology of Daubenton's Bats Myotis daubentonii. Mammalia 58: 41-50.
Jones, G. &J.M.V. Rayner 1988. Flight performance, foraging tactics and echolocation in freeliving Daubenton's bats Myotis daubentoni (Chiroptera: Vespertilionidae). Journal of
Zoology (London) 215: 113-132.
Jones, G. &J.M.V. Rayner 1989. Optimal flight speed in pipistrelle bats, Pipistrellus pipistrellus. In: V Hanak, I. Horacek &J. Gaisler (eds.), European Bat Research 1987. Charles
University Press, Praha; 247-253.
Jones, G. &J.M.V. Rayner 1991. Flight performance, foraging tactics and echolocation in the
trawling insectivorous bat Myotis adversus (Chiroptera: Vespertilionidae). Journal of
Zoology (London) 225: 393-412.
Jones, G. &S.M. Van Parijs 1993. Bimodal echolocation in pipistrelle bats: are cryptic species
present? Proceedings of the Royal Society of London B 251: 119-125.
Kalko, E.K.V. 1994. Coupling of s o u n d emission a n d wingbeat in natural foraging European
pipistrelle bats (Microchiroptera: Vespertilionidae). Folia Zoologica 43: 363-376.
Kalko, E.K.V. 1995. Insect pursuit, prey capture and echolocation in pipistrelle bats
(Microchiroptera). Animal Behavior 50: 861-880.
Kalko, E.K.V. &M. Braun 1991. Foraging areas as an important factor in bat conservation: estim a t e d capture attempts and success rate of Myotis daubentonii (Kuhl, 1819). Myotis 29:
55-60.
Kalko, E.K.V. &H.-U. Schnitzler 1989a. The echolocation and hunting behavior of Daubenton's
bat, Myotis daubentoni. Behavioral Ecology and Sociobiology 24: 225-238.
Kalko, E.K.V. &H.-U. Schnitzler 1989b. Two-wave-front interference patterns in frequency-
114
T H E
U S E
OF
E D G E
H A B I T A T S
BY
C O M M U T I N G
A N D
F O R A G I N G
B A T S
/
R E F E R E N C E S
modulated echolocation signals of bats flying low over water. Journal of the Acoustical
Society of America 85:961-962.
Kalko, E.K.V. & H.-U. Schnitzler 1993.Plasticity in echolocation signals of European pipistrelle
bats in search flight: implications for habitat use and prey detection. Behavioral Ecology
and Sociobiology 33:415-428.
Kapteyn, K. 1993.Intraspecific variation in echolocation of vespertilionid bats,and its implications for identification. In: K. Kapteyn (ed.), Proceedings of the First European Bat
Detector Workshop. Netherlands Bat Research Foundation, Amsterdam; 45-57.
Kapteyn, K. 1995.Vleermuizen in het landschap. Over hun ecologie, gedrag en verspreiding.
Schuyt & Co, Haarlem.
Kapteyn, K. & L.Verheggen 1990. Van bosje tot bosje: verband tussen vleermuizen (Chiroptera),
begroeiing en landschapsstructuur in Zuid-Limburg. Report 1081.Nature Conservation
Department, Wageningen Agricultural University.
Karg, J. & L.Ryszkowski 1985.Influence of agricultural landscape configuration on the density
and stratification of insect flight. Archiv für Naturschutz und Landschaftsforschung 25,
4: 247-255.
Keen, A. 1996. Procedure IRREML. In: P.W.Goedhart & J.T.N.M. Thissen (eds.), Genstat 5GLWDLO Procedure Library Manual Release 3.2. Report LWA-96-05, DLO Agricultural
Mathematics Group, Wageningen.
Kokurewicz, T. 1994-95. Increased population of Daubenton's bat (Myotis daubentoni (Kuhl,
1819)) (Chiroptera: Vespertilionidae) in Poland. Myotis 32-33: 155-161.
Kronwitter, F 1988. Population structure, habitat use and activity patterns of the Noctule bat,
Nyctalus noctula Schreber 1774 (Chiroptera: Vespertilionidae) revealed by radio-tracking. Myotis 26:23-85.
Krull, D.,A. Schumm, W.Metzner & G. Neuweiler 1991.Foraging areas and foraging behavior
in the notch-eared bat, Myotis emarginatus (Vespertilionidae). Behavioral Ecology and
Sociobiology 28:247-253.
Krusic, R.A. & CD. Neefis 1996. Habitat associations of bat species in the White Mountain
National Forest. In: R.M.R. Barclay & R.M. Brigham (eds.), Bats and Forests: proceedings of the first bats and forests conference, Victoria. British Columbia Ministry of
Forests, Victoria; 185-198.
Labee, A.H. & A.M. Voûte 1983.The diet of a nursery colony of the serotine bat Eptesicus serotinus (Schreber, 1774) in the Netherlands. Lutra 26: 12-19.
Lancaster, W.C., O.W. Henson Jr. & A.W. Keating 1995.Respiratory muscle activity in relation
to vocalization in flying bats.Journal of Experimental Biology 198: 175-191.
Lewis, T. 1969a. The distribution of flying insects near a low hedgerow. Journal of Applied
Ecology 6: 443-452.
Lewis, T. 1969b. The diversity of the insect fauna in a hedgerow and neighbouring fields.
Journal of Applied Ecology 6:453-458.
Lewis, T. 1970. Patterns of distribution of insects near a windbreak of tall trees. Annals of
Applied Biology 65:213-220.
Lewis, T.& G.C. Dibley 1970:Air movement near windbreaks and a hypothesis of the mechanism of the accumulation of airborne insects. Annals of Applied Biology 66:477-484.
Lewis, T.& J.W. Stephenson 1966. The permeability of artificial windbreaks and the distribution of flying insects in the leeward sheltered zone. Annals of Applied Biology 58:355363.
Lide, D.R. 1995-1996. CRCHandbook of chemistry and physics. CRCPress, New York.
Limpens, H.J.G.A. 1993.Bat-detectors in a detailed bat survey: a method. In: K. Kapteyn (ed.),
Proceedings of the First European Bat Detector Workshop. Netherlands Bat Research
Foundation, Amsterdam; 79-90.
115
T H E
U S E
OF
E D G E
H A B I T A T S
BY
C O M M U T I N G
A N D
F O R A G I N G
B A T S
/
R E F E R E N C E S
Limpens, H.J.G.A. &K. Kapteyn 1991. Bats, their behaviour and linear landscape elements.
Myotis 29: 63-71.
Limpens, H., K. Mostert &W. Bongers (red.) 1997. Atlas van de Nederlandse vleermuizen.
KNNV, Utrecht.
Limpens, H.J.G.A., W. Helmer, A. van Winden &K. Mostert 1989. Bats (Chiroptera) and linear
landscape elements. Lutra 32, 1: 1-20.
Marimuthu, G., J. Habersetzer &D. Leippert 1995. Active acoustic gleaning from the water surface by the Indian false vampire bat, Megaderma lyra. Ethology 99: 61-74.
McCullagh, P. &J.A. Neider 1989. Generalized linear models. Chapman &Hall, London.
McKenzie, N.L., A.C. Gunnell, M. Yani &M.R. Williams 1995. Correspondence between flight
morphology and foraging ecology in some Paleotropical bats. Australian Journal of
Zoology 43: 241-257. '
Menne, D. 1988. A matched filter bank for time delay estimation in bats. In: P.E. Nachtigall &
P.W.B. Moore (eds.), Animal Sonar: Processes and Performance. NATO ASI Series A:
Life Sciences Vol. 156. P l e n u m Press, New York; 835-842.
Milinski, M. 1986. Constraints placed by predators on feeding behaviour. In: T.J. Pitcher (ed.),
The Behaviour of Teleost Fishes. Croom Helm, England; 236-252.
Miller, L.A. &H.J. Degn 1981. The acoustic behavior of four species of vespertilionid bats studied in the field. Journal of Comparative Physiology 142: 67-74.
Ministry of Agriculture, Nature Management and Fisheries 1990. Nature Policy Plan of The
Netherlands. Ministry of Agriculture, Nature Management and Fisheries, The Hague.
Ministry of Agriculture, Nature Management and Fisheries 1995. Structuurschema Groene
Ruimte. Het landelijk gebied de moeite waard. Deel 4. Toelichting bij Planologische
Kernbeslissing. Ministry of Agriculture, Nature Management and Fisheries, The Hague.
Mostert, K. &A. van Winden 1989. Vleermuizen in Noordwest-Overijssel. Report Directie
Natuur, Milieu en Faunabeheer, Consulentschap Overijssel.
Mueller, H.C. 1965. Homing and distance orientation in bats. Zeitschrift für Tierpsychologie 23:
403-421.
Mueller, H. &J.T. Emlen Jr. 1957. Homing in bats. Science 126: 307-308.
Nägeli, W. 1946. Weitere Untersuchungen über die Windverhältnisse im Bereich von
Windschutzstreifen. Mitteilungen Schweizerische Anstalt des forstlichen
Versuchswesens 24, 2: 659-737.
Neuweiler, G. 1989. Foraging ecology and audition in echolocating bats. Trends in Ecology and
Evolution 4, 6: 160-166.
Neuweiler, G. 1990. Auditory adaptations for prey capture in echolocating bats. Physiological
Reviews 70, 3: 615-641.
Neuweiler, G. &M.B. Fenton 1988. Behaviour and foraging ecology of echolocating bats. In:
P.E. Nachtigall &P.W.B. Moore (eds.), Animal Sonar: Processes and Performance. NATO
ASI Series A: Life Sciences Volume 156. Plenum Press, New York; 535-550.
Norberg, R.À. 1981. Optimal flight speed in birds w h e n feeding young. Journal of Animal
Ecology 50: 473-477.
Norberg, U.M. 1981. Flight, morphology and the ecological niche in some bats and birds.
Symposium of the Zoological Society of London 48: 173-197.
Norberg, U.M. 1990. Vertebrate flight. Mechanics, physiology, morphology, ecology and evolution. Springer, Berlin.
Norberg, U.M. &J.M.V. Rayner 1987. Ecological morphology and flight in bats (Mammalia;
Chiroptera): wing adaptations, flight performance, foraging strategy and echolocation.
Philosophical Transactions of the Royal Society of London B 316: 335-427.
Nyholm, E.S. 1965. Zur Ökologie von Myotis mystacinus (Leisl.) u n d M. daubentoni (Leisl.)
(Chiroptera). Annales Zoologici Fennici 2: 77-123.
116
T H E
U S E
OF
E D G E
H A B I T A T S
BY
C O M M U T I N G
A N D
F O R A G I N G
B A T S
/
R E F E R E N C E S
Obrist, M.K. 1995. Flexible bat echo-location: the influence of individual, habitat and conspecifics on sonar signal design. Behavioral Ecology and Sociobiology 36: 207-219.
O p d a m , P., G. Rijnsdijk &F. Hustings 1985. Bird communities in small woods in an agricultural landscape: effects of area and isolation. Biological Conservation 34: 333-352.
O'Shea, T.J. &T.A. Vaughan 1980. Ecological observations on an East African bat community.
Mammalia 44: 485-496.
Patterson, H.D. &R. T h o m p s o n 1971. Recovery of inter-block information w h e n block sizes are
unequal. Biometrika 58: 545-554.
Pennycuick C.J. 1969. The mechanics of bird migration. Ibis 111: 525-556.
Pennycuick, C.J. 1975. Mechanics of Flight. In: D.S. Farner, J.R. King &K.C. Parkes (eds.),
Avian Biology Volume 5. Academic Press, London; 1-73.
Pennycuick, C.J. 1989. Bird Flight Performance: A Practical Calculation Manual. Oxford
University Press.
Perdue, M. &J.D. Steventon 1996. Partial cutting and bats: a pilot study. In: R.M.R. Barclay &
R.M. Brigham (eds.), Bats and Forests: proceedings of the first bats and forests conference, Victoria. British Columbia Ministry of Forests, Victoria; 273-276.
Pettersson, L. 1993. Ultrasound detectors: different techniques, purposes and methods. In: K.
Kapteyn (ed.), Proceedings of the first European Bat Detector Workshop. Netherlands
Bat Research Foundation, Amsterdam; 11-19.
Pettigrew, J.D., B.G.M. Jamieson, S.K. Robson, L.S. Hall, K.I. McAnally &H.M. Cooper 1989.
Phylogenetic relations between microbats, megabats and primates (Mammalia:
Chiroptera and Primates). Philosophical Transactions of the Royal Society of London B
325: 489-559.
Pomeroy, D. 1990. Why fly? The possible benefits for lower mortality. Biological Journal of the
Linnean Society 40: 53-65.
Racey, P.A. &S.M. Swift 1985. Feeding ecology of Pipistrellus pipistrellus (Chiroptera:
Vespertilionidae) during pregnancy and lactation. I. Foraging behaviour. Journal of
Animal Ecology 54: 205-215.
Rayner, J.M.V 1986. Vertebrate flapping flight mechanics and aerodynamics, and the evolution
of flight in bats. In: W. Nachtigall (ed.), Bat Flight - Fledermausflug. Biona Report 5: 2774.
Rayner, J.M.V. 1991a. On t h e aerodynamics of animal flight in ground effect. Philosophical
Transactions of the Royal Society of London B 334: 119-128.
Rayner, J.M.V. 1991b. Complexity and a coupled system: flight, echolocation and evolution in
bats. In: N. Schmidt-Kittler &K. Vogel (eds.), Constructional Morphology and
Evolution. Springer, Berlin; 173-191.
Rayner, J.M.V. 1991c. The cost of being a bat. Nature 350: 383-384.
Rayner, J.M.V. 1993. On aerodynamics and the energetics of vertebrate flapping flight.
Contemporary Mathematics 141: 351-400.
Rayner, J.M.V. &H.D.J.N. Aldridge 1985. Three-dimensional reconstruction of animal flight
paths and the turning flight of microchiropteran bats. Journal of Experimental Biology
118: 247-265.
Rieger, I., D. Walzthony &H. Alder 1990. Wasserfledermäuse, Myotis daubentonii, benutzen
Flugstrassen. Mitteilungen der Naturforschungsgesellschaft Schaffhausen 35: 37-68.
Robinson, M.F. &R.E. Stebbings 1993. Food of the serotine bat, Eptesicus serotinus - is faecal
analysis a valid qualitative and quantitative technique? Journal of Zoology (London)
231: 239-248.
Roverud, R.C. &A.D. Grinnell 1985. Echolocation sound features processed to provide distance
information in the CF/FM bat, Noctilio albiventris: evidence for a gated time w i n d o w
utilising both CF and FM components. Journal of Comparative Physiology A 156: 457-
117
T H E
U S E
OF
E D G E
H A B I T A T S
BY
C O M M U T I N G
A N D
F O R A G I N G
B A T S
/
R E F E R E N C E S
469.
Rydell, J. 1990. Behavioural variation in echolocation pulses of the Northern bat, Eptesicus
nilssoni. Ethology 85: 103-113.
Rydell, J. 1992. Exploitation of insects around streetlamps by bats in Sweden. Functional
Ecology 6: 744-750.
Rydell, J. 1993. Variation in the sonar of an aerial-hawking bat (Eptesicus nilssonii). Ethology
93: 275-284.
Rydell, J., A. Entwistle &P.A. Racey 1996. Timing and foraging flights of three species of bats
in relation to insect activity and prédation risk. Oikos 76: 243-252.
Rydell, J., A. Bushby, C.C. Cosgrove &P.A. Racey 1994. Habitat use by bats along rivers in
north-east Scotland. Folia Zoologica 4 3 : 417-424.
Sahley, CT., M.A. Horner &T.H. Fleming 1993. Flight speeds and mechanical power outputs of
the nectar-feeding bat, Leptonycteris curasoae (Phyllostomidae: Glossophaginae).
Journal of Mammalogy 74: 594-600.
Saillant, P.A., J.A. Simmons, S.P. Dear &T.A. McMullen 1993. A computational model of echo
processing and acoustic imaging in frequency-modulated echolocating bats: the spectogram correlation and transformation receiver. Journal of the Acoustical Society of
America 94: 2691-2712.
Salcedo, H. De La Cueva, M B . Fenton, M B . Hickey &R.W. Blake 1995. Energetic consequences of flight speeds of foraging red and hoary bats (Lasiurus borealis and Lasiurus cinereus; Chiroptera: Vespertilionidae). Journal of Experimental Biology 198: 2245-2251.
Sales, G.D. &J.D. Pye 1974. Ultrasonic Communication by Animals. Chapman &Hall, London.
Saville, D.J. 1990. Multiple comparison procedures: the practical solution. American
Statistician 44, 2: 174-180.
Schmidt, S. &J. Thaller 1994. Temporal auditory summation in the echolocating bat, Tadarida
brasiliensis. Hearing Research 77: 125-134.
Schnitzler, H.-U. 1971. Fledermäuse im Windkanal. Zeitschrift für Vergleichende Physiologie
73: 209-221.
Schnitzler, H.-U. 1987. Echoes of fluttering insects: information for echolocating bats. In: M.B.
Fenton, P.A. Racey &J.M.V Rayner (eds.), Recent Advances in t h e Study of Bats.
Cambridge University Press; 226-243.
Schnitzler, H.-U., E.K.V Kalko, L. Miller &A. Surlykke 1987. Hunting a n d echolocation behaviour of the bat, Pipistrellus kuhli. Journal of Comparative Physiology A 161: 267-274.
Schnitzler, H.-U., E.K.V. Kalko, I. Kaipf &A.D. Grinnell 1994. Fishing a n d echolocation behaviour of the greater bulldog bat, Noctilio leporinus, in the field. Behavioral Ecology and
Sociobiology 35: 327-345.
Schober, W. &E. Grimmberger 1989. Bats of Britain and Europe. Hamlyn, London.
S c h u m m , A., D. Krull &G. Neuweiler 1991. Echolocation in the notch-eared bat, Myotis emarginatus. Behavioral Ecology and Sociobiology 28: 255-261.
Simmons, J.A. &A.D. Grinnell 1988. The performance of echolocation: acoustic images perceived by echolocating bats. In: P.E. Nachtigall &P.W.B. Moore (eds.), Animal Sonar:
Processes and Performance. NATO ASI Series A: Life Sciences Volume 156. Plenum
Press, New York; 353-385.
Simmons, J.A. &R.A. Stein 1980. Acoustic imaging in bat sonar: echolocation signals and the
evolution of echolocation. Journal of Comparative Physiology 135: 61-84.
Simmons, J.A., M. Ferragamo, C.F. Moss, S.B. Stevenson &R.A. Altes 1990. Discrimination of
jittered sonar echoes by the echolocating bat, Eptesicus fuscus: the shape of target images in echolocation. Journal of Comparative Physiology A 167: 589-616.
Speakman, J.R. 1991. The impact of prédation by birds on bat populations in the British Isles.
Mammal Review 2 1 , 3: 123-142.
118
T H E
U S E
OF
E D G E
H A B I T A T S
BY
C O M M U T I N G
A N D
F O R A G I N G
B A T S
/
R E F E R E N C E S
Speakman, J.R. &P.A. Racey 1991.No cost of echolocation for bats in flight. Nature 350:421423.
Speakman, J.R., M.E. Anderson &RA. Racey 1989. The energy cost of echolocation in pipistrelle bats (Pipistrellus pipistrellus). Journal of Comparative Physiology A 165: 679-685.
Spedding, G.R., J.M.V. Rayner &C.J. Pennycuick 1984. M o m e n t u m and energy in the wake of a
pigeon (Columba livia) in slow flight. Journal of Experimental Biology 111: 81-102.
Stebbings, R.E. 1988. Conservation of European bats. Christopher Helm, London.
Stebbings, R.E. &F. Griffith 1986. Distribution a n d status of bats in Europe. Institute of
Terrestrial Ecology, Huntingdon.
Stones, R.C. & L.P. Branick 1969. Use of hearing in homing by two species of Myotis bats.
Journal of Mammalogy 50, 1: 157-160.
Strelkov, P.P. 1969. Migratory and stationary bats (Chiroptera) of the European part of the
Soviet Union. Acta Zoologica Cracoviensia 14: 393-439.
Suga, N. &P. Schlegel 1972. Neural attenuation of responses to emitted sounds in echolocating
bats. Science 177: 82-84.
Sullivan, C M . , C.B. Shiel, C M . McAney &J.S. Fairley 1993. Analysis of the diets of Leisler's
Nyctalus leisleri, Daubenton's Myotis daubentoni and pipistrelle Pipistrellus pipistrellus bats in Ireland. Journal of Zoology (London) 231: 656-663.
Surlykke, A., L.A. Miller, B. M0hl, B.B. Anderson, J. Christensen-Dalsgaard &M.B. Jorgensen
1993. Echolocation in two very small bats from Thailand: Craseonycteris thonglongyai
and Myotis siligorensis. Behavioral Ecology and Sociobiology 33: 1-12.
Suthers, R.A. 1965. Acoustic orientation by fish-catching bats. Journal of Experimental Zoology
158: 319-348.
Suthers, R.A., S.P. Thomas &B.J. Suthers 1972. Respiration, wingbeat and ultrasonic pulse
emission in an echolocating bat. Journal of Experimental Biology 56: 37-48.
Swift, S.M. 1980. Activity patterns of Pipistrelle bats (Pipistrellus pipistrellus) in north-east
Scotland. Journal of Zoology (London) 190: 285-295.
Swift, S.M. &P.A. Racey 1983. Resource partitioning in two species of vespertilionid bats
(Chiroptera) occupying the same roost. Journal of Zoology (London) 200: 249-259.
Swift, S.M., P.A. Racey &M.I. Avery 1985. Feeding ecology of Pipistrellus pipistrellus
(Chiroptera: Vespertilionidae) during pregnancy and lactation. II. Diet. Journal of
Animal Ecology 54: 217-225.
Taylor, L.R. 1974. Insect migration, flight periodicity and the boundary layer. Journal of Animal
Ecology 43: 225-238.
Thomas, A.L.R., G. Jones, J.M.V. Rayner &P.M. Hughes 1990. Intermittent gliding flight in the
pipistrelle bat (Pipistrellus pipistrellus) (Chiroptera: Vespertilionidae). Journal of
Experimental Biology 149: 407-416.
Thomas, D.W., G.P. Bell &M.B. Fenton 1987. Variation in echolocation call frequencies recorded from north american vespertilionid bats: a cautionary note. Journal of Mammalogy
68, 4: 842-847.
Thompson, D. &M.B. Fenton 1982. Echolocation and feeding behaviour of Myotis adversus
(Chiroptera: Vespertilionidae). Australian Journal of Zoology 30: 543-546.
Van Dorp, D. &P.F.M. O p d a m 1987. Effects of patch size, isolation and regional abundance on
forest bird communities. Landscape Ecology 1, 1: 59-73.
Vaughan, N., G. Jones &S. Harris 1996. Effects of sewage effluent on the activity of bats
(Chiroptera: Vespertilionidae) foraging along rivers. Biological Conservation 78, 3: 337343.
Vaughan, N., G. Jones &S. Harris 1997. Identification of British bat species by multivariate analysis of echolocation call parameters. Bioacoustics 7: 189-207.
Verboom, B. &R. van Apeldoorn 1990. Effects of habitat fragmentation on the red squirrel,
119
T H E
U S E
OF
E D G E
H A B I T A T S
BY
C O M M U T I N G
A N D
F O R A G I N G
B A T S
/
R E F E R E N C E S
Sciurus vulgaris L. Landscape Ecology 4, 2/3: 171-176.
Verboom, B. &H. Huitema 1997. The importance of linear landscape elements for the pipistrelle Pipistrellus pipistrellus and the serotine bat Eptesicus serotinus. Landscape Ecology
12, 2: 117-125.
Voûte, A.M. 1972. Bijdrage tot de oecologie van de meervleermuis, Myotis dasycneme (Boie,
1825). PhD thesis, University of Utrecht.
Walsh, A.L. & S. Harris 1996a. Foraging habitat preferences of vespertilionid bats in Britain.
Journal of Applied Ecology 33: 508-518.
Walsh, A.L. &S. Harris 1996b. Factors determining the a b u n d a n c e of vespertilionid bats in
Britain: geographical, land class and local habitat relationships. Journal of Applied
Ecology 33: 519-529.
Waters, D.A. &G. Jones 1995. Echolocation call structure and intensity in five species of insectivorous bats. Journal of Experimental Biology 198: 475-489.
Waters, D.A., J. Rydell &G. Jones 1995. Echolocation call design and limits on prey size: a case
study using the aerial-hawking bat Nyctalus leisleri. Behavioral Ecology and
Sociobiology 37: 321-328.
Wegner, J.F. &G. Merriam 1979. Movements by birds and small m a m m a l s between w o o d and
adjoining farmland habitats. Journal of Applied Ecology 16: 349-358.
Wilkinson, G.S. 1992. Information transfer at evening bat colonies. Animal Behavior 44: 501518.
Wilkinson, G.S. 1995. Information transfer in bats. Symposium of the Zoological Society of
London 67: 345-360.
Williams, T.C., L.C. Ireland &J.M. Williams 1973. High altitude flights of the free-tailed bat,
Tadarida brasiliensis, observed with radar. Journal of Mammalogy 54: 807-821.
Williams, T.C., J.M. Williams &D.R. Griffin 1966. The homing ability of the neotropical bat
Phyllostomus hastatus, with evidence for visual orientation. Animal Behavior 14: 468473.
Wolf, PR. 1983. Elements of Photogrammetry. McGraw-Hill, New York.
Zbinden, K. 1989. Field observations o n the flexibility of the acoustic behaviour of the
European bat Nyctalus noctula (Schreber, 1774). Revue Suisse de Zoologie 69, 2: 335343.
Zingg, P.E. 1988. Search calls of echolocating Nyctalus leisleri and Pipistrellus savii
(Mammalia: Chiroptera) recorded in Switzerland. Zeitschrift für Säugetierkunde 53:
281-293.
120
T H E
U S E
OF
E D G E
H A B I T A T S
BY
C O M M U T I N G
A N D
F O R A G I N G
B A T S
/
D A N K W O O R D
Dankwoord
Toen mij in de zomer van 1991 in een Zweedse telefooncel een promotieonderzoek
aan vleermuizen in het vooruitzicht werd gesteld, moest ik wel even slikken. Ikrealiseerde mij dat mijn kennis van deze dieren bleef steken bij die van de gemiddelde
Nederlander, of ten hoogste van een gemiddelde bioloog. Mijn definitie van vleermuizen luidde: vliegende zoogdieren, die zich in het nachtelijk duister oriënteren
met behulp van echolocatie. De meest kenmerkende en essentiële aspecten van hun
levenswijze had ik hiermee weliswaar te pakken, ik bevroedde echter nog nauwelijks hoe fascinerend deze dieren werkelijk zouden zijn. Vooral hun uitgebreide scala
aan echolocatiegeluiden opende voor mij een nieuwe wereld. Gedurende de eerste
zomermaanden na mijn aanstelling heb ik vele nachten buiten doorgebracht, waarbij mij de kneepjes van het determineren op geluid met behulp van de 'bat detector'
werden bijgebracht door onder meer Herman Limpens, Kees Kapteyn en Minne
Feenstra. Als verwoed vogelaar ging mij dit vrij gemakkelijk af.
De ideeën die ten grondslag hebben gelegen aan dit onderzoek, waren afkomstig van Nederlandse pioniers op het gebied van vleermuisonderzoek met bat detectors, met name Herman Limpens, Wouter Heimer, Kees Kapteyn, Kees Mostert, Ludy
Verheggen en Alphons van Winden. Dat dit onderzoek van de grond kon komen is
daarnaast te danken aan de inzet van Wim Bongers (LUW),Paul Opdam en Jan Veen
(beiden IBN-DLO), en Peter Lina (Vleermuiswerkgroep Nederland).
Vooral in de beginperiode van mijn onderzoek vormden de kennis en ervaring
van Herman Limpens op het gebied van vleermuizen een belangrijke bron van informatie en advies, in algemene zin, en in het bijzonder voor de opzet van hoofdstuk 4.
Herman, op jouw krappe zolderkamertje hebben we geregeld gebrainstormd over
wilde, al dan niet uitvoerbare ideeën. Na Hermans vertrek naar Duitsland diende
vooral mijn co-promotor Jan Veen als inhoudelijk klankbord op het IBN-DLO. Jan,
door discussies met jou is de structuur van enkele hoofdstukken belangrijk verbeterd. Daarnaast waren de discussies met, en het opbouwend commentaar van Wim
Bongers, Arend Brunsting en, in het begin van mijn onderzoek, Paul Opdam van
groot belang. Prof. dr. Herbert Prins wil ikbedanken dat hij als promotor wilde optreden, en voor zijn stellige en inspirerende commentaar op manuscripten. Herbert, jij
wees mij er telkens en terecht op [to] "keep it simple" en "not [to] clutter [my] message". Dit kwam de helderheid van enkele stukken zeer ten goede.
Hans Huitema kwam in 1992 als gewetensbezwaarde aan het onderzoek meewerken. De samenwerking met Hans heb ik als bijzonder inspirerend ervaren. Hans,
onze brainstormsessies tijdens nachtelijke fietstochten in het veld hielpen mij (en
jou) om ook na drieën het hoofd erbij te houden. Twee veldseizoenen op Walcheren
was je erbij. Door 'Lyme' geveld, moest je helaas het veldseizoen in Twente grotendeels missen. Hans heeft een wezenlijke bijdrage geleverd aan hoofdstuk 2; ideeën
van hem vinden hun weerslag in hoofdstuk 3 en 6.
Zonder de hulp en inzet van studenten en stagiairs was dit proefschrift niet
tot stand gekomen. Arjan Boonman verrichtte zijn onderzoek aan de LUW als doctoraalstudent van de Universiteit Utrecht. Zijn kennis van en ervaring met echolocatie waren onontbeerlijk voor het welslagen van het complexe onderzoek aan de
meervleermuis in Friesland (hoofdstuk 4). Martijn Boonman wil ik bedanken voor
121
T H E
U S E
OF
E D G E
H A B I T A T S
BY
C O M M U T I N G
A N D
F O R A G I N G
B A T S
/
D A N K W O O R D
zijn hulp in het veld. Adam Britten and Gareth Jones, I thank you both for our
pleasant and fruitful collaboration, and for introducing to me this wonderful technique of 'multi-flash stereophotogrammetry', which unravelled many aspects of
pond bat behaviour.
Erik Gorter en Kamiel Spoelstra waren studenten van de vakgroep
Terrestrische Oecologie en Natuurbeheer van de LUW. Tijdens hun verblijf van drie
maanden in Polen hebben zij met veel inzet en improvisatievermogen een mooie
dataset verzameld en bewerkt, en zodoende hun stempel gedrukt op hoofdstuk 3.Dr.
Michael Kozakiewicz (Warsaw University), thank you for helping us to organise our
stay in Poland. Dr.R. Halba (Warsaw University), Elzbièta and Maçiek Fuszara, and
Grzegorz Lesinski (Institute of Ecology^Lomianki), many thanks for your hospitality
and for sharing with us such agood time on this wonderful spot at the Urwitah Field
Station. Liesbeth Brussen, Marian van Lieshout, Bert Oude Egbrink, Bas Slatman,
Vera Streutker, Bianca de Vos en Eva Willems hebben als assistent of stagiaire een
belangrijke bijdrage geleverd aan veldwerk in Twente, Walcheren en Friesland. Cor
Berrevoets, Coos Ettema, Aylin Erkman, Anton van Haperen, Jan en Daniël
Goedbloed, Jan Hengst, Marcel Klootwijk, Luud Persijn, Leo Santbergen, Joop
Scheijbeler, Bert van Staveren en Fred Twisk hielpen mee aan simultaantellingen op
Walcheren.
Het IBN-DLOheb ik altijd als een zeer inspirerende werkplek ervaren. Ik dank
mijn collega's en afdelingsgenoten voor de prettige sfeer. Zowel vanuit de LUW als
het IBN-DLO heb ik altijd voldoende ruimte bij de uitvoering van mijn onderzoek
gekregen.
Ludy Verheggen, Kees Kapteyn en Rombout de Wijs dank ik voor het kritisch
doornemen en becommentariëren van manuscripten. Hilko van der Voet dank ik
voor zijn statistische ondersteuning. Thom van Rossum wil ik bedanken voor de
eindredactie van het proefschrift.
Jana wil ik bedanken voor haar morele steun en flexibiliteit tijdens mijn
onderzoek. Jana, wanneer ik voor veldwerk tijdens zomermaanden langdurig afwezig was, wist jij de opvoeding en verzorging van Lukas en Simon in hun eerste
levensjaren op energieke en creatieve wijze te combineren met jouw eigen drukke
baan.
Tot slot wil ik mijn moeder bedanken, voor het feit dat zij, al in mijn prille
jeugd, mijn belangstelling voor biologie heeft gestimuleerd en mij alle ruimte heeft
gegeven mijn kennis van plantjes en beestjes te vergroten.
122
THE
USE
OF
E D G E
H A B I T A T S
BY
C O M M U T I N G
A N D
F O R A G I N G
B A T S
/
C U R R I C U L U M
V I T A E
Curriculum vitae
Ben Verboom werd geboren op 8oktober 1962 te Amsterdam. Na het behalen van het
diploma Gymnasium-ß op de Christelijke Scholengemeenschap Overvoorde in 1981,
studeerde hij biologie aan de Rijksuniversiteit Leiden, waar hij in 1987 het doctoraalexamen aflegde. Het hoofdvak dieroecologie werd gevolgd op de Katholieke
Universiteit Nijmegen (bij dr. J.J. van Gelder), en bestond uit een studie van kolonisatie-kansen van nieuwe poelen door amfibieën in Zuid-Limburg, alsmede van de
effecten van poelgrootte en isolatie op deze diergroep. Daarnaast werd een vangstterugvangst onderzoek gedaan van de geelbuikvuurpad Bombina variegata. Aan de
RULwerd het bijvak plantenoecologie gedaan (bij dr. A.H. Prins). Onderwerp was de
relatie tussen de vlinder Ethmia bipunctella en hondstong Cynoglossum officinale,
waarbij vooral gekeken werd naar de door vraat geïnduceerde afweer door de plant.
In 1988 en 1989 was Ben Verboom volontair onderzoeker op de afdeling
Landschapsecologie van het Instituut voor Bos- en Natuuronderzoek (IBN-DLO), het
toenmalige Rijksinstituut voor Natuurbeheer (RIN), waar hij de effecten van habitatfragmentatie op de eekhoorn, en op evertebraten-populates in schraalgraslanden in
Zuid-Limburg, onderzocht. In 1990 werkte hij als freelance onderzoeker aan twee
projecten. In opdracht van Heidemij Adviesburo B.V. voerde hij een ecologische
inventarisatie uit van insekten in een bos/heide-terrein. Daarnaast werd, in opdracht
van de toenmalige Directie Natuur-, Milieu- en Faunabeheer (NMF) van het
Ministerie van Landbouw, Natuurbeheer en Visserij, populatie-dynamisch onderzoek verricht aan de geelbuikvuurpad in Zuid-Limburg. In 1991 trad hij in dienst
van de vakgroep Terrestrische Oecologie en Natuurbeheer (TON) van de
Landbouwuniversiteit Wageningen. Als DLO-AIO was hij gedetacheerd op de afdeling Dierecologie van het IBN-DLO. Dit proefschrift is hieruit voortgekomen. Hij is
getrouwd met Jana Vasiljev en is vader van twee kinderen, Lukas (1993) en Simon
(1994).
123
© Copyright 2026 Paperzz