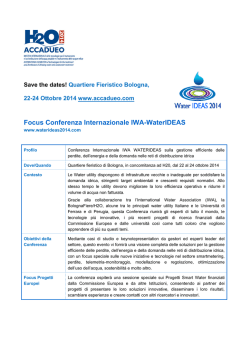
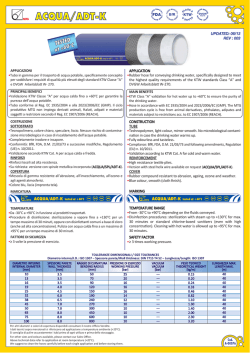
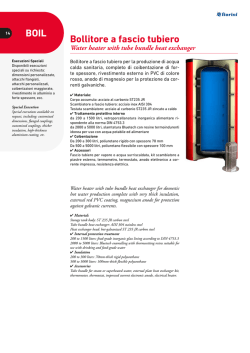
Water and sewage service Quality: proposal of a new multi-questionnaire monitoring tool F. Franceschini, M. Galetto, E. Turina DISPEA, Politecnico di Torino, Corso Duca degli Abruzzi 24, 10129 - Torino, ITALY, Tel. +39 011 5647225, Fax. +39 011 5647299, e-mail: [email protected] Abstract The measurement of a service Quality is a relevant issue for organizations. In this paper we describe an application of the Parasuraman, Zeithalm and Berry’s (PZB) conceptual model of service Quality in the field of the water and sewage service. The PZB model determinants have been specialized for this specific target and a multi-questionnaire has been developed. This activity has been developed basing on Quality Function Deployment methodology. The described approach is structured into two parts. The first one concerns a general evaluation of the service Quality, while the second one considers specific service aspects enabling to better understand possible reasons of dissatisfaction. A specific application software to support data collection and statistical analysis is described. The proposed monitoring tool ensures an overall evaluation of service Quality from the customer point of view. Its organization into two parts allows reducing the overall costs of data acquisition as well as maximizing the information got from customers. The multi-questionnaire can be tailored in order to meet the needs of both customers and service controller in the monitored areas. The results of the survey show the perceived Quality of the service. Future work will be focused on the comparison between the customers’ perceptions and the Quality which is actually assured by the service provider (the offered Quality). Keywords Service Quality, Water and sewage service, Quality measurement, PZB model, SERVQUAL. 1. Introduction Recently, the need for a more efficient and effective management of water resources has been recognized (Pearson et al., 2009; Vandersypen et al., 2009; Opricovic, 2009; Rosenberg and Lund, 2009). Several European States have decided to privatize their water supply and sewage service in order to improve economic efficiency. The most interesting innovations in this area are produced by the English and French models (Neto, 1998). The role of the customer is recognized as central in 1 these reforms. For example, the English and Welsh Office of Water Service (Ofwat) evaluates the Companies’ success in serving customers by performance indicators on level of service (Ogden, 1997; Butler et al., 2003). As a consequence, understanding and maintaining high Quality is one of the main concerns of service providers. The need for a service Quality measurement is acknowledged also by the Italian reform of the water service (Repubblica Italiana, l. 36/1994; Regione Piemonte, l. 13/1997). These laws establish a unique provider for both water supply and sewage services (i.e. the integrated water service). A new Service Observatory is instituted in each Italian region for the collection and the diffusion of data about the Quality of the regional integrated water service. In this new context, local Authorities are also charged with the monitoring of the service Quality provided by water and sewage Companies which operate in each specific sub-regional area. The work we are going to present arises from the need of having a common regional tool to measure the perceived Quality of the integrated water service. This enables to compare service Quality between different sub-regional areas as well as to analyze integrated water service evolution over time. The perceived Quality of a service is the measure of how the service performed meets customer expectations (Franceschini, 2002; Gronroos, 1982). However, the measurement of a service Quality is very critical. Many methods have been proposed for evaluating the perceived service Quality in the field of the water and sewage service. We cite, for example, MORI Research (Minnesota Opinion Research, Inc.) and MVA Consultancy Ltd. customer researches in Great Britain (MORI Research, 2002; MVA Consultancy, 2003) and the national and local surveys in France (C.I.Eau - TNS SOFRES, 2009; Groupe VEOLIA Environnement, 2006; Agence de l’Eau Seine-Normandie, 2005; Agence de l’Eau Rhin-Meuse, 2005; Agence de l’Eau Loire-Bretagne, 2005) and Italy (ATO 6Alessandrino, 2006; ATO 5-Astigiano e Monferrato, 2001; Regione Lazio, 2004; ATO-Provincia di Lecco, 2006; ATO di Pescara, 2006). However, these questionnaires investigate the perceived service Quality only partially. For example, the perceived competence of the Company personnel as well as its courtesy are often not considered. Moreover, other subjects such as the propensity to pay more the service or the awareness of environmental issues often overlaps with the service Quality analysis. Generally, analyzing these questionnaires, a lack of a structured approach focused on service Quality emerges. This work aims to overcome these limitations. More in detail, we consider as a reference framework the conceptual model of Parasuraman, Zeithalm and Berry (PZB) (Parasuraman, Zeithalm and Berry, 1985). On its basis, in Section 2 we 2 develop a multi-questionnaire to measure the perceived Quality of the integrated water service. Section 3 describes the analysis we carried out and the obtained results. In the Conclusions we sum up the results, highlighting the peculiarities of this new proposed tool. 2. The multi-questionnaire 2.1 Design and structure The first step we followed in the design of the monitoring tool was the identification of factors affecting the service Quality perception. As a reference framework we consider the Parasuraman, Zeithalm and Berry’s service Quality model (PZB model) (Parasuraman, Zeithalm and Berry, 1985; 1988; 1991). This model identifies ten service determinants that consumers adopt in the evaluation of service Quality (see table 2.1). Table 2.1 – Service Quality determinants according to Parasuraman, Zeithalm and Berry’s model (Parasuraman, Zeithalm and Berry, 1985; 1988; 1991). RELIABILITY RESPONSIVENESS COMPETENCE ACCESS COURTESY COMMUNICATION CREDIBILITY SECURITY UNDERSTANDING/ KNOWING THE Involves consistency of performance and dependability; it means that the firm performs the service right the first time; it also means that the firm honours its promises. Concerns the willingness or readiness of employees to provide service; it involves timeliness of service. Means possession of the required skills and knowledge to perform the service. Involves approachability and use of contact. Involves politeness, respect, consideration and friendliness of contact personnel. Means keeping customers informed in language they can understand and listening to them; it may mean that the company has to adjust its language for different consumers. Involves trustworthiness, credibility and honesty; it involves having the customer’s best interests at heart. Is the freedom from danger, risk or doubt. Involves making the effort to understand the customer’s need. CUSTOMER TANGIBLES Include the physical evidence of the service. The PZB model has been used in different contexts. We cite airline, clinical, IT, sports, educational services as well as museums and libraries (Pakdil and Aydin, 2007; Tsitskari et al., 2006; Barnes et al., 2005; Pakdil and Hardwood, 2005; Kuo et al., 2005; Nowakci, 2005; Kang and Bradley, 2002; Cook and Thompson, 2000; Franceschini, 2002). In the present work we apply PZB to the integrated water service. Table 2.2 shows the service determinants specialized for the considered service. They have been obtained through interviews both to customers and to regional and local authorities. 3 Table 2.2 – Determinants of the integrated water service according to PZB’s model (Parasuraman, Zeithalm and Berry, 1985; 1988; 1991). FIRST LEVEL DETERMINANTS SECOND LEVEL DETERMINANTS RELIABILITY 1.1 Constant water supply 1.2 Correct functioning of the sewage system 1.3 Respect of standards in the maintenance of pipeworks and sewage system 1.4 Respect of standards in the maintenance of meters 1.5 Respect of standards in the connection and disconnection to the water service 1.6 Respect of standards in the connection to sewage service 1.7 Billing accuracy 1.8 Respect of standards in setting up and cancelling appointments with the customer 1.9 Respect of standards in replying to requests of information and to complaints RESPONSIVENESS 2.1 Readiness in the maintenance of pipeworks and sewage system 2.2 Readiness in activating the emergency supply of water 2.3 Readiness in the connection and disconnection to the water service 2.4 Readiness in the connection to sewage service 2.5 Readiness in setting up and cancelling appointments with the customer 2.6 Readiness in replying to requests of information and to complaints COMPETENCE 3.1 Technical competence 3.2 Customer service competence ACCESS 4.1 Different ways to contact the Company 4.2 Communication through different media about how to contact the Company 4.3 Easy access to information desks 4.4 Working hours of customer service (phone or information desks) 4.5 Waiting time at phone or information desks COURTESY 5.1 Politeness of contact personnel COMMUNICATION 6.1 Clear language of the contact personnel 6.2 Completeness and transparency of the bill 6.3 Information in case of water service interruption 6.4 Information about water Quality 6.5 Information about the guaranteed standards of the service and other initiatives which involve the customers CREDIBILITY 7.1 Company reputation 7.2 Contact personnel easy to identify and to call back SECURITY 8.1 Safety of tap water 9.1 Company’s effort in understanding customers’ need UNDERSTANDING/ KNOWING THE CUSTOMER TANGIBLES 10.1 Chemical, physical and microbiological Quality of drinking water 10.2 Chemical, physical and microbiological Quality of sewage 10.3 Pipeworks and sewage system 10.4 Meters 10.5 Facilities (car fleet, database system, …) 10.6 Equipment of information points The second step consist in the design of the monitoring tool. It is called as multi-questionnaire since it is composed by several questionnaires. Each of them is a multi-item questionnaire. A five point rating scale is associated to each item. The design of the multi-questionnaire has been carried out by the application of the Quality Function Deployment methodology. Quality Function Deployment is a tool for laying project plan of a new product in a structured and finalized way (Akao, 1990). QFD approach is essentially based on the construction of a table, which synthetically analyzes the relationship between customer needs and technical characteristics of a product or service. Technical characteristics and customer needs are respectively columns and rows 4 of the so called relationship matrix (see figure 2.1(a)). Matrix elements indicate if and how each technical characteristics affects the satisfaction of each customer requirement. QFD may be employed also in the development of a Performance Measurement System of a service (Franceschini et al., 2007; 2009). This case is applied to the present paper. The relationship matrix is modified as indicated in figure 2.1(b). On the rows the service determinants are reported. Starting from them, statements to evaluate the perceived service Quality are deduced. For example, to determinant 1.1 (constant water supply) is associated a statement about the perceived reliability of water supply (see statement 1 in Appendix A.1). For each service determinant one or more statements in the multi-questionnaire are identified. In this way a complete monitoring of the service is guaranteed. Technical characteristics Customers requirements (a) R1 R2 … Ri … Rn EC1 X X … ECj … ECm X X X X X Relationship matrix QFD approach X Adapted QFD approach Statements of the multi-questionnaire (b) Service determinants S1 D1 D2 … Di … Dn …. X Sj … Sm Relationship matrix X X X Figure 2.1 – Adaptation of the Relationship Matrix for the identification of statements of the multiquestionnaire. The water and sewage service determinants (Parasuraman, Zeithalm and Berry, 1985; 1988; 1991) are reported on the rows while on the columns statements are deduced. Each symbol (X) indicates that a determinant of the service Di is monitored by statement Sj. The multi-questionnaire is organized in two different phases: - 1st phase - main questionnaire (see Appendix A.1): it enables a general evaluation of the service. Statements cover all the first level determinants of the service. 5 - 2nd phase - advanced questionnaires (see Appendix A.2): they consider specific subjects. They are submitted to customers dissatisfied according to the results of the main questionnaire. Specifically, they concern the following issues: (1) Emergency supply of water (2) Billing (3) Appointments (4) Service connection and change of address (5) Customer service by desk (6) Customer service by phone (7) Customer service by letter or e-mail (8) Information to customers (9) Quality of tap water The main and the advanced questionnaires ensure a total covering of the second level determinants of the PZB model (table 2.2). The main questionnaire (Appendix A.1) is structured into two parts. The first one (statements 1 to 9) considers the basic elements of the integrated water service. The second part concerns the contacts between the customer and the Water and Sewerage Company personnel. The statement C1 is introduced to assess the consistency of the customer judgments (see Section 4). Finally, the statement S1 verifies if the customer knows the name of the service provider. This statement is strictly related to the Italian case since the reform of the water service requires that the management of the service pass from Municipalities to Water and Sewage Companies. In Appendix A.2 an example of advanced questionnaire is reported. It concerns “Appointments”. In the main and in the advanced questionnaires a five points rating scale is associated to each item. 2.2 Sample and frequency of multi-questionnaire submission The main questionnaire is submitted to a sample of final customers of the integrated water service. Sample size is defined on statistical basis. The size of the sample for each advanced questionnaire depends on the results of the main questionnaire. The main questionnaire is submitted monthly. Such a frequency enables us to identify changes in the satisfaction of customers due to seasonal inefficiency. Advanced questionnaires are submitted on the basis of local Authorities requests (for more details see Section 4). Customers are contacted by phone. In this application we submitted the main questionnaire to a sample of 60 customers for each Company (we considered seven Companies) and each month (the survey lasted 4 month). The population (i.e. the overall number of customers of each Company) is always made by more than 6 7.000 units. Hypothesizing a Binomial distribution of satisfied customers, the sample size may be calculated fixing two parameters: the accuracy of the confidence interval and the confidence coefficient (Montgomery, 2005). In our case study we fixed an accuracy d = 0.2 (i.e. the true percentage of satisfied customers is estimated with an accuracy of +/- 20%) and a type I error α = 0.3% . 400 customers were contacted for the advanced questionnaires. 3. Data analysis and results In this Section we present the techniques used in the analysis of the interviews for the main and the advanced questionnaires. The key results are shown. In order to support data collection and analysis a specific software application has been developed (see Appendix B). It includes the statistic analysis here described as well as the possibility to customize the sample size and other parameters of the interviews according to the need of regional and local Authorities. 3.1 Analysis of interrupted interviews The percentage of interrupted interviews for the main questionnaire was 30%. 70% of the phone calls ended with a completed interview. This means that to reach a sample of 60 completed interviews for each Company (Section 2.2) we made on average 600 calls each month. Each completed interview took on average 5 minutes. We also analyzed the percentage of interruptions associated to each statement. This is an additional indicator to analyze why the phone calls ended. In the case study, 86% of the interruptions felt within the first statement. This suggest that who did not finished the interview was not at all interested in the survey. 3.2 Analysis of completed interviews For each statement, the distribution of judgments is given (see an example in figure 3.1). In this case study, all histograms showed an unimodal distribution. A neat predominant judgment is associated to each service determinant. This suggests a clear formulation of questions which do not confuse customers. 7 Number of interviewees Distribution of answers to question 1 Constant water supply PERIOD: June 2009 COMPANY NAME: Xxx Number of interviewees 40 Legend: 1: Insufficient 2: Weak 3: Sufficient 4: Good 5: Optimum 30 20 10 0 1 2 3 Judgments 4 5 Total answers: 60 Max: 5 Min: 1 Modal value: 4 Median value: 4 Figure 3.1 – Example of the histogram associated to the first statement of the main questionnaire. 68% of the interviewees gave “Optimum” or “Good” answers in the main questionnaire. The analysis of this result has been split into two parts. The first one concerns basic elements of the integrated water service (statements 1 to 9, see Appendix A.1) while the second one considers the contact between the customers and the service provider (statements 10 to 16, see Appendix A.1). The percentage of “Optimum” and “Good” answers reduce to 54% in the second part of the main questionnaire. This result might be partially due to the strong influence of the human factor in the services Quality. Requirements and context conditions may vary from a customer to another. This makes very difficult a standardization of the personnel behaviour (Franceschini, 2002). Finally, interesting results emerge from the analysis of correlation between statements. There is a high correlation (R = 0.62) between the perception of the safety of the supplied water (statement 8, see Appendix A.1) and its taste (statement 7, see Appendix A.1). This suggests that customers generally think that water with a bad taste (e.g. due to the presence of chlorine) is not drinkable. A high correlation is present also between the perception of billing accuracy (statement 5, see Appendix A.1) and the clarity of documents such as the bill, the contract or the customer Service Chart (statement 6, see Appendix A.1). This may suggest that customers generally identify all the documents furnished by the service provider with the bill. As a consequence, if a bill is not clear, customers tend to consider it not correct. 3.3 Clustering of customers In this Section we describe some clustering techniques we used in the analysis of interviews. We grouped customers according to answers to the main questionnaire. 8 We defined a target profile that represents the expected answers by the local Authority (see table 3.1). Clusters of customers are extracted according to the “similarity” of their interviews to the target profile. The composition of the obtained clusters highlights if the satisfaction of customers really corresponds to the expectation of the local Authority. Clusters of customers are obtained by means of a procedure which identifies: - The best group (BG): contains customers who are more satisfied than expected by the local Authority (answers are all better or equal to the target profile); - The intermediate group (IG): contains customers whose satisfaction generally corresponds to the local Authority expectation (answers are part better and part equal or worse than the target profile); - The worst group (WG): contains customers who are less satisfied than expected by the local Authority (answers are all worse than or equal to the target profile). The similarity between each interview and the target profile is evaluated by a rank index (Franceschini et al., 2005). It considers the difference between the rank of the answer to a generic statement a and the rank of the corresponding target value t. Interviews with all rank indexes greater than or equal to zero are included in the best group. Interviews whose rank indexes are all lower than or equal to zero define the worst group. All other interviews fall into the intermediate group. For example, if the target profile is {G, S, S, G, G, S, G, O, G} and an interview answers are {G, O, O, G, O, S, G, O, O} (where O: Optimum; G: Good; S: Sufficient) the rank indexes are {0, 2, 2, 0, 1, 0, 0, 0, 1}. So it belongs to the Best Group. The procedure may be schematized as follows: I = {I1, …, Ii, …, In} : set of interviews. i = 1, …, n : interview index; k = 1, …, m : statement index; aki : rank of the answer to k-th statement in the i- th interview; tk : rank of the target answer to k-th statement; rki : rank index of the answer to k-th statement in the i- th interview; BG, WG, IG : Best Group, Worst Group, Intermediate Group; nBG, nWG, nIG, : dimension of Best Group, Worst Group, Intermediate Group. STEP 0. BG = ; WG = ; IG = ; nBG = 0; nWG = 0; nIG = 0; STEP 1. i = 1, …, n, k = 1, ..., m, rki = aki – tk; i = 1; 9 STEP 2. if k = 1, ..., m rki = 0 then nIG = nIG + 1, IG = IG Ii, i = i+1, if i < n then go to STEP 2 else STOP else if k = 1, ..., m rki 0 then nBG = nBG + 1, BG = BG Ii, i = i+1, if i < n then go to STEP 2 else STOP else if k = 1, ..., m rki 0, then nWG = nWG + 1, WG = WG Ii, i = i+1, if i < n then go to STEP 2 else STOP else nIG = nIG + 1,IG = IG Ii, i = i+1, if i < n then go to STEP 2 else STOP The percentage of interviews included in each cluster of the case study is reported in table 3.1. As we can see, the intermediate group contains the 77% of the interviews. Table 3.1 – Target profile for the first nine statements of the main questionnaire (see Appendix A.1). Clusters are obtained considering the similarity between interviews and the target profile. Cluster name Best group Intermediate group Worst group Target profile: {G, S, S, G, G, S, G, O, G} Percentage of interviews within the cluster 10% 77% 13% Legend: O: Optimum; G: Good; S: Sufficient; W: Weak; I: Insufficient Results obtained are confirmed also by the application of cluster analysis as proposed by Anderberg (Anderberg, 1973). This approach is quite different from the former. The target profile is considered only in a first phase where interviews are coded on the basis of their answers. Then clusters are built considering the similarity between each couple of coded interviews. In detail, according to Anderberg’s approach each answer of an interview is coded as follows: 1: if the answer is greater or equal to the target profile; 0: else. The similarity between two coded interviews (i, j) is then evaluated by the Jaccard similarity index (Johnson and Wichern, 2007; Kaufman and Rousseeuw, 1990; Anderberg, 1973): si , j a abc where a, b and c are respectively the number of relevant matches between the answers as reported in table 3.2. The answers to the same statement k of two different interviews are compared. For example, if both answers belong to the target profile (i.e. they are coded with “1”) the number of relevant matches a is increased of a unit. The comparison is repeated for each statement k = 1, …, 9 10 and the similarity index is calculated. The similarity indexes for each couple of interviews are reported in a similarity matrix. Table 3.2: 2x2 contingency table for binary data. The coded answers to the same statement k of two different interviews (i, j) are compared. The comparison is repeated for each statement k = 1, …, 9 of the main questionnaire and the number of relevant matches a, b, c, d are calculated. Question ki 1 0 Totals 1 a b a+b 0 c d c+d Totals a+c b+d Question kj Groups of interviews are identified using the single linkage method (Anderberg, 1973). The results of the Anderberg’s clustering procedure confirmed the presence of three main groups. In detail, we obtained eight clusters. Two clusters clearly include interviews respectively of the best and of the worst group. Other clusters contain interviews belonging to the intermediate group. 4. Conclusions In this work we present a case study concerning the application of the Parasuraman, Zeithalm and Berry’s model (PZB) for service quality evaluation to water and sewage service. On the basis of this model we developed a multi-questionnaire which enables an overall evaluation of the perceived service Quality from the customer’s point of view. The monitoring is organized into two different phases composed by a first general evaluation of the service by a casual sample of customers, which is followed by a second detailed analysis of the reasons of dissatisfaction. This structure enables to minimize the costs of submission and to maximize the information gained from customers. Different statistical analysis are also suggested. They give a synthesis of the customers’ overall perceptions as well as a detailed picture of the different service aspects. Moreover, a procedure to cluster interviews is proposed. It supports the service controller in verifying if its expectations correspond to the real satisfaction of customers. A software application has been developed to support data collection and analysis. It also enables to customize different parameters of the interviews. In this way the monitoring tool may be adapted to the specific interests of regional and local Authorities but the basic skeleton of the PZB model still remain valid. The multi-questionnaire has been submitted to a sample of customer of seven Water and Sewage Companies operating in Piemonte, an Italian region. 11 Results of the survey highlight distinctive feature of the water and sewage service such as the low frequency of contact between customers and their Water and Sewage Company as well as the mutual influence of some service determinants. Moreover, the outcomes of the questionnaires help service controller to better understand customers needs as well to introduce corrective action in presence of dissatisfaction. Future developments will consider the integration between a set of indicators for the monitoring of the service Quality and the multi-questionnaire presented. This will enable to compare the offered Quality (e.g. the performances of the water and sewage Companies such as the number of interruptions of the water service in a year) and the corresponding perceived Quality (e.g. the perceived reliability of the water service, statement 1 in the main questionnaire). Acknowledgements A special thanks to Ing. Orazio Ruffino, Ing. Giorgio Enrietti-Oslino, Marco Tiso and to all the staff of Direzione Ambiente of Regione Piemonte, Turin. References A.ATO 5 - Astigiano e Monferrato (2001) Indagine sulla percezione della qualità del servizio. http://www.ato5asti.it/index.php?m=menu_sintetico&c=sondaggio/sondaggio. Accessed 14 December 2009 A.ATO 6 - Alessandrino (2006) 4a indagine sulla percezione della qualità dei servizi idrici erogati nell’ATO 6 – Alessandrino. http://www.ato6alessandrino.it/multimedia/83/IMPAGINATO%20ok.pdf. Accessed 14 December 2009 A.ATO di Pescara, Azienda Comprensoriale Acquedottistica S.p.A (2006) Indagine sulla qualità percepita dall’utente nel servizio idrico integrato. http://www.aca.pescara.it/questionarioqualita.php. Accessed 14 December 2009 A.ATO Provincia di Lecco (2006) Indagine sul Servizio idrico Integrato. http://www.provincialecco.it/documenti/Documentazione/documentazione_16_1673.pdf. Accessed 14 December 2009 Agence de l’Eau Loire – Bretagne (2005) Questionnaire: a votre avis ?. http://www.eau-loirebretagne.fr/sdage_et_sage/consultations/2004_2005/resultats_2005. Accessed 14 December 2009 Agence de l’Eau Rhin – Meuse (2005) Consultation du public sur les enjeux de l’eau dans votre région. http://www.eau-rhin-meuse.fr/tlch/rmi/88.pdf. Accessed 14 December 2009 Agence de l’Eau Seine – Normandie (2005) Vous avez la parole. http://www.eau-seinenormandie.fr/index.php?id=2107. Accessed 14 December 2009 Akao Y (1990) Quality Function Deployment. Productivity Press, Cambridge (Ma) 12 Anderberg MR (1973) Cluster analysis for applications. Academic Press, New York, NY Barnes B (2007) Analysing Service Quality: The Case of Post-Graduate Chinese Students. Total Qual Manag Bus Excell 18:313-331. doi: 10.1080/14783360601152558 Barnes BR, Sheys T, Morris DS (2005) Analysing Service Quality: The Case of a US Military Club. Total Qual Manag Bus Excell 16:955-967. doi: 10.1080/14783360500163102 Butler D, Jowitt P, Ashley R, Blackwood D, Davies J, Oltean-Dumbrava C, McIlkenny G, Foxon T, Gilmour D, Smith H, Cavill S, Leach M, Pearson P, Gouda H, Samson W, Souter S, Hendry S, Moir J, Bouchart F (2003) SWARD: decision support processes for the UK water industry. Manag Environ Qual Int J 14:444-459. doi: 10.1108/14777830310488676 Baromètre C.I.Eau - TNS SOFRES (2009) Les français et l’eau - 14eédition. Principaux Résultats. http://www.cieau.com/pdf/baro2009.pdf. Accessed 14 December 2009 Cook C, Thompson B (2000) Reliability and Validity of SERVQUAL Scores Used to Evaluate Perceptions of Library Service Quality. J Acad Librariansh 26:248–258. doi: 10.1016/S00991333(00)00114-2 Franceschini F, Galetto M, Maisano D (2007) Management by Measurement: Designing Key Indicators and Performance Measurements. Springer, Berlin Franceschini F (2002) Advanced Quality Function Deployment. St. Lucie Press, Boca Raton, FL Franceschini F, Galetto M, Maisano D, Viticchiè L (2006) The Condition of Uniqueness in Manufacturing Process Representation by Performance/Quality Indicators. Qual Reliab Engineer Int 22:567-580. doi: 10.1002/qre.762 Franceschini F, Galetto M, Turina E (2009) Service Quality monitoring by performance indicators: a proposal for a structured methodology. Int J Servic Operat Manag 5:251-273. doi: 10.1504/IJSOM.2009.023235 Franceschini F, Galetto M, Varetto M (2005) Ordered Sample Control charts for Ordinal Variables. Qual Reliab Engineer Int 21:177-195. doi:10.1002/qre.614 Gronroos C (1982) Strategic Management and Marketing in the Service Sector. Swedish School of Economics and Business Administration, Helsingfors. Groupe VEOLIA Environnement (2006) Enquête de satisfaction des clients. http://www.developpement-durable.veolia.com/fr/performance-developpement-durable/qualite-deservice.aspx. Accessed 14 December 2009. Johnson RA, Wichern DW (2007) Applied multivariate statistical analysis. Pearson Prentice Hall, Upper Saddle River, NJ. Kang H, Bradley G (2002) Measuring the performance of IT services: An assessment of SERVQUAL. Int J Account Inf Syst 3:151-164. doi:10.1016/S1467-0895(02)00031-3 Kaufman L, Rousseeuw P (1990) Finding groups in data – An introduction to cluster analysis. John Wiley & Sons, New York Kuo T, Lu I, Huang C, Wu G (2005) Measuring Users’ Perceived Portal Service Quality: An Empirical Study. Total Qual Manag Bus Excell 16: 309–320. doi:10.1080/14783360500053824 Montgomery DC (2005) Introduction to Statistical Quality Control. J. Wiley & Sons, New York MORI Research (2002) Customer Research 2002: periodic review – national report. http://www.dwi.gov.uk/consumer/marketr/mori04.pdf. Accessed 14 December 2009. MVA Consultancy (2003) Customer Research 2003: periodic review – national report. http://www.wcl.org.uk/docs/2003/exec_summary.pdf. Accessed 14 December 2009. 13 Neto F (1998) Water privatization and regulation in England and France : a tale of two models. Nat Resour Forum 22:107-117. doi: 10.1111/j.1477-8947.1998.tb00718.x Nowacki MM (2005) Evaluating a museum as a tourist product using the SERVQUAL method. Mus Manag Curatorship 20:235–250. doi:10.1080/09647770500602003 Ogden SG (1997) Accounting for organizational performances: the construction of the customer in the privatized water industry. Account Organ Soc 22: 529-556. doi:10.1016/S03613682(96)00027-X Opricovic S (2009) A Compromise Solution in Water Resources Planning. Water Resour Manag 23:1549–1561. doi:10.1007/s11269-008-9340-y Pakdil F, Aydın Ö (2007) Expectations and perceptions in airline services: An analysis using weighted SERVQUAL scores. J Air Transp Manag 13:229–237. doi:10.1016/j.jairtraman.2007.04.001 Pakdil F, Harwood TN (2005) Patient Satisfaction in a Preoperative Assessment Clinic: An Analysis Using SERVQUAL Dimensions. Total Qual Manag Bus Excell 16:15–30. doi: 10.1080/1478336042000255622 Parasuraman A, Zeithalm VA, Berry LL (1985) A conceptual model of Service Quality and its Implications for Future Research. J Market 49:41-50 Parasuraman A, Zeithaml VA, Berry LL (1988) SERVQUAL: A multiple-Item Scale for Measuring Consumer Perception of Service Quality. J Retail 64:12-40 Parasuraman A, Zeithaml VA, Berry LL (1991) Refinement and Reassessment of the SERVQUAL Scale. J Retail 67:420-450 Pearson LJ, Coggan A, Proctor W, Smith TF, (2009) A Sustainable Decision Support Framework for Urban Water Management. Water Resour Manag. doi:10.1007/s11269-009-9450-1 Regione Lazio - Osservatorio regionale sulla gestione delle risorse idriche, Consulta degli utenti e dei consumatori, Garante regionale del servizio idrico integrato (2004) Indagine conoscitiva sullo stato dei servizi idrici e sul grado di soddisfazione degli utenti della regione Lazio. http://www.regione.lazio.it/binary/web/garante_idrico_rapporti/rapporto_2003_2004.12242415 63.pdf. Accessed 14 December 2009 Regione Piemonte, legge 13/1997 Delimitazione degli ambiti territoriali ottimali per l’organizzazione del servizio idrico integrato e disciplina delle forme e dei modi di cooperazione tra gli Enti Locali ai sensi della Legge 5 gennaio 1994, n. 36 e successive modifiche e integrazioni. Indirizzo e coordinamento dei soggetti istituzionali in materia di risorse idriche. http://arianna.consiglioregionale.piemonte.it/ariaint/TESTO?LAYOUT=PRESENTAZIONE&T IPODOC=LEGGI&LEGGE=013&LEGGEANNO=1997. Accessed 14 December 2009 Repubblica Italiana, legge 36/1994 Disposizioni in materia di risorse idriche. http://www.regione.piemonte.it/bdgiur/download?nomefile=05_01_1994_36.htm. Accessed 14 December 2009 Rosenberg DE, Lund JR (2009) Modelling Integrated Decisions for a Municipal Water System with Recourse and Uncertainties: Amman, Jordan. Water Resour Manag 23:85-115. doi: 10.1007/s11269-008-9266-4 Tsitskari E, Tsiotras D, Tsiotras G (2006) Measuring Service Quality in Sport Services. Total Qual Manag Bus Excell 17: 623–631. doi:10.1080/14783360600588190 14 Vandersypen K, Verbist B, Keita ACT, Raes D, Jamin JY (2009) Linking Performance and Collective Action-the Case of the Office du Niger Irrigation Scheme in Mali. Water Resour Manag 23:153-168. doi:10.1007/s11269-008-9269-1 15 APPENDIX A.1 Main questionnaire for the evaluation of the perceived Quality on integrated water service. 16 APPENDIX A.2 Advanced questionnaire on appointments. 17 APPENDIX B B.1 Software application To support data collection and analysis, we developed a software application. The first display which appears to the operator contains two rows of buttons (see figure B.1). The first row presents three buttons respectively for: - the main questionnaire; - the advanced questionnaires (from number 2 to number 9, see Section 2); - the advanced questionnaire on the emergency supply of water. This questionnaire is submitted independently from the results of the main questionnaire. The frequency of submission depends on local Authorities requirements and on seasonal emergency (e.g. drought during summer). Clicking on these buttons, the operator can access to the different displays. Each interview is recorded into a data base. The second level of buttons is accessible only by the system administrator. This section includes: - the customization button; - the validation button; - the statistics button. SSU UR RVVEEYY O ON N IIN NTTEEG GR RA ATTEED DW WA ATTEER R SSEER RVVIIC CEE Operator name: Period/ Company M a in questionnaire Customization DB Advanced questionnaires Validation Emergency supply of water Statistics EXIT Figure B.1: scheme of the first display of the application software developed to collect and analyze interviews. 18 B.1.1 Customization of the survey Customization enables to introduce the following parameters. Period and area of customization The period the customization applies reflects the frequency of submission of the main questionnaire. When the operator click on the “Period/Company” button (see figure B.1), a list of periods and Water Companies appears. Selecting one element of the list, the operator may choose when and to whom the main questionnaire is submitted. Sample size The input of the sample size activates a counter which indicates how many interviews are left before the end of the first phase of the survey. This counter is reported in the main questionnaire display. Consistency of interviews We evaluate the consistency of an interview by consistency indicators. According to these, an interview may be automatically excluded from further analysis. For example, if the interviewee gives a “Good” judgment about the overall service Quality (statement C1, see Appendix A.1) but in statements 1 to 16 the median evaluation is “Weak”, then the customer is considered not reliable and the questionnaire is cancelled. An acceptance threshold for each consistency indicator may be customized. Decreasing the acceptance threshold, the cost of the survey increase. Priority criteria for the advanced questionnaires Priority criteria are fixed in accordance with the local Authorities. They determine what advanced questionnaires will be submitted. The advanced questionnaires are linked to the main questionnaire as indicated in table B.1. Table B.1: links between the main questionnaire (first phase of the survey, see Appendix A.1) and the advanced questionnaires (second phase of the survey). MAIN QUESTIONNAIRE STATEMENTS 5 6 7 8 / Billing accuracy Clarity of documents Taste of tap water Safety of tap water QC Quality of the contact with Water Company 10 Keeping appointments Readiness in the connection to water service and change of address 12 LINKS TO ADVANCED QUESTIONNAIRES Q.1 Q.2 Q.8 Emergency supply of water Billing Information to customers Q.9 Quality of tap water Q.5 Q.6 Q.7 Q.3 Customer service by desk Customer service by phone Customer service by letter or e-mail Appointments Q.4 Service connection and change of address 19 Priority criteria consider two elements: - the answers to the main questionnaire. An advanced questionnaire is submitted only if in the main questionnaire an “Insufficient” or “Weak” answer is given. A list of advanced questionnaires is created for each interviewee. - the importance of the subject of the advanced questionnaire. If more advanced questionnaires are linked to “Insufficient” answers, they are ordered on the basis of the importance of their subject. The list of advanced questionnaires associated to each interviewee is automatically generated by the software application. When the operator click on the button “advanced questionnaires” the final ordered list is shown for each interviewee. Activities which involve the customer The input of activities which involves the customers enables to customize the advanced questionnaire number 8. B.1.2 Validation of interviews and Statistics The validation button enables a further examination of the consistent interviews. This is done on the basis of the operator notes (see Appendix A.1). Interviews considered not reliable are eliminated. Finally, the statistics button shows the results of the survey. It is possible to analyse a single period (i.e. a month) or more periods jointly. Moreover, the analysis may be applied to a specific Company or to more than one. 20
© Copyright 2026 Paperzz