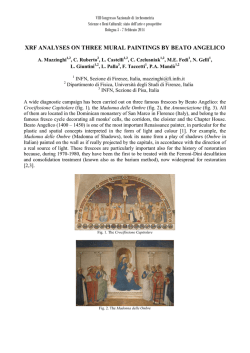
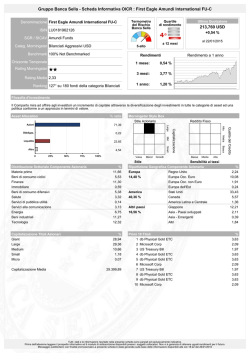
NUCLEAR PHYSICS
MICRO-PIXE AND XRF STUDIES ON NATIVE GOLD
FROM CAVNIC ORE DEPOSIT (BAIA MARE DISTRICT)*
DANIELA CRISTEA-STAN1, B. CONSTANTINESCU1, CATALINA CHIOJDEANU1,
D. CECCATO2, CLAIRE PACHECO3, L. PICHON3
1
Horia Hulubei National Institute for Nuclear Physics and Engineering, P.O.Box MG-6, RO-077125
Bucharest-Magurele, Romania, E-mail: [email protected],E-mail: [email protected],
E-mail: [email protected]
2
Università di Padova, Dip. Di Fisica “G. Galilei” and INFN, Laboratori Nazionali di Legnaro,
I-35020 Legnaro (Padova), Italy, E-mail: [email protected]
3
Centre de Recherche et de Restauration des Musées de France, CNRS UMR 171, Palais du Louvre,
Paris CEDEX 01, France, E-mail: [email protected],
E-mail: [email protected]
Received August 9, 2011
Micro-PIXE (2 MeV protons at AN2000 accelerator of Legnaro and 3 MeV
protons at AGLAE accelerator of CNRS-Louvre) and XRF were used for geochemical
characterization of native gold from Cavnic-Roata mine (Baia-Mare district). Elemental
composition, Ag/(Au+Ag) ratios, trace elements (Te, Sb) suggesting gold minerals
(tellurides) and associated minerals were determined.
Key words: XRF, micro-PIXE, gold, scanning-maps spectra.
1. INTRODUCTION
Cavnic deposit [1] belongs to Baia-Mare metallogenetic district, which is
located in the eastern part of the Carpathian belt, one of Europe’s major
metallogenic provinces, extending from Slovakia, Hungary and Ukraine to
Romania and including important epithermal gold-polymetallic ore deposits. The
Baia-Mare district, with about 15 mines, provides most of Romania’s lead and zinc
and some gold, silver, copper and antimony [2]. The Cavnic deposit – see Figure 1
- is a polymetallic deposit with local Au–Ag enrichments (generally in the upper
part of the system) which were selectively mined out in the past. The Cavnic
deposit has a long history of mining, probably beginning in Roman times, but the
most intense exploitation has occurred during the last 50 years. The deposit has
current reserves of 20 million tons of ore with grades of 1 g/t Au, 30 g/t Ag, 1–2%
Pb, 1–3% Zn, and 1% Cu [2].
*
Paper presented at the 12th International Balkan Workshop on Applied Physics, July 6–8,
2011, Constanta, Romania.
Rom. Journ. Phys., Vol. 57, Nos. 3–4, P. 594–606, Bucharest, 2012
2
Micro-pixe and XRF studies on native gold from cavnic ore deposit (Baia Mare district)
595
Fig. 1 – Simplified geological map of the Baia Mare district, with the location
of the major epithermal deposits [3].
Fig. 2 – Gold samples from Cavnic deposit, Roata mine.
In the frame of our gold archaeometallurgy project – Dacian gold artifacts
provenance – PN 91-029, we studied some geological native gold samples from
Cavnic deposit - Roata mine – see Figure 2 - which, together with Boldut mine, are
596
Daniela Cristea-Stan et al.
3
the most important mining units of Cavnic deposit. The purpose of this study is to
chemically characterize the Cavnic gold and to compare it with the archaeological
gold of Prehistoric and Dacian objects found in Northern Transylvania.
This study was conducted on a total of five samples of native gold (electrum)
using two methods based on X-ray elemental analysis:
– XRF (X-Ray Fluorescence) excited by an X-ray tube - using the X-MET
TX3000 portable spectrometer at IFIN-HH
– micro-PIXE (micro Proton Induced X-ray Emission) at AN2000 accelerator
of Laboratori Nazionali di Legnaro (LNL), INFN, Italy and at AGLAE accelerator
of CNRS-Musee du Louvre, Paris, France
to obtain information on:
– electrum structure - values of ratio Ag/(Au + Ag)
– presence of gold and silver minerals (tellurides, antimony compounds) –
mainly as inclusions
– presence of gold associated minerals – gangue (pyrite, arsenopyrite,
sphalerite, galena, quartz, etc.)
2. EXPERIMENTAL
The XRF and micro-PIXE methods require no sample preparation (the
samples can be measured practically in any shape delivered), which is their major
advantage in such studies. For the X-MET TX3000 portable spectrometer, the
exciting X-ray beam is generated by a 40 kV – Rh anode tube. The detection
system is a PIN silicon diode detector with Peltier cooling. The resolution of the
detector is 270 eV for the Kα line of Mn (5.89 keV). The measurement spot size is
about 30 mm2. The spectrometer has a Hewlett-Packard (HP) iPAQ personal data
assistant (PDA) for software management and data storage [4].
For micro-PIXE at AN2000 accelerator of Laboratori Nazionali di Legnaro
(LNL), INFN, Italy, a 2 MeV proton microbeam (6 µm x 6 µm beam area),
maximum beam current ~1000 pA was used [5]. The characteristic X-rays were
measured with a Canberra HPGe detector (180 eV FWHM at 5.9 keV). An Al
funny filter (80 µm thick and 8% hole) in front of the X-ray detector was used to
reduce the intensity of the peaks in the low spectral region (below 4 keV). 2 mm x
2 mm maps and point spectra were acquired. The quantitative analysis was
performed using the GUPIXWIN software [6].
At AGLAE accelerator of CNRS-Musee du Louvre, Paris, France, the
experiment was carried out with a 3 MeV proton microbeam, roughly 50 µm
diameter, extracted into air. Only point measurements (no scanning) were made.
The X-ray spectra were acquired for a fixed dose, corresponding to an irradiation
with a 10 nA beam current for about 15 minutes. For the characteristic X-rays
acquisition, two Si(Li) detectors were used: low-energy (1-10 keV) - for the
determination of matrix elements (Au, Ag, Cu) and high-energy (5-40 keV) - for
trace-elements (Sn, Sb, Te) determination. To reduce the high contribution of Au L
4
Micro-pixe and XRF studies on native gold from cavnic ore deposit (Baia Mare district)
597
X-ray lines in the X-ray spectra and the sum peaks interfering with the signals of
elements neighboring Ag K X-ray lines, the measurements were performed using a
75 µm Cu filter in front of the high-energy Si(Li) detector. The elemental
concentrations were obtained by processing the spectra with GUPIXWIN code.
Specifically, the quantification was performed in two steps, using a link to a socalled pivot element (Ag) appearing both in low- and high-energy spectra. In the
first step, the major constituents of the samples were derived from the low-energy
spectrum; their concentrations were constrained to sum up to 100%. In the second
step, the high-energy spectrum was processed with Ag as an internal standard and
using the matrix determined in the first step. This very reliable procedure, totally
independent of geometrical factors and the accumulated beam charge, was checked
by analyzing two gold standards from Comptoir Lyon Allemand Louyot & Co.,
namely standard 6917 (76% Au, 17% Ag and 6% Cu) and standard 6905 (75% Au,
6% Ag, 19% Cu) [7].
3. RESULTS AND DISCUSSIONS
A preliminary investigation on the samples was performed by XRF using
X-MET TX3000 portable spectrometer - in the laboratory of archaeometry at IFINHH, measuring in different areas (about 30 mm2) for each sample to observe
differences in composition from one area to another - see Table 1.
The most important results are:
– the ratio Ag/(Au/Ag) varies from 0.31 to 0.50, which means a high-silver
electrum, practically similar to Rosia Montana and Musariu gold from Metaliferi
Mts. [8].
– the presence of arsenopyrite (FeSAs) in all the samples – see Figure 3.
– the strong presence of wurtzite (Zn,Fe)S and sphalerite (ZnS) in sample 4
– the appearance of traces of Sb and Te in samples Cavnic-Roata 1 and 2 –
see Figure 3.
Table 1
Elemental composition of gold samples obtained by XRF
Sample Name
Area No.
Au%
Ag%
Fe%
Mn%
As%
Pb%
Cu%
Cavnic-Roata 1
1.1
36.5
18.7
41.8
1.4
1.2
> 0.05
> 0.05
1.2
40.3
18.2
37
1.7
2
0.1
> 0.05
Cavnic-Roata 2
Cavnic-Roata 3
2.1
62.3
31
5.7
0.1
0.7
0
0.1
3.1
48.3
24.6
22.7
3.8
0
0.5
> 0.05
2.2
55.2
28.3
14.7
0.7
0.7
0
0.05
3.2
62.3
32
4.8
0.3
0.6
0
> 0.05
598
Daniela Cristea-Stan et al.
5
Table 1 (continued)
Cr%
Sb%
Te%
Zn%
0.1
0.05
0.05
0
0.1
0.05
0.05
0
0.1
0.1
0.1
0
0.1
0.1
0.1
0
Sample Name
Area No.
Au%
Ag%
Fe%
Mn%
As%
Pb%
Cu%
Cr%
Sb%
Te%
Zn%
4.1
8.6
2.3
7.9
0.9
0.6
0.7
0
0.1
0
0
78.8
Cavnic-Roata 4
4.2
4.3
13.9
46.5
12.4
24.5
19.2
12.3
4.1
2.9
0
0.4
1.9
1.9
0.05
0.05
0.3
0.4
0
0
0
0.05
41.1
9.6
4.4
38.8
39.5
8.4
0.2
5.2
1
0.05
0.1
0
0
8.2
0.05
0
0
0
0.2
0.1
0.1
0
Cavnic-Roata 5
5.1
5.2
65
35.9
27.3
54.7
3.1
9.4
0.6
0
0.3
0
> 0.05 > 0.05
0.1
0.1
0.1
0.1
0
0
0
0
3.7
0.1
Fig. 3 – Cavnic-Roata 2; C2-2 XRF spectrum.
Using micro-PIXE at LNL AN2000 accelerator we concentrated on gold
associated minerals (gangue) identification (the energy of 2 MeV for protons it is
not enough to detect trace elements in Z=50 region). The most relevant are the
maps spectra (2 mm x 2 mm) – see below.
6
Micro-pixe and XRF studies on native gold from cavnic ore deposit (Baia Mare district)
Au
Ag
Fe
Si
500 µm
500 µm
500 µm
As
Mn
500 µm
500 µm
599
500 µm
Fig. 4 – Cavnic-Roata 2 maps.
For sample Cavnic-Roata 2, we observed the complementary presence of
electrum (Au+Ag) and arsenopyrite (FeSAs), a relatively homogeneous
background of quartz (SiO2) and a contribution from a manganese compound.
Au
Ag
Pb
500 µm
500 µm
500 µm
500 µm
Fe
Ca
Mn
500 µm
Fig. 5 – Cavnic-Roata 3 maps.
500 µm
600
Daniela Cristea-Stan et al.
7
For sample Cavnic-Roata 3 we observed, besides the normal presence of
electrum (Au+Ag), areas with pyrite (FeS2), small grains of galena (PbS) and a
contribution from manganocalcite (Ca,Mn)CO3.
Fig. 6 – Cavnic-Roata 3, Point spectrum.
For sample Cavnic-Roata 3 we performed a point spectrum (6 µm × 6 µm)
(see Figure 6) where, besides arsenopyrite, manganocalcite, traces of galena, we
detected the presence of Sb and Te.
To investigate gold and silver minerals - tellurides and antimony compounds,
the most interesting samples - no. 2, 3, 4 – were also analyzed by micro-PIXE
using a 3 MeV proton beam at AGLAE accelerator (3 MeV it is an adequate
energy to have a good sensitivity for Sb and Te detection).
Table 2
Samples analyzed by micro-PIXE using AGLAE accelerator
Cavnic-Roata
S %
2-11
4.735
2-12
3-11
3-13
1.2089
0.3832
0.734
K %
1.4682
0
0.6409
0
Ca %
3.2728
0.2136
11.4673
2.3856
Mn %
0.8086
0.0738
1.3508
0.1274
Fe %
1.7359
0.9574
3.8343
0.823
Zn %
0.0344
0
0
0
8
Micro-pixe and XRF studies on native gold from cavnic ore deposit (Baia Mare district)
601
Table 2 (continued)
As %
2.9145
0.0332
0.0239
0
Au %
50.0562
69.0568
57.1013
66.4814
Ag %
32.7513
28.1396
25.1133
29.3415
Sb ppm
2861
325
101
102
Te ppm
Ratio
Ag/(Au+Ag)
16657
1695
74
227
0.395
0.289
0.240
0.333
Cavnic-Roata
4-A1
4-A3
4-B1
4-B2
S %
1.6782
0.8897
1.8967
0.9693
K %
0.3403
1.138
4.201
0
Ca %
1.911
21.3406
11.9185
0.2801
Mn %
0.1309
2.461
1.853
0.0205
Fe %
0.9059
7.0992
4.3189
0.0681
Zn %
0.1566
1.3942
0.6048
0.0378
As %
0.8057
0.2086
0.1956
0
Au %
60.7409
49.0031
49.1642
76.5956
Ag %
29.8797
15.7948
16.1104
21.811
Sb ppm
1830
228
0
49
Te ppm
Ratio
Ag/(Au+Ag)
54131
1682
219
0
0.329
0.242
0.246
0.221
We analyzed “points” (areas of approx. 50 microns diameter) located in
various regions of the samples. The study was focused on Sb and Te presence and
on the variation of Ag/(Au+Ag) ratio values which characterize electrum’s
metallogeny (geological provenance) [9].
The point 2-11 from the sample Cavnic-Roata 2 (see Figures 7 a, b) revealed
an important presence of tellurium (Te=16657 ppm of the area’s total
composition), a significant presence of antimony (Sb=2861 ppm) and an increase
of silver content (Ag=32.75% versus Au =50.05%), indicating the presence of a
silver telluride containing also antimony. The high arsenic content (As=6.64%)
could indicate benleonardite - Ag8(Sb,As)Te2S3 highlighted in Kremnica, Slovakia
[10] – also in Northern Carpathians Mts. We can not exclude the presence of a
krennerite - (Au, Ag)Te2 enriched in antimony, as revealed in Sacaramb, Metaliferi
Mts. [11].
602
Daniela Cristea-Stan et al.
Fig. 7 a – Cavnic-Roata 2, spectrum C2-11 - without filter.
Fig. 7 b – Cavnic-Roata 2, spectrum C2-11- Cu filter.
9
10
Micro-pixe and XRF studies on native gold from cavnic ore deposit (Baia Mare district)
603
The point C4-A1 from the sample Cavnic-Roata 4 (see Figures 8 a, b) also
contains a important quantity of silver telluride (Te=54131 ppm) and a significant
presence of antimony (Sb=1830 ppm).
Fig. 8 a - Cavnic-Roata 4, spectrum C4-A1- without filter.
Fig. 8 b – Cavnic-Roata 4, spectrum C4-A1 Cu filter.
604
Daniela Cristea-Stan et al.
11
The existence of benleonardite and of a krennerite enriched in antimony, as
discussed above for sample Cavnic-Roata 2, must be considered. The same
structure, at a lower scale is repeated also for point C4-A3.
In table 2 we also observe the strong presence of calcium in points C4-A3,
C4-B1, which correlated with the presence of Mn and Fe suggests the existence of
rhodonite (Mn,Fe,Ca)SiO3. A relevant presence of sphalerite (ZnS) is observed for
point 4-A3.
So far, for Baia Mare geological district, tellurides are mentioned only in
[12,13,14]. In [12] Butucescu et al mention traces of hessite (Ag2Te), sylvanite
(Au, Ag)2 Te4 and petzite (Ag3AuTe2) at Nistru (North – West of Baia Mare – see
Figure 1). In [13] Istvan et al note the presence of petzite and calaverite (AuTe2) in
Suior (North-West of Cavnic) and of an unspecified gold and silver telluride at
Cavnic-Roata, observed only by optical microscopy, which is not sufficient for a
real identification of a mineral. In [14] Plotinskaya et al highlighted by electronic
microprobe altaite (PbTe) in a Cavnic-Boldut ore; we have not detected Pb in our
samples, so, our telluride certainly is not altaite. To definitely identify the
telluride(s) in our samples we intend to perform a micro-mineralogical study
together with our colleagues from the Faculty of Geology - Bucharest University.
As concerning the Ag/(Au+Ag) ratio, it varies from 0.221 to 0.395 - see
Table 2. For point C2-11 and C4-A1 the values are overestimated, because the Xrays detected from silver do not come only from electrum, but also from the
telluride(s). We can consider an average value of 0.27 for all our samples, but big
differences remain strong from point to point illustrating electrum’s
inhomogeneities. Ratio values are significantly lower than those given in [9] for
Cavnic-Boldut - between 0.47 and 0.53, but approaching over Nistru data - 0.25 or
rather Herja - 0.36. For Rosia Montana polished sample in [8] the range of ratio
values is between 0.21 and 0.23. An interpretation in terms of electrum
metallogeny will be performed together with the geologists.
As concerning the provenance of gold from Bronze Age and Dacian
archaeological objects found in Northern Transylvania there is only one
compositional analysis for Malaia Kopanya (North of Sighet, in Ukraine) Dacian
treasure [15]: Au=92%, Ag=7%, traces of Cu, traces of Fe. This pattern is specific
for alluvial gold and very different from Cavnic native gold (electrum with high
silver content). With the help of our colleagues archaeologists, we intend to
measure the Bronze Age gold items found in Oarta de Sus, Seini, Lapus (SouthWest of Baia-Mare) to verify if native gold from Cavnic was used to produce them.
4. CONCLUSIONS
Analytical techniques based on quantitative characteristic X-rays
measurements – such as X-Ray Fluorescence and micro-PIXE, together with
classical geological investigations based on optical and electronic microscopy -
12
Micro-pixe and XRF studies on native gold from cavnic ore deposit (Baia Mare district)
605
give the opportunity to perform a complete geochemical characterization of
geological gold samples. They can be successfully applied especially to provide
answers regarding the identification of specific trace elements (Sb, Te, Sn, Pb, etc.)
for each gold deposit.
The most important mineralogical results using our X-Ray based methods
obtained on the Cavnic-Roata mine samples are:
– he identification of a silver telluride rich in antimony: benleonardite Ag8(Sb,As)Te2S3 or krennerite - (Au, Ag)Te2; to definitely identify the telluride(s)
in our samples we intend to perform a micro-mineralogical study together with our
colleagues from the Faculty of Geology - Bucharest University.
– the Ag/(Au+Ag) ratio varies from 0.221 to 0.395, values significantly lower
than those for Cavnic-Boldut - between 0.47 and 0.53, but approaching over Nistru
data - 0.25 or rather Herja - 0.36 (for Rosia Montana polished sample the range of
ratio values is between 0.21 and 0.23); an interpretation in terms of electrum
metallogeny will be performed together with the geologists.
Our results demonstrate the important role of X-ray Fluorescence and microPIXE elemental analysis in interdisciplinary studies for mineralogical
characterization of Romanian native gold in relation with provenance research on
archaeological gold items from our museums.
Acknowledgements: Geologist Dr. Andrei Gorduza from Mineralogy Museum, Baia Mare for
Cavnic gold samples. Financial support of Romanian National Scientific Research Agency ANCS
grant PN2-91-029 “ROMARCHAEOMET”, of TARI – INFN, LNL-Legnaro and of European Union
“CHARISMA “ project are gratefully acknowledged.
REFERENCES
1. Gh.C. Popescu, Metalogenie aplicată şi prognoză geologică. Partea a II‑a, Editura Universitatii
Bucuresti, (1986) (in Romanian).
2. L. Grancea, L. Bailly, J. Leroy, D. Banks, E. Marcoux, J. P. Milesi, M. Cuney, A. S. Andre,
D. Istvan, C. Fabre, Mineralium Deposita 37, 630–647 (2002).
3. R. Crahmaliuc, J. Andrei, A. Crahmaliuc, Rom. J. Stratigr. 76(7), 63–64 (1995).
4. B. Constantinescu, C. Pauna, A. Vasilescu, F. Constantin, D. Stan, Gh. C. Popescu, A. Neacsu,
Romanian Reports in Physics, 62(1), 47–56 (2010).
5. P. Boccaccio, D. Bollini, D. Ceccato, G. Egeni, P. Rossi, V. Rudello, M. Viviani, Nucl. Instr. and
Meth. in Phys. Res. B 109, 94–98 (1996).
6. J. A. Maxwell, L. A. Campbell, W. Teesdale, Nucl. Instr. and Meth. in Phys. Res. B 43, 218–225
(1989).
7. R. Bugoi, V. Cojocaru, B. Constantinescu, T. Calligaro, L. Pichon, S. Roehrs, J. Salomon, Nucl.
Instr. and Meth. in Phys. Res. B 562, 2316–2319, (2008).
8. A. Neacşu, Gh. C. Popescu, B. Constantinescu, A. Vasilescu, D. Ceccato, Carpathian Journal of
Earth and Enviromental Sciences 4(1), 49–59 (2009).
9. M. Shimizu, M. Shimizu, G. Cioflica, R. Jude, M. Lupulescu, I. Berbeleac, I. Kovacs, in Mineral
Deposits at the Beginning of the 21st Century, Swets & Zeitlinger Publishers Lisse, 816–821
(2001).
606
Daniela Cristea-Stan et al.
13
10. G. Udubasa, S. Szakall, R. Duda, V. Kvasnytsya, E. Koszowska, M. Novak, Mineral of the
Carpathians, Granit Publishers, Prague (2002).
11. M. Shimizu, M. (Marina) Shimizu, G. Cioflica, H. Shimazaki, M. Kovacs, M. Lupulescu, G.S.
Petrusan, M. Feigel, G. Popa, I. Refec, I. Panzan, Analele Univ. Bucuresti, Geologie 48(101)
(1999)
12. N. Butucescu, L. Bonea, A. Botnarencu, G. Stoicescu, F. Stoicescu, Revista Minelor 14(5), 214–22.
(1963) (in Romanian).
13. D. Istvan, I. Virsescu, S. Halga, L. Grancea, Studia Universitatis Babes-Bolyai, Geol XL(1), 195–210
(1995).
14. O. Y. Plotinskaya, F. Damian, V. Y. Prokofiev, V. A. Kovalenker, Gh. Damian, Carpathian
Journal of Earth and Enviromental Sciences 4(2), 89–100 (2009).
15. E. Oberländer-Tarnoveanu, K. Parvan, G. Niculescu, B. Constantinescu, D. Stan, C. Păuna,
National Symposium on Archaeometry, October 28–29, Bucharest (2010).
© Copyright 2026 Paperzz