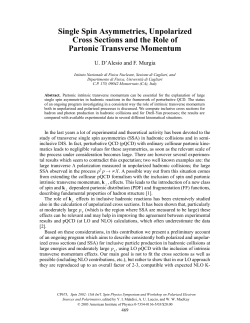
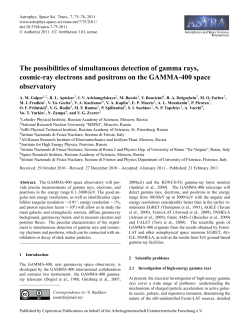
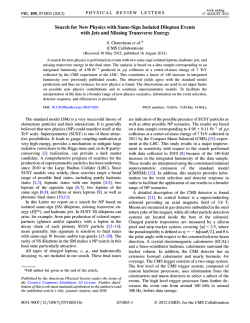
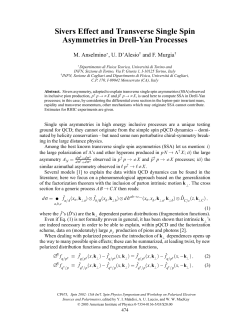
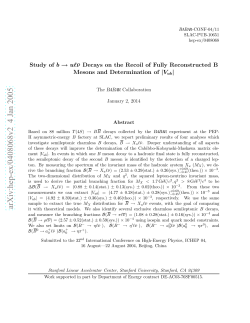
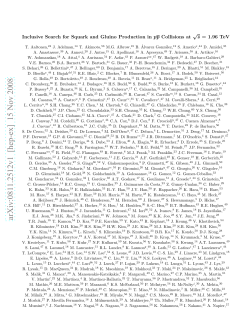
THE ASTROPHYSICAL JOURNAL, 457 : L103–L106, 1996 February 1
q 1996. The American Astronomical Society. All rights reserved. Printed in U.S.A.
MEASUREMENT OF THE POSITRON TO ELECTRON RATIO IN THE COSMIC RAYS ABOVE 5 GeV
R. L. GOLDEN 1
AND
S. J. STOCHAJ
Box 3-PAL, New Mexico State University, Las Cruces, NM 88003
S. A. STEPHENS
Tata Institute of Fundamental Research, Bombay 400 005, India
F. AVERSA, G. BARBIELLINI, M. BOEZIO, U. BRAVAR, A. COLAVITA, F. FRATNIK, P. SCHIAVON, A. VACCHI,
AND
N. ZAMPA
Dipartimento di Fisica dell’Università and Sezione Istituto Nazionale Fisica Nucleare di Trieste, Via A. Valerio 2, I-34147 Trieste, Italy
J. W. MITCHELL, J. F. ORMES,
AND
R. E. STREITMATTER
Code 661, NASA/Goddard Space Flight Center, Greenbelt, MD 20771
R. BELLOTTI, F. CAFAGNA, M. CASTELLANO, M. CIRCELLA, G. DE CATALDO, C. DE MARZO,
N. GIGLIETTO, B. MARANGELLI, A. RAINÒ, AND P. SPINELLI
Dipartimento di Fisica dell’Università and Sezione Istituto Nazionale Fisica Nucleare di Bari, Via Amendola 173, I-70126 Bari, Italy
M. BOCCIOLINI, N. FINETTI, 2 P. PAPINI, A. PEREGO, S. PICCARDI,
AND
P. SPILLANTINI
Dipartimento di Fisica dell’Università and Sezione Istituto Nazionale Fisica Nucleare di Firenze, Largo Enrico Fermi 2, I-50125 Firenze, Italy
G. BASINI, F. MASSIMO BRANCACCIO, 3
AND
M. RICCI
Laboratori Nazionali Istituto Nazionale Fisica Nucleare, Via Enrico Fermi 40, CP 13, I-00044 Frascati, Italy
M. T. BRUNETTI, A. CODINO, C. GRIMANI,
AND
M. MENICHELLI
Dipartimento di Fisica dell’Università and Sezione Istituto Nazionale Fisica Nucleare di Perugia, Via Pascoli, I-06100 Perugia, Italy
V. BIDOLI, M. CANDUSSO, M. CASOLINO, M. P. DE PASCALE, A. MORSELLI, P. PICOZZA,
AND
R. SPARVOLI
Dipartimento di Fisica dell’Università and Sezione Istituto Nazionale Fisica Nucleare di Roma, Tor Vergata, Via della Ricerca Scientifica 1, I-00133 Roma, Italy
AND
M. HOF, W. MENN,
AND
M. SIMON
Siegen University, 57068, Siegen, Germany
Received 1995 August 3; accepted 1995 November 17
ABSTRACT
As part of a series of experiments to search for antimatter in cosmic rays, the New Mexico State University
balloon-borne magnet spectrometer was configured for a flight to study positrons. Two completely new
instruments, a transition radiation detector and a silicon-tungsten imaging calorimeter, were added to the magnet
spectrometer. These two detectors provided a proton rejection factor better than 3 3 10 4 . This instrument was
flown from Fort Sumner, New Mexico, at an average depth of 4.5 g cm 22 of residual atmosphere for a period of
25 hr. We report here the measured fraction of positrons e 1 /(e 1 1 e 2 ) from 15 to 60 GeV at the top of the
atmosphere. Our measurements do not show any compelling evidence for an increase in this ratio with energy,
and our results are consistent with a constant fraction of 0.078 H 0.016 over the entire energy region.
Subject headings: cosmic rays — elementary particles
Muller & Tang 1987). This increase cannot be explained by the
known propagation theories, but rather it requires a new
source of positrons. Several theories have explored the idea of
primary sources for positrons. At the same time, attempts have
been made to confirm these positron observations with improved detector systems. The unambiguous detection of
positrons is difficult because of the vast background of protons.
In this Letter we briefly describe a recent measurement of the
positron fraction above 5 GeV using a balloon-borne magnet
spectrometer with an improved detector systems.
1. INTRODUCTION
Although the electron component constitutes less than 1%
of the cosmic rays, it plays an important role in understanding
the propagation of cosmic rays in the Galaxy. This is because
electrons undergo severe energy loss through inverse-Compton scattering with the ambient photons and synchrotron
radiation in the magnetic field. The astrophysical importance
of positrons stems from their intimate relationship with the
radio and gamma-ray background in the Galaxy. The observed
positron-to-electron ratio of 110% shows that positrons are
indeed a rare component of cosmic rays. Furthermore, previous observations have shown that their fraction appears to
increase above 5 GeV (see, e.g., Golden et al. 1987, 1994;
2. DETECTOR SYSTEM
Figure 1 shows the schematic diagram of the TS93 apparatus that was flown by balloon from Fort Sumner on 1993
September 8 at a constant altitude of 36 km for 25 hr. This
instrument consisted of the following detector elements.
Deceased.
Now at Dipartimento di Fisica dell’Università and Sezione INFN di
Perugia, Via Pascoli, I-06100 Perugia, Italy.
3 Now at Sezione INFN di Firenze, Largo Enrico Fermi 2, I-50125 Firenze,
Italy.
1
2
1. A superconducting magnet spectrometer with multiwire
proportional chambers (MWPC) and drift chambers (Golden
L103
L104
GOLDEN ET AL.
FIG. 1.—Schematic diagram of the TS93 apparatus
et al. 1991; Hof et al. 1994) was used to measure the curvature
of the particles with an estimated average maximum detectable rigidity of 200 GV c 21 .
2. A transition radiation detector (TRD) was positioned
above the spectrometer. The TRD consisted of 10 layers of
carbon fiber radiators, each followed by a MWPC. The signal
from each wire of the MWPC was analyzed with cluster
counting capability (Barbarito et al. 1992; Bellotti et al. 1992,
1993). The TRD was used as a threshold detector for the
estimate of the particle velocity (Lorentz factor).
3. A set of plastic scintillators was placed at the upper and
lower extremes of the spectrometer, providing the basic trigger
for the experiment. Time-of-flight (TOF) information from
these paddles was used to distinguish upward-moving particles
from downward with a resolution of 400 ps over 1.4 m flight
path. Pulse height information was used as a measure of the
particle’s ionization losses.
4. A silicon-tungsten imaging calorimeter was kept at the
bottom of the detector system. This consisted of five sets of
silicon planes, giving both x- and y-coordinates readouts. Each
set of readout planes was interleaved with a plane of tungsten,
one radiation length thick (Aversa et al. 1993, 1995).
3. DATA ANALYSIS
We required a well-defined single track in the spectrometer
with a good momentum resolution, characterized by acceptable chi-squares and small uncertainty in deflection. Then,
using the ionization measurements from the TOF scintillators,
we identified minimum ionizing particles with I , 3.0I 0 , where
I 0 is the most probable scintillator output for a minimum
ionizing singly charged particle.
Downward-moving events with negative curvature were
selected, and those having electromagnetic shower in the
calorimeter were classified as e 2 events. These events contained a very small fraction of locally produced pions at very
low energies. We observed a total of 1033 electrons above 1
GeV, of which 317 were in the 6 –50 GeV range.
Vol. 457
The selected e 2 events were then used to develop selection
criteria for the calorimeter to define a pure electromagnetic
cascade. These criteria were also studied using Monte Carlo
simulations (Brun et al. 1994), the results of which were
previously tested using accelerator data (Bocciolini et al.
1993a, 1993b). They include longitudinal and lateral profiles of
pure electromagnetic cascades, total deposited energy, and the
energy flow along a well-defined core of the cascade. The loss
of events resulting from the application of these criteria was
then determined by using e 2 events, which were selected by the
TRD. It was found that the efficiency of the calorimeter, with
these selection criteria, was independent of energy in the
range 1–50 GeV and was 0.79 H 0.02. When these cuts were
imposed on the positively charged particles, we achieved a
mean proton rejection factor of 455 H 21 above 4 GeV that
was found to be nearly independent of energy from 4 to 50
GeV. The rejection factor slowly decreased below 4 GeV to
1178 H 24 at 1.5 GeV. However, the observed ratio of protons
to positrons below the geomagnetic cutoff also decreased by a
factor of 125 over this same energy interval. Therefore, the
contamination by particles not accompanied by an electromagnetic cascades remains very small over the entire energy range
from 1 to 50 GeV.
The TRD selection criteria were based on the sum of the
hits in the MWPC along the track and the number of such
planes, activated during the passage of the event. These
criteria were earlier studied using accelerator beams (Barbarito et al. 1992; Bellotti et al. 1992, 1993). By applying these
criteria to the e 2 events, which were selected by the calorimeter, we estimated the efficiency of the TRD to be 0.69 H 0.02
above 3 GeV. Below 3 GeV, this efficiency dropped to
0.60 H 0.03. By applying these criteria to positively charged
particles, we found that the proton rejection factor by the
TRD was 76.9 H 2.4. It may be noted that the velocity
measurements using TOF scintillators also provided an effective rejection of protons of rigidity less than 2 GV c 21 .
4. RESULTS
We have shown in Table 1 the observed number of e 2 and
e 1 events that passed both the calorimeter and TRD cuts. The
energy intervals shown were measured at the spectrometer.
Since the proton rejection power of the instrument was not
100%, we expect that the selected positron sample would
contain a few proton events. In order to estimate this contamination, we first constructed the proton spectrum using the
flight data. The observed proton spectrum was then divided by
the proton rejection factor to estimate this proton contamination. In Table 1 the estimated residual protons are shown in
parentheses along with the positron number. As we do not
have the absolute efficiencies resulting from the spectrometer
cuts used in this analysis, we estimated the atmospheric
secondaries in the following manner. We first constructed the
differential spectra for both electrons and positrons from 1 to
50 GeV. These spectra were corrected for the TRD efficiency
and then propagated to the top of the payload through the
material above the spectrometer using the bremsstrahlung
process. These extrapolated flux values are plotted as a
function of energy in Figure 2. One can clearly notice from this
figure the effect of the geomagnetic cutoff below 16 GeV. The
total electron spectrum above 6 GeV is consistent with a
simple power law having a spectral index of 23.3, as obtained
from earlier measurements (Golden et al. 1984, 1987). The
No. 2, 1996
POSITRON TO ELECTRON RATIO IN COSMIC RAYS
L105
TABLE 1
SUMMARY
OF
OBSERVED
NUMBER OF
EVENTS a
ELECTRON–POSITRON RESULTS
ENERGY BIN AT
SPECTROMETER (GeV )
(1)
e 2 (2)
e 1 (3)
MEDIAN
ENERGY AT
TOA (4)
4.0–5.0 . . . . . . . . . . . . . . . . .
5.0–7.0 . . . . . . . . . . . . . . . . .
7.0–11. . . . . . . . . . . . . . . . . .
11–50 . . . . . . . . . . . . . . . . . .
109
165
97
56
14 (0.9)
17 (1.5)
11 (1.3)
10 (1.3)
5.71
7.49
10.8
22.0
a
CORRECTED NUMBER
TOA
AT
e 2 (5)
e 1 (6)
[e 1 /(e 1 1 e 2 )]
(7)
129.0 H 12.6
163.6 H 13.0
78.4 H 8.08
40.5 H 5.70
11.50 H 4.0
11.56 H 3.54
6.57 H 2.47
5.01 H 2.25
0.082 H 0.027
0.066 H 0.019
0.077 H 0.028
0.110 H 0.046
The numbers shown in the parentheses are the residual proton contamination.
marked increase at low energies is due to secondary electrons
produced by hadron interactions in the atmosphere. This part
of the spectrum was used as a guide to correct for the
secondaries produced in the overlying atmosphere above the
cutoff energy.
The solid and dashed curves shown in Figure 2 are, respectively, the e 1 and e 2 spectra of secondary electrons produced
by the interactions of cosmic-ray nuclei in the overlying
atmosphere (Stephens 1981). This expected secondary
positron spectrum was normalized to the observed spectrum
below 3 GeV. We noticed that the secondary spectra are not a
simple power-law spectra over the entire energy region. This is
due to the varying contribution from the decay of charged and
neutral pions in the atmosphere. It can also be seen that while
the e 1 spectrum below the geomagnetic cutoff appears to be
dominated by the secondaries, the e 2 spectrum is not. In order
to understand this difference, we examined the effect of the
propagation of primary electrons in the following manner. We
assumed the primary e 2 and e 1 above 6 GeV to have the same
spectra as in Figure 2 at the top of the atmosphere (TOA). To
get the spectral shape below this energy, we normalized at 6
GeV the observed rigidity spectrum of helium nuclei, which
was obtained from this experiment. This procedure provides
the best method to take care of the effect of geomagnetic
cutoff and penumbral bands. We then propagated these spectra from the top of the atmosphere to the float altitude by
solving simultaneously the cascade equations, which describe
the propagation of all the electromagnetic components,
namely, primary e 2 , e 1 and secondary gamma rays. Note that
these gamma rays are produced by the electrons through the
bremsstrahlung process in the atmosphere. It was found that
the noticeable difference between the observed e 2 spectrum
below the cutoff and the secondary spectrum (dashed curve in
Fig. 2) can be explained as due to the slowing down of the
primary electrons. Because of the small atmospheric depth at
which the experiment was conducted, we also found from this
calculation that the contribution to e 1 from the cascading of
the dominant e 2 component was very small compared to the
secondaries produced by hadron interactions. Thus we are
very confident that the procedure adopted here is very reliable.
We have subtracted the expected number of secondary e 2
and e 1 in the extrapolated energy bins at the top of the
payload. While doing this, we included in the secondary
correction an uncertainty equivalent to 1 s of the observed e 1
flux values over the energy region where the normalization was
made. The remainder of the e 2 , e 1 , and calculated gamma rays
that were at the float altitude and above the geomagnetic
cutoff were propagated backward to the top of the atmosphere
by simultaneously solving the cascade equations. In Table 1,
we show the median energy and the corrected number of e 2
and e 1 in columns (4) to (6), respectively, at the TOA. The
errors include not only the statistics, but also those discussed
above. It may be pointed out that the extrapolated energy bins
at the TOA are based on the mean radiation loss over the total
amount of 10.24 radiation length of matter above the spectrometer, which includes both the material in the instrument
and the atmosphere. Column (7) in Table 1 gives the observed
fraction of e 1 at the top of the atmosphere. The values that we
have obtained are nearly constant over the first three intervals
from 5 to 14 GeV, producing a mean value of 0.074 H 0.016.
The last value, although higher, is consistent with those at
low-energy bins within 1 s. Therefore, combining all the bins,
we obtained a value of 0.078 H 0.016 for the fraction of
positrons among the electron component of cosmic rays in the
energy region from 5 to 63 GeV.
Figure 3 shows the fraction of positrons as observed by us
along with the other existing published data as a function of
energy from 1500 MeV to 60 GeV (Fanselow et al. 1969;
Buffington et al. 1975; Muller & Tang 1987; Golden et al. 1987,
1994; Barwick et al. 1995). It can be noted that the present
results are in agreement with the results obtained earlier using
the same magnet spectrometer with different detector systems.
It can also be seen that, except for the high-energy data points
from Buffington et al. (1975) and Muller & Tang (1987), there
FIG. 2.—Extrapolated positron and electron spectra at the top of the
payload. The solid and dashed curves are the secondary spectra produced by
the interactions of cosmic-ray nuclei in the atmosphere (Stephens 1981).
L106
GOLDEN ET AL.
is no compelling evidence for e 1 fraction to increase with
energy above 10 GeV, and the data points suggest a fraction
that is independent of energy, within errors, over the entire
energy range of the measurement. We have also shown in this
figure the expected fraction of e 1 from simple leaky box model
(Protheroe 1992) and the recent observations are not inconsistent with the predictions. It may be noted that the theoretical prediction is indeed an underestimation because the path
length used for the matter traversed by cosmic rays in the
Galaxy was smaller than what is known today. It may be
pointed out that our results do not exhibit the trend shown by
Barwick et al. (1995), in which the positron fraction decreases
with energy. However, the errors associated with the highenergy measurements in both experiments are too large to
claim a significant difference. It is very important to improve
the detection efficiency of the instrument and to extend the
measurements to lower and higher energies in a single experiment.
This work was supported by NASA grant NAGW-110,
The Istituto Nazionale di Fisica Nucleare, Italy, the Agenzia
Spaziale Italiana and DARA and DFG in Germany. We wish
to thank the National Scientific Balloon Facility and the NSBF
launch crew that served at Fort Sumner.
FIG. 3.—Positron fraction, [e 1 /(e 1 1 e 2 )], as observed in this experiment
compared with other published data and the simple leaky box model.
REFERENCES
Aversa, F., et al. 1993, Nucl. Instrum. Meth., A334, 589
———. 1995, Nucl. Instrum. Meth., A360, 17
Barbarito, E., et al. 1992, Nuclum. Instr. Meth., A313, 295
Barwick, S. W., et al. 1995, Phys. Rev. Lett., 75, 390
Bellotti, R., et al. 1992, Nucl. Instrum. Meth., A323, 295
———. 1993, in Proc. 23d Internat. Cosmic Ray Conf. (Calgary), 635
Bocciolini, M., et al. 1993a, Nucl. Instrum. Meth., A333, 77
———. 1993b, Nucl. Phys., 32, 77
Brun, R., et al. 1994, Detector Description and Simulation Tool, CERN
program library
Buffington, A., Orth, C. D., & Smooth, G. F. 1975, ApJ, 199, 669
Fanselow, J. L., Hartman, R. C., Hildebrand, R. H., & Meyer, P. 1969, ApJ,
158, 771
Golden, R. L., Mauger, B. G., Badhwar, G. D., Daniel, R. R., Lacy, J. L.,
Stephens, S. A., & Zipse, J. E. 1984, ApJ, 287, 622
Golden, R. L., Stephens, S. A., Mauger, B. G., Badhwar, G. D., Daniel, R. R.,
Horan, S., Lacy, J. L., & Zipse, J. E. 1987, A&A, 188, 145
———. 1991, Nucl. Instrum. Meth., A306, 366
———. 1994, ApJ, 436, 769
Hof, M., et al. 1994, Nucl. Instrum. Meth., A345, 561
Muller, D., & Tang, K. K. 1987, ApJ, 312, 183
Protheroe, R. J. 1982, ApJ, 254, 391
Stephens, S. A. 1981, Proc. 17th Internat. Cosmic Ray Conf. (Paris), Vol. 4, 282
© Copyright 2026 Paperzz