DISS. ETH NO. 18419
NOVEL TECHNOLOGICAL APPROACHES TO
ENHANCE STRESS TOLERANCE OF
BIFIDOBACTERIUM LONGUM NCC2705 CELLS
USING CONTINUOUS CULTURES
A dissertation submitted to
ETH ZURICH
for the degree of
Doctor of Sciences
presented by
VALERIA MOZZETTI
Dipl. Lm.-Ing. ETH
Date of birth
November 10th, 1980
citizen of
Vogorno,Ticino
accepted on the recommendation of
Prof. Dr. Christophe Lacroix
Prof. Dr. Leo Meile
Dr. Bernard Berger
2009
Table of contents
SUMMARY………………………………………………………………………...…….4
RIASSUNTO………………………………………………………………………...…..7
1
1.1
INTRODUCTION .........................................................................................10
Human microbiota of the gastro-intestinal tract ....................................................................... 10
1.2
Probiotics ...................................................................................................................................... 11
1.2.1
Definition .................................................................................................................................. 11
1.2.2
Criteria for selection of probiotics............................................................................................. 12
1.2.3
Beneficial effects of probiotics.................................................................................................. 14
1.3
Bifidobacteria ............................................................................................................................... 15
1.3.1
Family and genus Bifodobacteriaceae ...................................................................................... 15
1.3.2
Habitat ....................................................................................................................................... 15
1.3.3
Physiology ................................................................................................................................. 18
1.3.4
Bifidobacteria as probiotics....................................................................................................... 23
1.3.5
Pathogenesis of bifidobacteria................................................................................................... 26
1.4
Stress ............................................................................................................................................. 27
1.4.1
Stress response .......................................................................................................................... 28
1.4.2
Heat stress response................................................................................................................... 30
1.4.3
Osmotic stress response............................................................................................................. 32
1.4.4
Bile stress response ................................................................................................................... 33
1.4.5
Gastric conditions and low pH stress response.......................................................................... 34
1.4.6
Oxygen stress response.............................................................................................................. 35
1.5
Methods to improve cell viability................................................................................................ 36
1.5.1
Application of sublethal stresses to exploit stress response mechanisms to improve
technological performance of bifidobacteria ........................................................................................... 38
1.6
Fermentation basic principles ..................................................................................................... 39
1.6.1
Batch operation.......................................................................................................................... 39
1.6.2
Continuous operation ................................................................................................................ 40
1.6.3
Immobilized cells ...................................................................................................................... 41
1.7
Transcriptomics............................................................................................................................ 43
1.7.1
Microarray analysis ................................................................................................................... 44
1.7.2
Signal quantification and data filtering...................................................................................... 46
1.7.3
Normalization............................................................................................................................ 46
1.7.4
Data analysis ............................................................................................................................. 46
1.8
Thesis outline ................................................................................................................................ 48
2 PHYSIOLOGICAL STABILITY OF BIFIDOBACTERIUM LONGUM
NCC2705 UNDER CONTINUOUS CULTURE CONDITIONS ............................50
2.1
Abstract......................................................................................................................................... 50
1
2.2
Introduction .................................................................................................................................. 50
2.3
Material and methods .................................................................................................................. 52
2.3.1
Strain and growth conditions..................................................................................................... 52
2.3.2
Continuous culture experiment.................................................................................................. 52
2.3.3
Viable cell enumeration and viability assessment ..................................................................... 53
2.3.4
HPLC analysis........................................................................................................................... 54
2.3.5
Survival tests ............................................................................................................................. 54
2.3.6
Microarrays ............................................................................................................................... 56
2.3.7
Statistical analysis ..................................................................................................................... 58
2.4
Results ........................................................................................................................................... 59
2.4.1
Growth parameters and metabolism .......................................................................................... 59
2.4.2
Cell survival during stress tests ................................................................................................. 61
2.4.3
Transcriptomic analysis............................................................................................................. 63
2.5
Discussion...................................................................................................................................... 69
3 VALIDATION OF A NEW APPROACH FOR SCREENING OF SUBLETHAL
STRESS CONDITIONS IN A TWO-STAGE CONTINUOUS CULTURE WITH B.
LONGUM NCC2705 CELLS ..............................................................................74
3.1
Abstract......................................................................................................................................... 74
3.2
Introduction .................................................................................................................................. 76
3.3
Material and Methods.................................................................................................................. 78
3.3.1
Strain and growth conditions..................................................................................................... 78
3.3.2
Viable cell enumeration............................................................................................................. 78
3.3.3
Continuous culture experiment.................................................................................................. 78
3.3.4
Applications of stress pretreatments in continuous culture ....................................................... 80
3.3.5
Batch cultures ............................................................................................................................ 81
3.3.6
Lethal stress tests....................................................................................................................... 82
3.3.7
Carbohydrates analysis.............................................................................................................. 84
3.3.8
Statistical analysis ..................................................................................................................... 85
3.4
Results ........................................................................................................................................... 87
3.4.1
Continuous culture .................................................................................................................... 87
3.4.2
Batch culture ............................................................................................................................. 94
3.5
Discussion.................................................................................................................................... 102
4 NOVEL METHOD FOR SELECTION OF RESISTANT BIFIDOBACTERIA
CELLS TO HYDROGEN PEROXIDE USING CONTINUOUS CULTURE AND
IMMOBILIZED CELL TECHNOLOGY..............................................................106
4.1
Abstract....................................................................................................................................... 106
4.2
Introduction ................................................................................................................................ 108
4.3
Material and methods ................................................................................................................ 110
4.3.1
Strain ....................................................................................................................................... 110
4.3.2
Cell immobilization ................................................................................................................. 110
2
4.3.3
4.3.4
4.3.5
4.3.6
4.3.7
4.3.8
4.3.9
Continuous culture .................................................................................................................. 110
Viable cell enumeration in culture effluent and gel beads....................................................... 111
H2O2 resistance of cells from culture effluent ......................................................................... 112
Isolation of cells resistant to H2O2 ........................................................................................... 112
Characterization of H2O2 resistant isolates.............................................................................. 112
Microarray analysis ................................................................................................................. 114
Statistical analysis ................................................................................................................... 115
4.4
Results ......................................................................................................................................... 116
4.4.1
Continuous culture monitoring................................................................................................ 116
4.4.2
Selection of resistant cells and stability of H2O2 resistance phenotype ................................... 118
4.4.3
Growth in presence of oxygen in liquid shaking cultures ....................................................... 119
4.4.4
Growth in presence of H2O2 in reactors .................................................................................. 121
4.4.5
Genome-wide transcription analysis ....................................................................................... 121
4.5
5
Discussion.................................................................................................................................... 123
GENERAL CONCLUSIONS AND PERSPECTIVES.................................127
6 APPENDIX: GENOME WIDE EXPRESSION ANALYSIS OF CULTURE
SAMPLES PRODUCED WITH DIFFERENT TECHNOLOGIES ......................131
6.1
Introduction ................................................................................................................................ 131
6.2
Material and Methods................................................................................................................ 132
6.2.1
Strain and growth conditions................................................................................................... 132
6.2.2
Batch cultures .......................................................................................................................... 132
6.2.3
Continuous culture, substrates, metabolites and transcriptomic analyses ............................... 133
6.3
Results ......................................................................................................................................... 135
6.3.1
Comparison of continuously produced cells collected in reactor 1 and 2 ............................... 135
6.3.2
Comparison of continuously produced cells in reactor 2 with exponential and early-stationary
phase cells from batch culture ............................................................................................................... 136
6.4
7
Discussion.................................................................................................................................... 139
REFERENCES ..........................................................................................141
ACKNOWLEDGEMENTS ................................................................................164
CURRICULUM VITAE ......................................................................................165
3
Summary
The efficient delivery of live cultures in high concentrations at their site of action
represents a major challenge in probiotic product development. Application of probiotics
as food additives is hampered by their fastidious production and their sensitivity to
environmental stresses. Possibilities to produce more robust probiotics include exposition
of the cells to sublethal stresses during production, and isolation of resistant strains under
selective pressure. Based on the observation that continuous cultures have been used for
producing cells with constant physiology over time (Hoskisson and Hobbs 2005) and also
in combination with selective pressure for selection of resistant strains to antibiotics
(Noack et al. 1988; Butler et al. 1996), two hypotheses were tested in this dissertation.
First, that continuous culture could be used to produce cells with constant physiology
over time to efficiently screen for sublethal stresses. Secondly, that continuous culture in
combination with immobilized cell technology and selective pressure could be used for
selection of stress resistant strains.
The prerequisite for using continuous culture in stress screening is the physiological
stability of continuously produced cells. In Chapter 2, the potential of continuous culture
mode with conditions set to produce late exponential growth phase cells for screening of
sublethal stresses was assessed using Bifidobacterium longum NCC2705. Physiological
parameters as viable cell counts, production of metabolites, susceptibility to antibiotics,
and stress conditions showed either stable or only moderate changes over 211 h culturing
time. The comparison of gene transcription profiles between samples collected after 31 h
of continuous culturing, and those collected after 134 h, and 211 h revealed only limited
changes in expression profiles i.e., 1.0 and 3.8 % of total genes, respectively. These
minimal changes in time showed that continuous culture can be used to produce
physiological stable bacterial cells suitable for fast and efficient screening of sublethal
stress conditions.
In Chapter 3, a stable 2-stage continuous culture of B. longum NCC2705 was used for
fast screening of sublethal stresses and to test the effects of such stresses on cell survival
to lethal stresses. Different stress pretreatments of 42 min were tested in the second stage:
combinations of pH (6.0, 5.0 and 4.0), temperature (37, 45 and 47°C) and NaCl
concentration (0, 5 and 10%) were tested using a 3 by 3 factorial design. This 2-stage
4
continuous culture design allowed fast and efficient screening of several stress
pretreatments during the same culture experiment, up to four different stress
pretreatments tested per day with conditions of this study. Of all tested combinations,
only those with pH 4.0 significantly affected cell viability compared to control conditions
(37°C, pH 6.0, 0% NaCl), and thus could not be considered as sublethal stresses.
Pretreatments with 5 or 10% NaCl had a negative effect on cell viability after gastric
lethal stress. A significant improvement in cell resistance to a heat lethal stress (56°C, 5
min) was observed for cells pretreated at 47°C. In contrast, heat pretreatments negatively
affected cell viability after freeze drying and osmotic lethal stresses. Selected stress
pretreatments (pH 4.0; 47°C; 10% NaCl; 47°C+10% NaCl; and pH 4.0+10% NaCl)
applied to early stationary phase cells during batch cultures produced similar effects
compared to continuous culture, showing that continuous culture permits to select
sublethal stress conditions which can be then applied for traditional batch cultures.
Another possibility to produce more robust probiotics is by selection of resistant strains
during growth under selective pressure. Chapter 4 presents a new method to isolate
resistant strains to oxidative stress using continuous culture. Continuous culture with
selective pressure was combined with immobilized cell technology, which allowed to
achieve very high cell densities in the bioreactor of 1013 CFU l-1 without stress
application. The continuous culture gradually adapted to increasing H2O2 concentrations,
as shown by the optical density of culture effluent which dropped after each increase of
H2O2 concentration and then increased again. However, at day 9 after increasing the
H2O2 concentration to a high value of 130 ppm the OD of the culture decreased to 0. Full
wash out was prevented by immobilization of cells in gel beads. Hence after stopping the
stress, it was possible to re-grow the cells that survived the lethal level of H2O2 and to
isolate two adapted variants (HPR1 and HPR2). In contrast to HPR1, HPR2 showed
stable characteristics over at least 70 generations. HPR2 exhibited higher also tolerance
to O2 than non adapted wild type cells. Preliminary characterization showed that 2 genes
coding for a protein with unknown function possessing trans-membrane domains and an
ABC-type transporter protein were overexpressed in HPR2 cells. This study showed that
continuous culture with cell immobilization is a powerful approach for selecting cells
adapted to hydrogen peroxide.
5
In this dissertation, two novel approaches using continuous cultures for improving cell
robustness of probiotic microorganisms were designed and experimentally validated.
Continuous culture was successfully applied for screening sublethal stresses and, together
with immobilized cell technology and selective pressure, was used for selection of
Bifidobacterium cells resistant to oxidative stress. Our study opens new doors for
technological optimization of sensitive strains and their utilization in food products.
6
Riassunto
I probiotici sono dei microorganismi molto usati nell’industria alimentare, poiché quando
ingeriti in quantità adatte sono benefici alla salute (FAO/WHO 2002). Un efficiente
apporto di colture vive ad alta concentrazione nel loro luogo d’azione rappresenta una
delle maggiori sfide nello sviluppo di prodotti contenenti probiotici. Infatti, l’utilizzo di
probiotici come additivi alimentari è ostacolato dalla loro produzione esigente e dalla loro
sensibilità agli stress ambientali. Possibilità di produrre probiotici più robusti includono
l’esposizione delle cellule a stress sub-letali durante la produzione e l’isolamento di ceppi
genetici resistenti usando delle pressioni di selezione. La ricerca di stress sub-letali e
l’isolamento di ceppi genetici adatti richiedono tuttavia molto tempo. Le cosiddette
“colture continue” permettono di aumentare l’efficacità della ricerca poiché permettono
di produrre cellule con una fisiologia costante nel tempo (Hoskisson and Hobbs 2005).
Inoltre, in combinazione con una pressione di selezione adeguata, esse permettono per
esempio d’isolare ceppi resistenti agli antibiotici (Noack et al. 1988; Butler et al. 1996).
Basandosi su queste osservazioni, questa dissertazione di dottorato presenta l’esame di 2
ipotesi per l’uso delle colture continue di probiotici. La prima ipotesi postulò che la
coltura continua potesse essere usata per produrre cellule di probiotici con fisiologia
costante nel tempo per fare uno screening di stress sub-letali. La seconda fu che la coltura
continua in combinazione con la tecnologia di cellule immobilizzate e una pressione di
selezione potesse essere usata per isolare ceppi resistenti allo stress. Il prerequisito per
utilizzare la cultura continua per fare uno screening sugli stress è la stabilità fisiologica
delle cellule prodotte con questo sistema.
Dopo un’introduzione al tema, il secondo capitolo di questa dissertazione presenta la
verifica di questo prerequisito: il potenziale del metodo di coltura continua con parametri
scelti per produrre cellule alla fine della fase esponenziale di crescita per fare uno
screening di stress sub-letali è stato testato usando il batterio Bifidobacterium longum
NCC2705. Il risultato principale fu che i parametri fisiologici come il numero di cellule
vive, la produzione di metaboliti, la suscettibilità agli antibiotici e alle condizioni di stress
rimasero stabili o mostrarono solamente cambiamenti minori sulle 211 h di coltivazione.
Inoltre, il paragone tra i profili d’espressione genetica tra i campioni raccolti dopo 31 h di
coltura continua e quelli raccolti dopo 134 h e 211 h hanno rivelato solo lievi
7
cambiamenti nei profili d’espressione: solo, rispettivamente, 1.0 e 3.8 % del totale dei
geni espressi erano indotti o repressi. Questi cambiamenti minimi nel tempo mostrano
che la coltura continua può essere utilizzata per produrre cellule batteriche con fisiologia
stabile adatte per fare uno screening veloce ed efficiente sugli stress sub-letali.
Nel terzo capitolo della dissertazione viene descritta questa ricerca di stress sub-letali atti
a produrre bifidobatteri più robusti. Il primo di due stadi di un bioreattore permise di
mantenere una coltura continua di B. longum NCC2705. Questi, in seguito, vennero
sottoposti a diversi pretrattamenti di stress nel secondo stadio. L’efficacia di questo
trattamento venne stabilita misurando la sopravvivenza delle cellule a stress letali. I
pretrattamenti di stress consistevano in diverse combinazioni di pH (6.0, 5.0 e 4.0),
temperatura (37, 45 e 47°C) e concentrazione di NaCl (0, 5, e 10 %). Queste
combinazioni vennero applicate per 42 min usando uno schema fattoriale 3X3. La coltura
continua a 2 livelli ha permesso di fare uno screening in modo veloce ed efficiente
poiché, nelle condizioni usate in questo studio, fino a 4 pretrattamenti di stress potevano
essere testati per giorno sulla stessa coltura . Tra tutte le combinazioni testate, quelle con
pH 4.0 hanno influito sulla viabilità cellulare in paragone alle condizioni di controllo
(37°C, pH 6.0, 0 % NaCl), e per questo non possono essere considerate come stress subletali. Pretrattamenti con 5 o 10 % NaCl hanno invece avuto un effetto negativo sulla
viabilità cellulare unicamente dopo stress gastrici letali. Un miglioramento nella
resistenza cellulare ad uno stress letale termico (56°C per 5 min) è stato osservato per
cellule pretrattate a 47°C. Pretrattamenti di calore hanno avuto però un effetto negativo
sulla viabilità cellulare dopo liofilizzazione e dopo un stress osmotico letale. Specifici
pretrattamenti di stress (pH 4.0; 47°C; 10% NaCl; 47°C+10% NaCl; and pH 4.0+10%
NaCl) vennero anche applicati su cellule all’inizio della fase stazionaria di crescita in
colture in lotto (batch). Questo procedimento produsse effetti simili a quelli riscontrati in
coltura continua, mostrando che essa permette di trovare gli stress sub-letali applicabili in
seguito pure a tradizionali colture in lotto.
Un’altra possibilità di produrre probiotici più resistenti è l’isolamento di ceppi genetici
durante una coltura sotto pressione di selezione. Nel capitolo 4 viene presentato un nuovo
metodo per isolare ceppi resistenti allo stress ossidativo usando colture continue.
Partendo dal presupposto che sottoporre i bifidobatteri a stress porterà all’apparizione di
8
ceppi più resistenti e che una densità cellulare più elevata porta ad una maggiore
probabilità di mutazione; la coltura continua con pressione di selezione è stata combinata
con la tecnologia di cellule immobilizzate, che ha permesso di raggiungere densità
cellulari molto alte nel bireattore di 1013 CFU l-1 senza applicazione di stress. Sottoposta a
crescenti concentrazioni di perossido d’idrogeno (H2O2), la coltura continua si è adattata
gradualmente, come mostrato dall’evoluzione della densità ottica. Questa diminuiva
dopo ogni aumento in concentrazione di H2O2 ed in seguito aumentava nuovamente.
Dopo 9 giorni, dopo aver aumentato la concentrazione di H2O2 a 130 ppm, la densità
ottica della coltura è scesa a 0. La completa eliminazione delle cellule dal bioreattore è
stata evitata grazie all’immobilizzazione delle cellule in sfere di gel. Quindi dopo aver
interrotto lo stress è stato possibile ricoltivare le cellule sopravvissute e di isolare 2 ceppi
(HPR1 e HPR2) adattati allo stress di H2O2. Paragonato a HPR1, HPR2 ha dimostrato di
possedere caratteristiche stabili per almeno 70 generazioni. Inoltre, HPR2 ha anche
dimostrato di possedere una più alta tolleranza all’O2 che cellule del ceppo originale non
adattate allo stress. Una caratterizzazione preliminare ha mostrato che HPR2 mostra
un’espressione indotta di due geni che codificano uno per una proteina con regioni
transmembranari e funzione sconosciuta e l’altro per una proteina da trasporto del tipo
ABC. Questo studio ha mostrato che la coltura continua con cellule immobilizzate è un
approccio efficace per selezionare cellule adattate al H2O2.
In conclusione, questa dissertazione descrive la progettazione e la validazione
sperimentale di due nuovi approcci con coltura continua per migliorare la resistenza
cellulare dei microorganismi probiotici. La coltura continua è stata applicata per fare uno
screening di stress sub-letali e, insieme alla tecnologia di cellule immobilizzate e a una
pressione di selezione, è stata usata per isolare cellule di Bifidobacterium resistenti allo
stress ossidativo. Il nostro studio apre nuove vie per l’ottimizzazione tecnologica di ceppi
probiotici sensibili e per la loro utilizzazione in prodotti alimentari.
9
1 Introduction
1.1 Human microbiota of the gastro-intestinal tract
The gastro intestinal tract (GIT) consists of stomach, small intestine (duodenum, jejunum
and ileum) and large intestine (cecum, colon and rectum). The stomach generates a
fasting gastric pH of 1.5, which increases to 3.0-5.0 during alimentation (Cotter and Hill
2003). It is therefore a hostile environment for most bacteria. It contains bacteria ingested
with the food and those dislocated from the mouth, with bacterial counts of
approximately 103 to 106 cells g-1 of contents after meals and lowest (frequently
undetectable) after digestion (Baron et al. 1996). In the duodenal and jejunal fluids cell
counts of 103 ml-1 are found in most individuals. Further along the jejunum and into the
ileum, bacterial counts begin to increase (Baron et al. 1996). The majority of the gastrointestinal microbiota is found in the large intestine where it reaches densities of 1011–1012
cells ml-1 of luminal content (Whitman et al. 1998). Bacteria of the gastro intestinal
microbiota are estimated to be ten fold more numerous than the total number of cells in
the human body (Palmer et al. 2007).
In humans at birth, the sterile intestine of newborns is contaminated by the mothers
genital flora and/or by the environment. Alternatively, new studies indicate that bacterial
transfer from the gut to mammary gland of the mother may be a source for maternal milk
contamination and therefore of colonization of the intestine of newborns (Gueimonde et
al. 2007; Perez et al. 2007). At first, the intestine of newborns is colonized by aerobic or
facultative anaerobic bacteria. They change the gut environment by consuming oxygen
after which anaerobic bacteria start colonization. The first anaerobes establishing in the
gut are Bifidobacterium, Clostridium and Bacteroides. As more oxygen-sensitive species
establish, the population sizes of aerobic and facultative aerobic bacteria decline (Palmer
et al. 2007).
The human intestinal microbiota is a complex microbial environment. The main
phylotypes found in the adult human intestinal tract includes Firmicutes, Bacteroidetes,
Proteobacteria, Verrucomicrobia, Actinobacteria, Cyanobacteria and Fusobacteria
(Eckburg 2005; Turroni et al. 2008). From an analysis of prokaryotic ribosomal RNA
10
gene sequences from intestinal samples, Eckburg et al. (2005) detected a majority of
members of the Firmicutes and Bacteroidetes phyla, most (95%) of the Firmicutes
sequences were members of the Clostridia class.
Gut bacteria interact with the host in a symbiotic relationship, where the host provides a
nutrient-rich habitat and bacteria can bring important benefits on host’s health (Shanahan
2002). The GIT microbiota contributes to host nutrition by increasing the efficacy of
energy harvest from diet (e.g. complex sugar breakdown) as well as by synthesizing
essential vitamins (Turroni et al. 2008). Moreover, it provides a barrier against exogenous
pathogenic bacteria, by occupying available habitats (adhesion sites) at the mucosal level,
competing for metabolic substrates and producing antimicrobial factors including lactic
acid, H2O2 and bacteriocins (Hao and Lee 2004; Shanahan 2002). On the other hand, GIT
microbiota can also negatively influence host’s health by producing carcinogenic
substances. Such substances can be produced from the anaerobic metabolism of peptides
and proteins, degradation of sulfur-containing amino acids or bile acids deconjugation
(Blaut and Clavel 2007). Besides, certain gastrointestinal diseases, such as inflammatory
bowel disease, have been linked to malfunctioning GIT microbiota (Turroni et al. 2008).
1.2 Probiotics
1.2.1 Definition
Probiotic comes from Greek and means “for life” and was initially used as an antonym of
the word ‘‘antibiotic’’. However, it has been given different meanings over the years.
Initially, probiotics were described as substances that promote health of malnourished
patients, stimulate growth of other microorganisms, or contribute to intestinal microbial
balance. More recent definitions commonly state that probiotics should include live
microorganisms (Vasijevic and Shah 2008), as e.g. the frequently used definition of
Fuller (1992), who defines probiotics as ‘‘a live microbial feed supplement, which
beneficially affects the host animal by improving its intestinal microbial balance’’.
According to recommendations of a FAO/WHO working group on the evaluation of
probiotics in food, probiotics are defined as “live microorganisms that when administered
in adequate amounts confer a health benefit on the host” (FAO/WHO 2002).
11
1.2.2 Criteria for selection of probiotics
There are a number of factors that are important for the selection of probiotic (Table 1).
First of all probiotics need to be safe. Taxonomic classification gives an indication about
the origin, habitat and physiology of a strain and is therefore a major criterion for the
selection of probiotics. However, because the intestine of newborns is sterile and the
origin of the human intestinal microbiota is therefore unclear (Vasijevic and Shah 2008),
a FAO/WHO (2002) expert panel has suggested that the specificity of probiotic action is
more important than the source of microorganism. Another important safety aspect is the
presence of antibiotic resistance genes in probiotics strains. These genes, especially those
encoded on plasmids, can be transferred to other microorganisms in the gastrointestinal
tract, potentially leading to selection of antibiotic resistant pathogens in the GI tract.
Secondly, strains used as probiotics need to be suitable from a technological point. They
must be culturable, viable and stable under industrial production conditions. Furthermore,
probiotics need to fulfill some functional criteria including resistance to bile and acid and
be able to survive and proliferate in vivo. Additionally, probiotics should show one or
more desirable physiological criteria and health effects (Table 1).
12
Table 1 Selection criteria for probiotic strains (Klaenhammer and Kullen 1999; Vasijevic and Shah
2008)
Safety criteria
Origin
Accurate taxonomic identification
Non-toxic, non-pathogenic, GRAS status
Intrinsic properties: antibiotic resistances and metabolic activities
Technological suitability
Amenable to mass production and storage
Viability at high population density (preferred at 106 –108 CFU ml-1 )
Provides desirable organoleptic qualities (or no undesirable qualities)
Genetically stable
Phage resistant
Functional criteria
Resistant to bile and acid
Adhesion to mucosal surface
Capable of survival, proliferation, and metabolic activity at the target site in vivo
Able to compete with the microbiota, including the same or closely related species, potentially
resistant to bacteriocins, acid and other antimicrobials produced by residing microbiota
Able to exert one or more clinically documented health benefits
Desirable physiological criteria and health effects
Antagonistic toward pathogenic/carcinogenic bacteria
Production of antimicrobial substances (bacteriocins, hydrogen peroxide, organic acids or other
inhibitory compounds)
Production of bioactive compounds (enzymes, vaccines, peptides)
Amelioration of the immune response
Alleviation of lactose intolerance
Decrease in serum cholesterol level
Prevention of certain types of diarrhea
13
1.2.3 Beneficial effects of probiotics
Various probiotic strains have been shown to alter (temporarily) the intestinal microbiota
and/or to hinder colonization of the gut by (potential) pathogens, as well as translocation
of pathogenic bacteria through the intestinal wall and the infection of other organs (de
Vrese and Schrezenmeir 2008). Proposed beneficial health effects of probiotics, which
are documented for certain strains, include prevention of certain types of diarrhea
especially caused by rotavirus, reduction of antibiotic associated symptoms, decrease in
the prevalence of allergy in susceptible individuals, amelioration of the immune response,
relief of lactose intolerance and decrease in unfavorable metabolites, e.g., amonium and
procancerogenic enzymes in the colon (Schrezenmeir and de Vrese 2001; Saxelin et al.
2005; Parvez et al. 2006). There is some evidence of health effects through the use of
probiotics for the following: prevention or reduction of the effects in chronic intestinal
inflammation, reduction of the risk of acute diarrhoea in children, reduction of the risk of
respiratory infections, suppression of Helicobacter pylori and reduction of serum
cholesterol levels (Schrezenmeir and de Vrese 2001; Saxelin et al. 2005; Parvez et al.
2006).
Resuming probiotic bacteria may affect the intestinal microbiota and other organs by
modulating immunological parameters, intestinal permeability, or by providing bioactive
metabolites. Possible mechanisms of action were reviewed by de Vrese and Schrezenmeir
(2008) and include: reduced intestinal pH; production of bactericidal substances (e.g.
organic acids, H2O2 and bacteriocins); agglutination of pathogenic microorganisms;
strengthening barrier function of the intestinal mucosa competition for fermentable
substrates or receptors on the cellular surface of the mucosa; absorption and
metabolization of potentially pathogenic, toxic, or cancerogenic metabolites and
enzymes; modulation of immunological mechanisms; stimulation of the intestinal
motility and mucus production.
14
1.3 Bifidobacteria
1.3.1 Family and genus Bifodobacteriaceae
In 1899 Tissier observed and isolated a Y shaped bacterium in the faeces of breast-fed
infants and called it "Bacillus bifidus communis" (lat. Bifidus: Cleft, divided) (Biavati and
Mattarelli 2001). However, due to similarities to lactobacilli, bifidobacteria were
included in the genus Lactobacillus (Breed and Murray 1957) and only since the VIIIth
edition of Bergey’s Manual of Determinative Bacteriology, they were reclassified as a
separate genus (Buchanan 1974). Bifidobacteria are Gram-positive, anaerobic, nonmotile, non-spore forming rods, which are usually curved and often in Y- or V-shapes.
Unlike lactobacilli, they possess a fructose-6-phosphate phosphoketolase, no aldolase or
glucose-6-phosphate dehydrogenase, and have a high G+C DNA content between 55 and
67 %. Bifidobacteria are catalase-negative, with the exception of B. indicum and B.
asteroides ((Biavati and Mattarelli 2001).
The genus Bifidobacterium, consisting of 32 species (type species Bifidobacterium
bifidum, Tissier; Orla- Jensen, 1924), and the genus Gardnerella (Greenwood and
Pickett, 1980), with Gardnerella vaginalis as the only species, belong to the family of
Bifidobacteriaceae. This family is classified in the order of Bifidobacteriales, in the
subclass of Actinobacteridae, in the class of Actinobacteria, in the lineage of Firmicutes,
and in the domain of Bacteria (Stackebrandt et al. 1997; Biavati and Mattarelli 2001).
1.3.2 Habitat
The habitat of bifidobacteria is mainly the intestinal tract of warm-blooded animals
(Table 2). They are sometimes involved in certain human infective processes (mostly
dental caries) but usually they are considered non-pathogenic (Biviati and Mattarelli
2001). Normally, Bifidobacterium species are specific for their human or animals host;
the only exception being Bifidobacterium species found in the intestinal microbiota of
both suckling calves and breast-fed infants (Table 2). Additionally bifidobacteria were
found in sewage and in fermented milk products.
15
The sterile intestine of newborns humans is colonized by contamination with the
mother’s genital flora and/or with the environment. Alternatively, new studies indicate
that bacterial transfer from the gut to mammary gland of the mother may be a source for
maternal milk contamination and therefore of colonization of the intestine of newborns
(Gueimonde et al. 2007; Perez et al. 2007). The intestine of neonates has a positive redox
potential and is then first colonized by facultative anaerobe bacteria (enterobacteria and
Gram-positive cocci) which lower the redox potential (Favier et al. 2003). The decrease
in redox potential then permits the colonization of the gastro intestinal tract (GIT) by
bifidobacteria (Bezirtzoglou 1997).
Studies using Fluorescence In Situ Hybridisation (FISH) technology revealed that
bifidobacteria comprise up to 75 % of the total faecal microbiota of formula-fed infants
and up to 91 % of the breast-fed infants (Harmsen et al. 2000). The amount of
bifidobacteria in the human GI-tract decreases during lifetime. The faecal microbiota of
children is similar to that of an adult after approximate two years and bifidobacteria make
up 10% of the gut flora in adults when measured by classic culture technique, and 1-3%
when analyzed using molecular methodologies (Tannock 2002). In elderly people the
bifidobacteria number is lower whereas the number of faecal clostridia rises (Roissart and
Luquet 1994).
16
Table 2 References and habitat of species of the genus Bifidobacterium (Biavati et al. 2000; Ventura
et al. 2004; Leahy et al. 2005; Klaassens 2007)
Species
Found in human GI
B. adolescentis
B. angulatum
B. bifidum
B. breve
B. catenulatum
B. dentium
B. gallicum
B. longum bv. infantis
B. longum bv. longum
B. pseudocatenulatum
B. scardovii
B. thermophilum
Found in animal GI
B.
animalis
ssp.
animalis
B. asteroides
B. bouom
B. choerimum
B. coryneforme
B. cuniculi
B. gallinarium
B. indicum
B. longum bv. suis
B. magnum
B. merycicum
B. pseudolongum ssp.
Strain
Source
Reference
ATCC15703T Infant and adult feces, (Reuter 1963)
appendix, dental caries and
vagina
Adult feces
(Scardovi
and
Crociani 1974)
DSM 20215
Infant and adult feces and (Orla-Jensen 1924)
vagina
JCM 1254
NCIMB
41171
UCC2003
Infant feces and vagina
(Reuter 1963)
Infant and adult feces and (Scardovi
and
vagina
Crociani 1974)
Bd1
Human dental caries, oral (Scardovi
and
cavity and adult feces
Crociani 1974)
Adult feces
(Lauer 1990)
ATCC 15697 Infant feces and vagina
(Reuter 1963; Sakata
et al. 2002)
DJO10A
Infant and adult feces and (Reuter 1963; Sakata
vagina
et al. 2002)
NCC2705
Human intestine
(Schell et al. 2002)
Infant feces
(Scardovi et al. 1979)
Adult urine and blood
(Hoyles et al. 2002)
Piglet, chicken and calf feces (Mitsuoka 1969; von
and rumen, infant
Ah et al. 2007)
Rat, chicken, rabbit and calf (Scardovi
and
feces
Crociani 1974; Masco
et al. 2004)
Honeybee
(Scardovi
and
Trovatelli 1969)
Rumen and piglet feces
(Scardovi et al. 1979)
Piglet feces
(Scardovi et al. 1979)
Honeybee
(Biviati et al. 1982)
Rabbit feces
(Scardovi et al. 1979)
Chiken feces
(Watebe et al. 1983)
Honeybee
(Scardovi
and
Trovatelli 1969)
Piglet feces
(Matteuzzi
et
al.
1971)
Rabbit feces
(Scardovi
and
Crociani 1974)
Rumen
(Biviati and Mattarelli
1991)
Piglet, calf, rat, rabbit, lamb (Biviati et al. 1982)
17
globosum
B. pseudolongum ssp.
pseudolongum
B. psychraerophilum
B. pullorum
B. ruminantium
ATCC 49618
B. saeculare
B. thermacidophilum
ssp. porcinum
Other origins
B. animalis ssp. lactis
B. minimum
B. subtile
feces and rumen
Piglet, rat, chicken, calf feces (Scardovi
and
and rumen
Trovatelli
1969;
Yaeshima et al. 1992)
Pig caecum
(Simpson et al. 2004)
Chicken feces
(Trovatelli et al. 1974)
Rumen
(Biviati and Mattarelli
1991)
Rabbit feces
(Biviati and Mattarelli
1991)
Piglet feces
(Dong et al. 2000)
Fermented milk
Sewage
Sewage
(Meile et al. 1997)
(Biviati et al. 1982)
(Biviati et al. 1982)
1.3.3 Physiology
1.3.3.1 Carbohydrates metabolism
Bifidobacteria are chemoorganotrophs having a fermentative type of metabolism. They
produce acid from a variety of carbohydrates, mainly acetic and lactic acids, and no
gases. The catabolism of hexoses in Bifidobacterium species involves a characteristic
pathway known as the fructose 6-phosphate pathway (F6P) (Scardovi, 1964; Scardovi
and Trovatelli, 1965; De Vries et al, 1967). The key enzyme of this pathway is fructose6-phosphate phosphoketolase (EC 4.1.2.2) (Biavati and Mattarelli 2001) that catalyzes
the decomposition of pentose phosphates, to acetyl phosphate and glyceraldehyde-3phosphate. Fructose-6-phosphate phosphoketolase is encoded by the gene xfp (Meile et
al. 2001). Hexoses undergo a series of cleavage and isomerisation reactions to produce
pentose phosphates. The acetyl phosphate is converted to acetate, thereby yielding one
ATP, whereas the glyceraldehyde- 3-phosphate is converted to pyruvate and further
reduced to lactate to regenerate NAD (Degnan and Macfarlane 1994). Initially, the
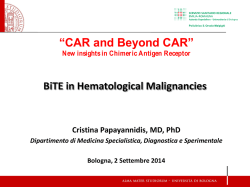
calculated theoretical ratio of the F6P pathway was 3:2 (acetate/lactate) (Figure 1).
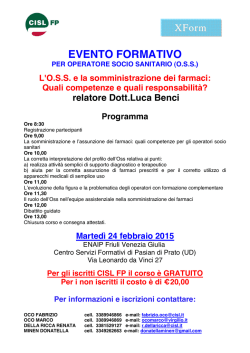
However, pyruvate can also be converted to formate and acetyl-CoA (Figure 2), which is
subsequently reduced to ethanol to oxidize the NADH produced earlier in the metabolic
pathway (Devries and Stouthamer 1968).
18
Figure 1 fructose 6-phosphate shunt adapted from Biviati and Mattarelli (2001)
19
2
Figure 2 Schematic diagram of bifidobacterial sugar metabolism adapted from Van der Meulen et al.
(2006a).
20
The control of dissimilation of pyruvate to lactate or ethanol is unclear, but it can be
depending on carbohydrate availability. Degnan and Macfarlane (1994; 1995) observed
that during carbon limitation, pyruvate is preferentially cleaved to acetyl-CoA and
formate since one additional ATP can be formed, whereas with excess of substrate ATP
formation is not a problem and pyruvate is reduced to lactate. Van der Meulen et al.
(2006a) also observed that when the specific sugar consumption rate increased, relatively
more lactic acid and less acetic acid, formic acid, and ethanol were produced, and vice
versa.
Bifidobacteria are able to grow on a wide range of carbon sources (Table 3) including
mono-, di-, tri- and oligo-saccharides. This gives bifidobacteria an ecological advantage
in the intestinal environment where complex carbohydrates are present either because of
production by the host epithelium (e.g. mucin) or introduction through the diet. This
adapation to complex carbohydrates is reflected in the genome of B. longum that encodes
over 40 predicted glycosylhydrolases putatively involved in the degradation of higher
order oligosaccharides (Schell et al. 2002; Parche et al. 2007).
21
Table 3 Growth capacity of B. longum NCC2705 on 23 carbohydrates (Parche et al. 2007)
Carbon source
Monocarbohydrates
Arabinose
Fructose
Galactose
Glucose
Glycerol
Mannose
Mannitol
N-acetylglucosamine
Rhamnose
Ribose
Sorbitol
Xylitol
D-Xylose
Di/trisaccharides
Maltose
Melibiose
Salicine
Sucrose
Trehalose
Lactose
Raffinose
Oligosaccharides
Arabinogalactan
Raftilose (oligofructose)*
Starch
Growth
++
+
+++
+++
+
++
++
++
++
+++
+++
+
++
-
Growth capacity was scored as: slow growth (+), moderate growth (++) and fast growth (+++)
* Composition of raftilose was 93.2 % oligofructose and up to 6.8 % glucose, fructose and
sucrose.
1.3.3.2 Optimal growth temperature and pH
Being bifidobacteria intestinal bacteria of warm blooded animals, their optimal growth
temperature ranges between 37 and 41°C and the optimum pH at the beginning of the
growth is between 6.5 and 7.0 (Biavati and Mattarelli 2001). Most species do not grow
below 20°C and above 46°C and pH lower than 4.5 or higher than 8.5 with the exception
of B. thermacidophilum, which is able to grow at pH 4.0 and at 49°C (Dong et al., 2000).
22
1.3.3.3 Oxygen sensitivity
Bifidobacteria are strict-anaerobic microorganisms and sensitive to oxygen. However,
sensitivity to oxygen differs between species and strains (Biavati and Mattarelli 2001).
Some Bifidobacterium strains have been described to grow in liquid media in the
presence of oxygen. For example, B. lactis tolerates 10 % oxygen in the headspace
atmosphere above a reduced liquid media (Meile et al. 1997). Maxwell et al. (2004)
showed that B. boum DSM 20432T grew to a similar optical density in air compared to
anaerobic conditions. B. thermophilum was shown to be tolerant to exposure to air and
grew under reduced oxygen atmosphere (Beerens et al. 2000; von Ah et al. 2007) and
also a recently isolated Bifidobacterium, B. psychraerophilum, was found to be
aerotolerant (Simpson et al. 2004). This species was even able to grow on agar plates
under aerobic conditions. Bifidobacteria are sensitive to oxygen due to several reasons:
some strains require a high redox potential or harbor enzymes (e.g. phosphoketolase) that
are sensitive to hydrogen peroxide (Biavati and Mattarelli 2001). Hydrogen peroxide is a
reactive oxygen species and it accumulates in bifidobacteria exposed to oxygen
(Kawasaki et al. 2006). Although, bifidobacteria are all catalase-negative when grown
under anaerobic conditions, two species tolerant to air, B. indicum and B. asteroides,
become catalase-positive when grown in the presence of air, with or without addition of
hemin, respectively (Scardovi and Trovatelli 1969).
1.3.4 Bifidobacteria as probiotics
The use of bifidobacteria as probiotics is to ascribe to their natural habitat in the intestine
during their complete life cycle. Their presence in the GIT has been associated with a
number of beneficial health effects as e.g. reduction of diarrhoea, relief of lactose
intolerance, resistance to microbial infections, prevention of cancer, treatment of
inflammatory bowel disease, alleviation of constipation, elevated immune function, and
reduction of serum cholesterol (Leahy et al. 2005). However, mechanisms of action for
the majority of these effects are not yet elucidated.
23
1.3.4.1 Reduction of diarrhoea
Acute diarrhoea in children is often caused by rotavirus. Beneficial effects of different
probiotics, including bifidobacteria, such as decreased frequency of infections, shortening
of the duration of episodes have been observed (de Vrese and Schrezenmeir 2008; Goldin
and Gorbach 2008).
A broad range of microbial pathogens causes traveller’s diarrhoea. These include
Escherichia coli, Salmonella, Campylobacter and Shigella strains as well as viruses.
Even though in vitro and animal studies confirmed that some probiotic strains inhibit
growth and metabolic activity as well as the adhesion to intestinal cells of
enteropathogenic bacteria like Salmonella, Shigella or Vibrio cholerae, few studies have
been published demonstrating positive effects in humans (Leahy et al. 2005; de Vrese and
Schrezenmeir 2008).
The frequency and/or duration of episodes of antibiotic-associated diarrhea and the
severity of symptoms may be reduced by administration of probiotics, including
Bifidobacterium strains, before and during antibiotic treatment (de Vrese and
Schrezenmeir 2008).
1.3.4.2 Relief of lactose intolerance
Individuals with lactose maldigestion tolerate lactose in yogourt clearly better than in
milk. A possible mechanism for this is that yogourt-bacteria release high amount of
lactase (!-galactosidase) when lysed by bile salts in the gastrointestinal tract (Goldin and
Gorbach 2008). Also bifidobacteria have been shown to reduce abdominal bloating, pain,
flatulence and nausea in individuals with lactose intolerance (Leahy et al. 2005). Delivery
of lactase to the intestine via the consumption of lactase-producing probiotics is a
practical approach for treatment of lactose intolerance.
24
1.3.4.3 Inhibition of Helicobacter pylori
H. pylori infection is treated by antibiotic therapy and probiotics administration is most
probably not sufficient to eradicate H. pylori. Administration of probiotics concomitantly
to antibiotic treatment may resolve problems associated with side effects (Vasijevic and
Shah 2008). Several mechanisms regarding the effect of probiotics on H. pylori have
been suggested including production of organic acids, hydrogen peroxide or bacteriocins,
enhanced gut barrier function and competition for adhesion sites; however, the relative
importance of these mechanisms is still unclear (Leahy et al. 2005).
1.3.4.4 Prevention of inflammatory bowel disease
Inflammatory bowel disease (IBD) comprises a spectrum of disorders characterized by
inflammation, ulceration and abnormal narrowing of the gastrointestinal tract resulting in
abdominal pain, diarrhoea and gastrointestinal bleeding (Vasijevic and Shah 2008).
Probiotics,
including
bifidobacteria,
with
anti-inflammatory
properties
and
a
demonstrated positive impact on the intestinal flora have shown promising effects against
IBD in studies with experimental animals (de Vrese and Schrezenmeir 2008).
1.3.4.5 Alleviation of constipation
Clinical studies showed that administration of certain probiotic, including bifidobacteria
reduced gastrointestinal transit time (de Vrese and Schrezenmeir 2008). Nevertheless,
more controlled clinical studies with sufficient numbers of participants are necessary to
confirm these results and the mechanisms of action need to be elucidated.
1.3.4.6 Prevention of colorectal cancer
Data for the efficacy of probiotics against colorectal cancer is derived from the use of
animal models. Probiotics, including some Bifidobacterium strains were shown to
indirectly lower carcinogenicity by decreasing bacterial enzymes that activate
carcinogenesis and by producing short-chain fatty acids, which reduce activities of
enzymes involved in the generation of carcinogenic products (Vasijevic and Shah 2008).
25
1.3.5 Pathogenesis of bifidobacteria
Many positive effects have been assigned to bifidobacteria, however since most
bifidobacteria are common members of the human intestinal microbiota, they may behave
as opportunistic pathogens, like other commensal bacteria (Saarela et al. 2002). In fact,
bifodobacteria have been isolated in cases of infections and dental caries. B. longum was
isolated from blood after a sepsis (Ha et al. 1999). Other Bifidobacterium sp. have been
found in pulmonary infections, bacteremia, abscesses and bloodstream infections (Green
1978; Gasser 1994; Saarela et al. 2002). B. dentium, B. subtile, and B. breve have been
isolated from human dental caries (Modesto et al. 2006; Mantzourani et al. 2009).
However, until now, probiotic bifidobacterial strains have never been recovered in
infections following ingestion of dairy products and can therefore be considered no health
hazards (Meile et al. 2008). More problematic in probiotic strains are antibiotic resistance
genes since the potential of a transfer to intestinal bacteria, including pathogenic ones, is
highly probable (Meile et al. 2008). Kastner et al. (2006) detected the tetracycline
resistance gene tet(W) in B. lactis and suggested that strains used for probiotic or starter
cultures should be tested for the presence of transferable resistance genes prior to
commercial use.
26
1.4 Stress
Bifidobacteria have to survive a number of harsh conditions to reach the GIT in sufficient
amounts to be effective as probiotic (Figure 3). Some of these conditions are already
encountered during fermentation. The composition of the growth medium and production
of toxic by-products may have an influence on the viability of probiotic strains.
Moreover, industrial processes during starter handling, downstream processing, and
storage, including freeze drying, freezing and spray drying, cause mechanical, and
physiological stresses (De Dea Lindner et al. 2007; Lacroix and Yildirim 2007).
Additionally, after ingestion with the functional food, conditions like acidic pH in the
stomach and bile salts in the small intestine influence the number of living bifidobacteria
at their target site (Sanchez et al. 2008). Survival of bifidobacteria during these steps, and
thus their functionality as probiotic, depends on their capacity of adaptation and
resistance to these different adverse conditions.
Figure 3 Main factors affecting the viability of probiotics from production to the gastrointestinal
tract (Lacroix and Yildirim 2007).
27
1.4.1 Stress response
Various reviews about stress responses in bifidobacteria have been published in the last
years (Ventura et al. 2006; De Dea Lindner et al. 2007; Sanchez et al. 2008).
Additionally, analysis of the B. longum complete genome sequence has revealed the
presence of several different regulatory mechanisms by which the cells protect
themselves against various stresses (Klijn 2005b).
A common regulatory mechanism in stress response at the level of transcription of genes
depends on sigma factors. Sigma factors are relatively small proteins that direct binding
of the RNA polymerase to the promoter region. The sigma factor greatly reduces the
affinity of the RNA polymerase for nonspecific DNA, while increasing specificity for
certain promoter regions. Most bacteria possess more than one sigma factor, each with its
own promoter sequence, allowing regulation of gene expression. The presence of a
specific sigma factor allows the RNA polymerase enzyme to bind at a specific promoter
sequence on the chromosome, and thereby starting transcription of downstream genes
(Abee and Wouters 1999). One sigma factor ("A) is known as the “house-keeping” sigma
factor and it regulates transcription of the majority of genes. However, under stress
conditions, alternative sigma factors with different promoter specificities are induced
(Chung et al. 2006), leading to the higher expression of genes involved in stress response.
The number of alternative sigma factors can range from 0 to over 50 (Helmann 2002;
Pridmore et al. 2004). The common regulatory mechanism of sigma factors themselves
includes an anti-sigma factor that prevents the sigma factor from binding to the RNA
polymerase. When the anti-sigma factor receives a stimulus from the environment, it
releases the sigma factor thereby activating differential gene expression (Helmann 2002).
In most cases the sigma and anti-sigma factors are autoregulated as an operon. However
in B. longum NCC2705, BL1357 (a possible alternative sigma factor) and BL1358 (a
possible anti-sigma factor) are regulated differently. BL1358 was over-expressed under
stress conditions, whereas BL1357 was constitutively transcribed (Klijn 2005).
28
Most stresses cause denaturation, misfolding and aggregation of proteins. Molecular
chaperones bind and stabilize polypeptides generated by protein synthesis or by
denaturation of proteins, thereby promoting protein proper assembly, initial folding, and
refolding (Hartl 1996). Proteins that are irreparably damaged are degraded by proteases.
Bifidobacteria possess a smaller set of chaperones/ proteases than found in other bacteria
(De Dea Lindner et al. 2007), which include representatives of Hsp100 (Heat shock
proteins 100), Hsp70, Hsp60 and small Hsps. In bifidobacteria, the members of the
Hsp100 protein family, ClpB, ClpC and the ClpP protein are present, which in the Clp
complex exerts proteolytic activity on misfolded proteins (De Dea Lindner et al. 2007).
Also proteins belonging to the Hsp70 (DnaK) and Hsp60 (GroEL) families are present.
These molecular chaperones interact with co-chaperone molecules (e.g. DnaJ and GrpE
in the case of DnaK, or GroES in the case of GroEL) and form the DnaK and GroEL
complexes (Bukau and Horwich 1998). The genes encoding for the DnaK complex are
located within the dnaK operon, encompassing the dnaK, grpE, dnaJ1 and hspR genes
(De Dea Lindner et al. 2007). The genes groESL are generally organised in an operon
(Segal and Ron 1996), but this is not the case in bifidobacteria.
Small heat shock proteins (sHSPs) are characterized by a relatively low molecular mass,
ranging between 14 and 27 kDa. They prevent irreversible protein denaturation of heatdamaged proteins (Narberhaus 1999). The sHSPs act as ATP-independent chaperones by
binding to denaturated proteins and maintain them in a folding-competent state (Lee et al.
1997). One representative (hsp20) of the small heat shock proteins (sHSPs) was found in
the genome of B. breve UCC2003 and B. longum NCC2705 (De Dea Lindner et al. 2007;
Ventura et al. 2007).
During aminoacid starvation and also after stress with sufficient physiological impact to
prevent proper charging of tRNA with amino acids bacteria activate the stringent
response. RelA, a protein situated in the membrane, activates (p)ppGpp synthesis. The
unusual guanidine nucleotide (p)ppGpp binds to the RNA polymerase thereby repressing
transcription. Further it can also induce specific sigma factor (Potrykus and Cashel 2008).
However, in B. longum NCC2705, BL1439, similar to relA, was not induced under stress
(oxidative stress, starvation and heat shock) (Klijn 2005a).
29
General stress genes are thought to provide non-specific protection to the cell in the event
of adverse conditions, whereas additional genes can be transcribed in response to a
specific type of stress. Expression profiles from a range of different environmental
stresses (oxidative stress, starvation and heat shock) were used to identify genes
implicated in the general stress response of B. longum NCC2705 (Klijn et al. (2005a).
The dnaK operon (dnaK, grpE, dnaJ, hspR), known to participate to the common stress
response in other bacteria (Narberhaus 1999), was higher expressed during all three
stresses ; as were several regulatory genes such as hspR, hrcA and the putative anti-sigma
factor. The most rapidly and highly induced gene in the three stress situations was the
small heat shock protein encoded by BL0576 (hsp20) (Klijn et al. 2005a).
1.4.2 Heat stress response
The production of bifidobacteria for incorporation into food requires survival of the
microbes during processes that involve heat shock treatments such as spray drying.
Therefore, understanding the genetic basis of heat stress response might be crucial for
selecting new strains with probiotic properties (De Dea Lindner et al. 2007). High
temperatures induce principally protein denaturation but membranes and nucleic acids
have also been identified as cellular sites of heat injury. When cells are exposed to heat
stress, responses occur via increased synthesis of chaperones, which promote the correct
folding of nascent polypeptides, assembly of protein complexes, degradation and
translocation of proteins (De Angelis and Gobbetti 2004).
Genome sequence analysis revealed that the strain B. breve UCC2003 possesses two
groups of chaperones, one related to the response to moderate increase of temperature,
up-shift of 5 °C, (groEL, groES, clpC and clpP1P2) and the other involved in the
response to more severe increases, up-shift of 13 °C, (dnaK, grpE, dnaJ1 and clpB)
(Ventura et al. 2006).
Global transcriptome analysis of the heat shock response of B. longum NCC2705
highlighted a profound modification of gene expression upon exposure to 50°C, resulting
in a slow-down of the general metabolic activity and activation of the classical heat shock
stimulon. The dnaK operon (BL0516–BL0520), which includes genes encoding the major
30
molecular chaperones DnaK, GrpE, DnaJ as well as the transcriptional repressor HspR,
was among the highest and most rapid induced operons. The genes encoding the second
major molecular chaperone system, groEL (BL0002) and groES (BL1558) and the
corresponding transcriptional regulator HrcA (BL0718), were also induced but at lower
levels (Rezzonico et al. 2007). Using protein labeling in combination with two
dimensional gel electrophoresis an accumulation of the molecular chaperones GrpE,
ClpA/B, HtrA, DnaK and GroEL in the cytoplasm of B. longum was detected during heat
stress (Savijoki et al. 2005). Additionally, it has been shown in bifidobacteria that gene
hsp20, coding for a protein member of the small heat shock protein family, is strongly
induced in response to severe heat shock regimens, by oxidative shock and starvation
(Klijn et al. 2005a; Rezzonico et al. 2007; Ventura et al. 2007).
31
1.4.3 Osmotic stress response
Increasing osmotic pressure in the environment provokes the activation of
osmoregulation systems to prevent shrinkage and eventual plasmolysis of the cell (Chung
et al. 2006). Accumulation of non-toxic low molecular weight compounds including
sugars, polyols, amino acids and amine derivatives allow the cell to retain positive turgor
pressure, enhance enzyme stability at low aw, and maintain the integrity of the cellular
membrane during desiccation (Girgis et al. 2002). Additionally, osmotic stress,
comparably to heat stress leads to the induction of synthesis of proteins. In bifidobacteria
regulation of different chaperone proteins was observed. Induction of the dnaK gene after
heat, osmotic (NaCl), and bile treatments was observed in B. adolescentis (Schmidt and
Zink 2000). In B. breve the homologous gene dnaK and also dnaJ1, grpE and clpB, were
induced during osmotic and severe heat treatment, suggesting the existence of an
overlapping regulatory network controlling both osmotic and (severe) heat induced genes
(De Dea Lindner et al. 2007). However, in B. longum dnaK was induced only after heat
treatment (Schmidt and Zink 2000). In B. breve HspR and HrcA were induced upon
osmotic treatment (De Dea Lindner et al. 2007). The hsp20 gene is induced after heat and
also after osmotic stress, which appears to be a unique expression pattern because in
other bacteria small HSP-encoding genes are not induced upon exposure of the cells to
osmotic stress (Ventura et al. 2007). In the intestine, bifidobacteria are not exposed to
significant temperature changes, whereas they may encounter frequent changes in
osmotic conditions as a consequence of diet composition. It is therefore possible that
HSP20 in bifidobacteria acquired an osmotic functionality as a consequence of the
adaptation to the human intestinal ecological niche (Ventura et al. 2007). All the studies
mentioned in this paragraph have been performed using NaCl, which causes osmotic
stress but may also affect the the ionic balance of the cells.
32
1.4.4 Bile stress response
The ability to resist to bile salt stress is extremely variable among bifidobacteria (De Dea
Lindner et al. 2007). Bile salts are detergent-like biological substances that disrupt the
lipid bilayer structure of cellular membranes and cause oxidative damages to the cells
(Payne et al. 1998). Enteric bacteria defend themselves from bile salt stress with the
production of chaperones proteins that prevent or repair protein misfolding and repair
oxidative damaged DNA (Bernstein et al. 1999).
Proteome analysis in Bifidobacterium revealed an increase in the chaperone synthesis as a
response to, or adaptation to, bile salts (Sanchez et al. 2005; Sanchez et al. 2007b). For
example, a strain of B. animalis subsp lactis resistant to bile salts showed a constitutive
over-expression of the chaperones HtrA and ClpB. Furthermore, the adaptation to bile
salts by B. animalis subsp. lactis also resulted in the constitutive overexpression of
several enzymes involved directly or indirectly in redox reactions, especially those that
catalyse the last two steps of methionine biosynthesis, whose sulphur group is susceptible
to oxidization (Sanchez et al. 2008).
Another way of protection against bile salts was found in B. longum where a cholate
efflux system was involved in resistance to bile salts, chloramphenicol and erytromycin
(Price et al. 2006). Detoxification of bile salt by hydrolase (BSH) could have an influence
on bile salt resistence since the deconjugated form of bile salt has a strong effect on cell
viability. However, to date there is no solid evidence of a relationship between this
enzyme and the resistance level to bile salts (Grill et al. 2000).
Generally it was shown in bifidobacteria that bile salts produce changes in the synthesis
of a large number of proteins, involved in transcription and translation, and in the
metabolism of amino acids and nucleotides, and several enzymes of glycolysis and in
pyruvate catabolism, indicating that such compounds affect the global metabolism of
bifidobacteria (Sanchez et al. 2005; Sanchez et al. 2007b). Furthermore it was observed
that bifidobacterial strains showing the highest resistance to bile salt exposure were also
acid-resistant and therefore it was concluded that in bifidobacteria bile—as well as acidic
stresses are inducing the synthesis of a very similar arsenal of molecular players (Noriega
et al. 2004).
33
1.4.5 Gastric conditions and low pH stress response
Humans generate a fasting gastric pH of 1.5, which increases to between pH 3.0 and 5.0
during alimentation. To reach the small intestine in a viable state, bacteria will need to
survive these highly acidic conditions. Hence, acid tolerance can be considered a
virulence factor in pathogens, whereas it is a desirable property of potentially probiotic
strains (Cotter and Hill 2003). Beside, fermentative bacteria, including bifidobacteria,
produce large amounts of organic acids, mostly acetic and lactic acids, as end products of
sugar metabolism and must therefore cope with acid conditions during growth (De Dea
Lindner et al. 2007). Acid conditions have a negative impact on bacteria by reducing the
cytoplasmic pH, which can result in loss of activity of the relatively acid-sensitive
glycolytic enzymes and to structural damage of the cell membrane and macromolecules
such as DNA and proteins. Mechanisms to counteract the effect of low pH include efflux
of protons (H+), alkanization of the external environment, changes in the composition of
the cell envelope, production of general shock proteins and chaperones, expression of
transcriptional regulators, and responses to changes in cell density (Cotter and Hill 2003).
The F1F0-ATPase proton pump is one of the main mechanisms for the survival of Gram
positive microorganisms in acidic environments and therefore plays a key role in
bifidobacteria as well. In bacteria that do not possess a respiratory chain and thus are not
capable of using the F1F0 complex for synthesis of ATP via oxidative phosphorylation,
the sole function of this complex is the extrusion of protons and consequently the
establishment of pH homeostasis. In bifidobacteria the role of the F1F0-ATPase complex
for survival to low pH has been mentioned in B. animalis and B. longum (Ventura et al.
2004; Sanchez et al. 2006). Remarkably, acid-adapted B. longum cells maintained their
intracellular pH close to appropriate physiological values compared to non-adapted cells
in acidic conditions (Sanchez et al. 2007a).
34
1.4.6 Oxygen stress response
Bifidobacteria are strict anaerobes (Biavati and Mattarelli 2001), they possess neither a
respiratory chain nor catalase. Hence exposure to oxygen causes accumulation of reactive
oxygen species, mainly hydrogen peroxide, which lead to cell death of oxygen sensitive
bifidobacteria (Kawasaki et al. 2006). Reactive oxygen species (ROS) include superoxide
(O2-), hydrogen peroxide (H2O2), and hydroxyl radical (#OH). Superoxides are formed
through spontaneous univalent electron transfer from molecular oxygen and hydrogen
peroxide is produced out of the enzymatic or spontaneous dismutation of superoxide.
Hydroxyl radicals are generated by the reaction of iron with H2O2 (the fenton reaction)
(Kiley and Storz 2004). Enzymatic reactions involved in the reduction of molecular
oxygen are catalized by NADH oxidase for the regeneration of NAD+ from NADH.
There are two types of NADH oxidases, one catalyzes the reduction of O2 to H2O2, the
other one carries out the four-electron reduction of oxygen to water (Condon 1987;
Talwalkar and Kailasapathy 2004). Bifidobacteria most probably reduce O2 via the four
electron reduction to water. Genome sequence’s analysis of B. longum NCC2705
revealed an open reading frame, BL1266, encoding a putative NADH oxidase, which
seems to contain an active site similar to one in Enterococcus faecalis (Mallett and
Claiborne 1998; Klijn 2005a). Short lived O2- can damage DNA, membrane lipids and
proteins, particularly those that contain a (Fe-S)4 cluster. Elimination of this ROS can be
achieved by superoxide dismutase, superoxide reductase and intracellular accumulation
of manganese. H2O2 causes DNA damage and oxidation of proteins. Catalases, NADH
peroxidases and reductases can eliminate this ROS. At last, formation of the extremely
reactive hydroxyl radicals may be prevented by quenching H2O2 or sequestering free iron
(Imlay 2002; Klijn 2005a). Klijn (2005a) showed that the response to oxidative stress of
B. longum NCC2705 includes intracellular accumulation of manganese and up-regulated
expression of genes coding for alkylhydroperoxide subunit C, thioredoxin, glutaredoxin
and the ferritin-like protein Dps. Additonally, the specific role of proteins like BL1626 (a
class I pyridine nucleotide-disulphide oxidoreductase superfamily), BL0460 (a possible
OxyR-type regulator) and BL0409 (a putative manganese transporter) in the oxidative
stress response remains to be established.
35
1.5 Methods to improve cell viability
The most important aspect of the functionality of probiotic cultures is their ability to
promote human health at the site of action. Although some studies show that dead
probiotic cells may mediate physiological benefits, most of the studies with probiotic
cells have been performed with live cells and data on non-viable preparations is often
limited (Ouwehand and Salminen 1998). The e!ects of dead cells as probiotics are
probably limited to the release of antimicrobial compounds and stimulation of the
immune system (Ouwehand and Salminen 1998; van Baarlen et al. 2009). Additionally,
according to the widely accepted definition of probiotic by a joint FAO/WHO working
group (2002) probiotics must be alive. Therefore it is crucial that cells survive the acid
conditions of the stomach and the exposure to bile salts in the small intestine in sufficient
numbers in order to be effective. The efficient delivery of live cultures at their site of
action represents a major challenge in probiotic product development. Industrial
standards require that products claiming health benefits contain a minimum of 106 viable
probiotic bacteria per gram of product when consumed in order to achieve a specific
health effect and/or to provide bacterial concentrations that are technologically attainable
and cost effective (Lacroix and Yildirim 2007). However, large scale production and
subsequent storage of probiotic lactobacilli and bifidobacteria presents a major bottleneck
in the realization of their commercial potential, because of high losses in viability due to
confrontation with various stresses (Ross et al. 2005). Moreover, most probiotic strains
are intestinal isolates and therefore obligate anaerobe and difficult to cultivate. For all
these reasons, the ability of probiotics to tolerate heat, osmotic and oxygen stress is an
important property for successful incorporation of probiotic bacteria into functional
foods.
36
Probiotic cultures can be protected by encapsulation and by addition of protective
compounds. Different encapsulation methods have been applied to probiotics: spraycoating, extrusion, emulsion and gel-particle technologies for protection against various
stresses, such as heating, freezing, exposure to gastric and bile solutions and for
improving survival during storage (Picot and Lacroix 2004; Doleyres and Lacroix 2005;
Champagne 2006). These techniques have been recently reviewed by Champagne and
Fustier (2007). Addition of protective compounds during growth or prior to further
processing has been investigated mainly in regard to survival to spray and freeze drying.
Many compounds, including for example trehalose, sucrose, gum acacia, gum arabic and
starch were shown to have protective effects (Desmond et al. 2002; Lian et al. 2002;
Saarela et al. 2005; Morgan et al. 2006; Termont et al. 2006). Additives such as
carbohydrates, proteins and polymers protects against drying because they promote the
formation of a glassy state, thereby inhibiting crystallization and concentration of waste
products from the cells (Morgan et al. 2006). Furthermore, the physiological state of the
probiotic cultures added to a product can also be a major factor affecting culture viability.
Stress tolerance of cells can be induced by exposition to moderate stresses inducing
tolerance to homologous or other stresses (cross-protection). In this respect, the induction
of stress responses in probiotic strains can have an effect on the ability of cultures to
survive during processing (e.g. freeze drying and spray drying) and gastric transit (Ross
et al. 2005).
37
1.5.1 Application of sublethal stresses to exploit stress response
mechanisms to improve technological performance of
bifidobacteria
Recently, research efforts have focused on understanding the stress response mechanisms
of lactobacilli and bifidobacteria in order to improve their capacity to survive and to
function under industrial production conditions and after ingestion.
Acid-tolerance of bifidobacteria varies widely, but may be significantly increased by
application of sublethal stress. B. lactis showed an increased acid-tolerance (at pH 3.5 in
synthetic gastric fluid) after the pH was decreased to 5.2 in early stationary phase and
cells experienced starvation (Maus and Ingham 2003). However, sublethal stress may
also result in decreased cell survival, for example acid and heat pretreatment impaired the
acid tolerance of B. longum (Saarela et al. 2004).
Adaptation to bile salts as well as cross protection against bile salts were found in some
Bifidobacterium strains. In B. longum and B. adolescentis preconditioning with bile salts
protected against otherwise lethal bile salts concentrations (Schmidt and Zink 2000). In
an other study B. animalis cells tolerated more bile when pretreated at 47°C or at pH 3.5
and B. longum showed a similar effect, although the improved resistance to bile was not
statistically significant in this strain, showing that optimization capability is strainspecific (Saarela et al. 2004).
Microorganisms exposed to a moderate heat treatment can acquire the transient ability to
withstand subsequent lethal heat challenges (Girgis et al. 2002) and the control of such
resistance of probiotic bacteria has potential practical benefits for industrial processes in
which bacteria with high thermotolerance are required (Ross et al. 2005). B. adolescentis
was able to survive an otherwise lethal temperature when subjected to a heat stress
pretreatment or, salt stress pretreatment (Schmidt and Zink 2000). Similarly, B. longum
stationary phase cells pretreated at 47°C tolerated clearly better 55°C compared to nonsublethally treated cultures (Saarela et al. 2004).
38
Adaptation to osmotic stress in bifidobacteria or lactic acid bacteria was only investigated
to some extent. In B. adolescentis salt pretreatment resulted in increased tolerance after
freeze–thawing cycles or lethal heat stress, however this was not the case in B. longum
(Schmidt and Zink 2000). Recently, it was observed that osmotic stress induced by salt
increased survival to lyophilization of Lactobacillus delbrueckii subsp. lactis (Koch et al.
2007).
Another stress that probiotics encounter during preparation and storage of functional food
is oxygen stress. Viability of micro-organisms in fermented dairy foods is strongly
influenced by oxygen content in the product in addition to oxygen permeation through
the package (Talwalkar and Kailasapathy 2004). To date adaptation to oxidative stress
has not yet been investigated in bifidobacteria.
1.6 Fermentation basic principles
1.6.1 Batch operation
The most common industrial fermentation is batch fermentation. In this process, a reactor
is first loaded with medium, inoculated with the selected microbial strain(s), and
fermentation is operated until the required cell density or optimum product
concentrations are achieved. The bioreactor content is subsequently discharged and the
bioreactor is prepared for a new charge of medium. It is only during cell growth or
product production, that the bioreactor is productive. During the period of cell growth no
additional material is either added to or removed from the bioreactor, apart from minor
adjustments for pH- or foam-control, small additions of essential precursors, the removal
of samples and, continuous supply of air in the case of an aerobic fermentation. Since
there is no flow in or out of the bioreactor concentrations of biomass, nutrients and
products change in time and various constituents are either produced or consumed (Dunn
et al. 2003).
39
1.6.2 Continuous operation
In continuous operation fresh medium is continuously added to the bioreactor, whereas
simultaneously depleted medium is continuously removed at identical rate. The depleted
material contains any products that have been excreted by the cells and, in the case of
suspended-cell culture, also contains effluent cells from the bioreactor. After a transient
period in which conditions within the bioreactor change in time, a steady state is
achieved, characterized by constant conditions, both within the bioreactor and at the
bioreactor outlet (Dunn et al. 2003).
In continuous culture the specific growth rate of an organism, relative to its theoretical
maximum, is governed by the external substrate concentration of a limiting nutrient,
allowing uncoupling of growth from the transient conditions encountered in batch
culture. Addition of fresh medium to the culture would allow growth to proceed at a
given rate indefinitely. Since growth of new cells is balanced by those washed out, the
growth of new biomass is equal to the rate at which the culture is being diluted
(Hoskisson and Hobbs 2005): Therefore, in steady state, the growth rate is a function of
the dilution rate, provided that the growth rate is below the critical dilution rate (Dc). Dc is
the rate at which the steady-state biomass concentration becomes zero. That is, if Dc is
higher than the maximum specific growth rate (µmax) of the organism under the given
conditions then all cells wash out of the reactor.
Continuous culturing has some disadvantages over batch culture (Table 4). However, the
recent trend toward global (post-genomic) assessments of microbial processes has led to
the more frequent use of continuous cultures. The advantage of using continuous cultures
in such studies lies in the removal of secondary growth effects, as found in batch cultures,
that may mask subtle physiological changes, revealing real biologically relevant trends,
and giving confidence in the data obtained. Additionally, continuous cultures in steady
state have constant conditions making it possible to produce cells with constant
physiology. The biological significance of continuous culture is occasionally questioned;
however, many natural microbial systems, such as the mouth and the gut, can be
considered as approaching chemostats (Hoskisson and Hobbs 2005).
40
Table 4 Comparison of batch and continuous cultures (Dunn et al. 2003)
Mode of operation
Batch
Advantages
Equipment simple. Suitable for
small production.
Continuous
Provides high production. Better
product quality due to constant
conditions. Good for kinetic
studies.
Disadvantages
Downtime for loading and
cleaning. Reaction conditions
change with time.
Requires flow control. Culture
may be unstable over long
periods.
1.6.3 Immobilized cells
The immobilization of cells can be defined as “the physical confinement or localization
of intact cells to a certain region of space without loss of desired biological activity” (ElMansi et al. 2007). Immobilized cell systems can be classified into four categories (ElMansi et al. 2007):
1) Surface attachment of cells. Absorption to a support material can be achieved
naturally (via the Van der Waals forces and ionic interactions) or induced
artificially using linking agents (metal oxides or covalent bonding agents such as
glutaraldehyde)
2) Entrapement within porous matrices through in situ immobilization in presence of
the porous matrix (i.e. gel) or by allowing the cells to move into a preformed
porous matrix. Cells incorporated into porous gel spheres or lodged in porous
resin, steel mesh, and glass beads.
3) Containment behind a barrier. The barrier can be either preformed (hollow fiber
and flat membrane reactors) or formed around the cells to be immobilized
(microcapsules and two-phase entrapment).
4) Cell agglomerated together either chemically (glutaraldehyde) or naturally
(microbial flocs)
Cell entrapment in food-grade biopolymer gel matrices (e.g. k-carrageenan, alginate and
gellan) has been most widely used for food applications (Lacroix et al. 2005). Diverse
culturing technologies, including different applications with immobilized cells, for the
production of probiotics with high viability and functionality have been reviewed
41
recently (Lacroix and Yildirim 2007). Immobilized cells have numerous advantages over
free-cell cultures: high cell densities, reuse of biocatalysts, higher resistance to
contaminations and bacteriophages, improvement of plasmid stability, prevention of
washing-out during continuous cultures, and the physical and chemical protection of cells
(Lacroix et al. 2005). Cell growth occurring in the peripheral layers of gel beads has been
shown to give a high rate of cell release into the culture broth, as a result of high pressure
owing to cell expansion, collisions and shearing forces in the bioreactor, leading to an
efficient inoculation of the medium (Lamboley et al. 1997).
Cell immobilization in probiotic production was tested with B. longum cells immobilized
in gellan gum beads. It allowed production of high cell concentrations in continuous
culture and a fourfold increased volumetric productivity compared to free-cell batch
cultures at optimal pH (Doleyres et al. 2002). Furthermore it was shown that
immobilization of a mixed culture containing a dominant Lactococcus lactis strain and a
less competitive B. longum strain allowed stable continuous production of concentrated
mixed cultures (Doleyres et al. 2004a).
42
1.7 Transcriptomics
The transcriptome is the set of all messenger RNA (mRNA) molecules, or "transcripts,"
produced in one or a population of cells. Because it includes all mRNA transcripts in the
cell, the transcriptome reflects the genes that are being actively expressed at any given
time, with the exception of mRNA degradation phenomena (Wang et al. 2009). For this
reason the transcriptome of a cell contains information on the biological state of the cell.
Additionally, since many cellular processes are regulated at the transcriptional level it
contains also information on the genes playing a role in a definite situation.
Transcriptomics studies the effect of specific conditions on alterations in the expression
levels of large numbers of genes. To realize this, the transcripts present in cells obtained
from different samples are quantified by microarray analysis (Figure 4). Using
transcriptomic it is possible to monitor the whole genome on a single chip so that
researchers can have a picture of the interactions among thousands of genes
simultaneously. Since the expression levels are determined for all the genes on the
microarray, this method is highly unbiased. This is an important advantage over
traditional methods, which generally work on a "one gene in one experiment" basis in
process driven by hypothesis based on prior knowledge (Brown and Botstein 1999).
Therefore transcriptome analysis can give new insights into general cellular mechanisms,
for example into how bacteria cope with environmental stresses. Within the genus
Bifidobacterium the first genome sequence, that of B. longum NCC2705, became publicly
available in 2002 (Schell et al. 2002) and a microarray covering its whole genome is
available at Nestlé Research Center in Lausanne, Switzerland.
43
1.7.1 Microarray analysis
An array is a small glass slide containing thousands of spots in an orderly arrangement.
Usually each spot represents one gene of the strain of interest and consists of a gene or
gene fragment that has been spotted or printed on the slide. It provides a medium for
matching known and unknown DNA samples based on base-pairing or hybridization
rules (i.e., A-T and G-C for DNA; A-U and G-C for RNA). There are two major
application forms for the DNA microarray technology: 1) Identification of sequence
(gene / gene mutation); and 2) Determination of expression level (abundance) of genes.
For the second application (i.e. determination of expression level) RNA is isolated from
cells grown or incubated under conditions of interest, after which it is converted into
labeled cDNA or amplified RNA. The labeled cDNA’s are hybridized to the microarray.
In a certain type of microarrays (e.g. Affymetrix) labeled cDNA from a single sample is
hybridized onto one microarray, in others (e.g. Agilent 2-color microarrrays) two
samples, usually labeled with fluorescent Cy3 and Cy5, are co-hybridized on one
microarray (Figure 4). Since the labeled cDNA’s will hybridize to the equivalent spots on
the microarray, the total amount of signal from each spot is a measure for the level at
which the corresponding genes were expressed (Pieterse 2006).
44
1) Array hybridization
2) Signal quantification
and data filtering
Spot
1
2
3
4
5
6
.
.
x
Flag
0
0
0
0
1
0
.
.
3
Background
control
3
5
5
3
1
2
.
.
1
Signal control
42936
44189
47645
42436
6
41475
.
.
36976
Signal test
sample
3518
6595
1547
1698
65
6437
.
.
9
Background
test sample
5
3
5
6
2
5
.
.
2
4) Data analysis
60.0
40.0 ***
*
**
°
°
20.0
*
**
**
*
*
S
*
G
I
R
**
Q
F
** *
P
H
E
°
CO
*
*
**
*
**
-40.0
G
C
O
T
U
V
*
°
N
M
L
A
**
no
-20.0
D
J
0.0
K
M (log2(test/control))
% differentially expressed genes
3) Normalization
***
-60.0
°
-80.0
.
<=6891
<=66>>
<=61.6
<=689.
<=6.:8
1
<=6:;;
<=6..?
<=1:69
<=6.;>
<=6:89
<=1>1:
<=6771
<=6778
<=1;:>
<=116:
<=19;:
<=6169
<=6:;:
<=66>?
<=19;9
<=19:.
6
<=161:
A (!(log2control + log2test))
<=6.?>
<=1>6?
<=6917
<=6;>1 <=11.:
<=6;>.
<=1:1:
<=1?:?
<=68..
51
<=6.?8
<=666;
<=6;;;
<=618>
<=6;;1
<=1::9
<=6??8
<=11.;
<=6;8;
<=1?:7
<=6187
<=1198
<=1>;.
<=6??7
<=1?:>
5.
7
8
16
11
1.
19
1:
1;
!"#$%&$'($!)*$+,-$.$/0-1$0%+203+$4
Figure 4 Main steps of 2-color DNA microarray analysis
45
1.7.2 Signal quantification and data filtering
After hybridization, the fluorescent signals and background signals from the different
labels in the different spots on the array are quantified by confocal laser scanning. After
the quantification of the signal the data are filtered according to their quality (signal to
background ratio, homogeneity and saturation of the spots). Data from the unreliable
spot, or in extreme cases from the complete microarray, may be removed from the
dataset.
1.7.3 Normalization
The next step in the data handling is normalization of the data. There are a number of
reasons why data must be normalized, including unequal quantities of starting RNA,
differences in labeling or detection efficiencies between the fluorescent dyes used, and
systematic biases in the measured expression levels (Quackenbush 2002). The most
frequently used normalization approach, is the LOWESS normalization (Cleveland
1979). LOWESS is a locally weighed scattered plot smoother. It detects systematic
deviations in the ratio to intensity plot and corrects them by carrying out a local weighted
linear regression as a function of the log10 (intensity) and subtracting the calculated bestfit average log2 (ratio) from the experimentally observed ratio for each data point
(Quackenbush 2002).
1.7.4 Data analysis
After data normalization, a large set of data containing significant expression and foldchange of expression values for each gene need to be interpreted. Mainly, there are two
approaches to analyze these data, an unsupervised and supervised approach (Gollub and
Sherlock 2006). The unsupervised approach consists in cluster analyses and is
independent of biological knowledge. Biological interpretation of these data is based on
the assumption that similar expression patterns indicate related biological function
(Brazma and Vilo 2001). Example of unsupervised approaches often used in microarray
analyses are hierarchical clustering, K-means clustering and selforganizing- maps
46
(SOM), and principle component analysis (PCA) (Ehrenreich 2006). These methods may
generate significantly different results because the underlying mathematical methodology
differs. In contrast to the unsupervised, the supervised approach compares the data with
existing knowledge. For example, microarray data can be plotted on genomic maps using
softwares as e.g. the microbial genome viewer (Kerkhoven et al. 2004). Alternatively,
microarray data can be plotted on metabolic maps using the online database
encyclopaedia of genes and genomes KEGG (http://www.genome.ad.jp/kegg/) (Kanehisa
1997; Stevens 2008).
47
1.8 Thesis outline
Central issues in the application of probiotics as food additives are their fastidious
production and their sensitivity to environmental stresses. Furthermore, it is essential that
probiotic bacteria are alive and present at high concentrations in the final product for
most of their beneficial health effects on the host.
One possibility to produce more robust probiotics against typical stresses encountered
during food production and storage is to expose the cells to sublethal stresses during
production. Cell responses are strain-dependent and vary with applied stresses (Maus and
Ingham 2003; Saarela et al. 2004; Simpson et al. 2005). However, the optimization
procedure for sublethal stress application is generally performed using batch cultures,
which can be very time consuming and can only be used for testing a limited number of
conditions. Continuous cultures could be a suitable and more efficient method to test
different stress factors on one culture instead of repeating several batch cultures (Lacroix
and Yildirim 2007), but this strategy has never been investigated. The prerequisite for
using continuous cultures for stress screening purposes during the same culture
experiment is the physiological stability of continuously produced cells.
Another possibility to produce more robust probiotics is by selection of resistant strains
after growth under selective pressure. Resistance to oxidative stresses, such as hydrogen
peroxide, is of particular interest in bifidobacteria, because oxidative stresses can
severely compromise production at industrial scale of sensitive strains as well as their
incorporation into food products.
Bifidobacterium longum NCC2705 is an ideal model organism for both approaches. Its
genome was completely sequenced (Schell et al. 2002), and an oligo-based microarray
was developed by Nestlé. Using this microarray, the transcriptional response of B.
longum NCC2705 has been well characterized, particularly into processes such as stress
response, metabolic control, and regulatory mechanisms (Klijn 2005a). This knowledge
was applied for the screening and application of stresses in this dissertation.
48
All this considered, the general objective of this work was thus to produce stress adapted
cells of B. longum NCC2705 with continuous and batch cultures. More specifically, the
objectives were:
1) Develop and validate a new screening method for sublethal stresses using
continuous culture
2) Identify effective conditions for sublethal stress application
3) Isolate stress resistant strains using continuous culture and immobilized cell
technology
Hence, the dissertation was organized as follows: in chapter 2, the question of
physiological stability of B. longum NCC2705 under continuous culture conditions was
addressed using physiological tests combined with transcriptomic analysis. In chapter 3,
continuous culture was used for controlled application and efficient screening of
sublethal stress conditions. This new approach was validated in a two stage continuous
culture with B. longum NCC2705 cells and results were compared with classical batch
cultures. Finally in chapter 4, continuous culture in combination with immobilized cells
was applied for producing probiotic bacteria with enhanced technological and
physiological characteristics. More specifically, a new method for selection of resistant
bifidobacteria cells to hydrogen peroxide using continuous culture and immobilized cell
technology was evaluated.
49
2 Physiological stability of Bifidobacterium longum
NCC2705 under continuous culture conditions
2.1 Abstract
The biological stability of a continuous culture of Bifidobacterium longum NCC2705 was
investigated to assess the potential of this culture mode for screening of sub-lethal
stresses promoting stability of probiotic bacterial strains. A continuous culture was
maintained for 211 h at a dilution rate of 0.1 h-1, mimicking a late-exponential growth
phase culture. Biological stability over time was assessed by measurement of
physiological parameters (i.e. biomass production, sugar metabolism, resistance to
different stress factors) and by genome-wide transcriptional profiling. Stable viable cell
counts were measured over the 211 h culture period, decreasing only moderately from 8.8
to 8.6 log10 CFU ml-1. A slight shift in production of metabolites, characterized by
increased lactate and decreased acetate, formate and ethanol concentrations, was also
observed. Measurements of different antibiotic susceptibilities and stress conditions
showed either stable (cefotaxim, ampicillin, ceftazidime) or only moderate changes
(simulated gastric juices, heat, bile salts, tetracycline, chloramphenicol, penicillin,
vancomycin and neomycin) over culturing time. Comparison of gene transcription
profiles between samples collected after 31 h of continuous culture and samples collected
after 134 and 211 h revealed only limited changes in expression of 1.0 and 3.8 % of total
genes, respectively. Based on these results we propose that continuous culture can be
used to produce bacterial cells displaying stable physiological properties suitable for fast
and efficient screening of sub-lethal stress conditions.
2.2 Introduction
Probiotics are defined as “living micro-organisms which, when administered in adequate
amounts (as part of food), confer a health benefit to the host” (FAO/WHO 2002). The
most commonly used probiotic strains in functional foods belong to the genera of
50
Lactobacillus and Bifidobacterium. Members of these genera, such as Bifidobacterium
longum, are major colonizers of the human gastro-intestinal tract (Vaughan et al. 2002).
A central issue in the use of probiotics in food and food supplements is their sensitivity to
many environmental stress factors. It has been recommended that probiotic food products
should contain at least 106-107 viable cells per gram or ml at the time of consumption in
order to achieve a specific health effect and/or to provide bacterial concentrations that are
technologically attainable and cost effective (Champagne et al. 2005; Lacroix and
Yildirim 2007). Probiotic bacteria must also survive the harsh environment of the
gastrointestinal tract. In this context, a better understanding of underlying survival
mechanisms and stress responses of probiotic cells, e.g., encountered during production,
storage, ingestion and passage through the gastrointestinal tract is fundamental in
production process resolutions leading to improved probiotic stability.
Several approaches have been recently proposed for enhancing probiotic cell viability
under adverse conditions (Ross et al. 2005). It was reported that the resistance of cells to
a lethal stress can be improved by application of homologous or heterologous sub-lethal
stress during culture (Doleyres and Lacroix 2005). Culture conditions must be determined
for each strain tested because cell responses are strain dependant and vary with applied
stresses (Maus and Ingham 2003; Saarela et al. 2004; Simpson et al. 2005). This
screening procedure is generally performed using batch cultures. Continuous cultures
could be a suitable and more efficient method testing different stress factors on one
culture instead of repeating several batch cultures (Lacroix and Yildirim 2007). A
possible design for this system could be a two-stage culture process in which sub-lethal
stressing conditions are applied in the second stage, continuously fed by cells from the
first reactor which can be used as non adapted control cells. This system can stabilize
rapidly after changing conditions in the second reactor, allowing screening of several
sub-lethal stresses in one culture experiment and a short time frame (Lacroix and
Yildirim 2007). In addition, bacterial growth rate can be accurately controlled in
continuous culture by setting the dilution rate (Hoskisson and Hobbs 2005). However,
before testing stresses using continuous cultures, the physiological stability of
continuously produced cells over a considered time period must be first evaluated.
51
In this study, the effect of continuous culture time on cells of B. longum NCC2705, a
probiotic model strain whose genome has been sequenced (Schell et al. 2002) was
evaluated by monitoring physiological parameters including biomass production, sugar
metabolism and resistance to stresses and combined with genome wide expression
analysis.
2.3
Material and methods
2.3.1 Strain and growth conditions
B. longum NCC2705 was obtained from the Nestlé Culture Collection (NCC) and
cultivated in MRS (De Man et al. 1960) medium (Biolife, Milano, Italy) supplemented
with filter sterilized cysteine at a final concentration of 0.5 g l-1 (C-MRS). Two
consecutive pre-cultures were performed at 37ºC for 16 h under anaerobic conditions
(AnaeroGen, Oxoid, Basingstoke, United Kingdom).
2.3.2 Continuous culture experiment
A continuous culture was carried out in a 2.5-l reactor (Bioengineering AG, Wald,
Switzerland), equipped with a Biospectra control system (Biospectra AG, Schlieren,
Switzerland) and containing 2 l of C-MRS inoculated with 2 % (v/v) preculture.
The temperature was maintained at 37°C and the pH at 6.0 by addition of 5 M NaOH.
The culture was stirred constantly at 250 rpm using two rushton type propellers.
Anaerobic conditions were maintained by flushing the headspace of the reactor with CO2.
After 8 h in batch mode the culture was run in continuous mode at a dilution rate of 0.1 h1
. Fresh medium was added using a peristaltic pump (Alitea, Bioengineering AG, Wald,
Switzerland), and fermented broth harvested with a second peristaltic pump (Alitea,
Bioengineering AG, Wald, Switzerland) set at a slightly higher flow rate. A stabilization
period of 90 h (corresponding to nine reactor volume changes) was operated prior culture
monitoring (t=0). Samples were collected three times a day for cell counts, viable cell
percentages, metabolites production and cell resistance to stresses. Cells for stress tests
were prepared by centrifuging 20 ml samples at 6,000 g, 4°C for 15 min. The pellet was
52
resuspended to its initial volume in fresh C-MRS supplemented with 10 % (w/v) glycerol,
aliquoted in 2 ml, snap frozen in liquid nitrogen, and stored at -80°C for stress test
experiments. Aliquots of 2 ml taken at t=31, 134 and 211 h were centrifuged (4,000 g, 1
min, room temperature) for transcriptomic analysis. Supernatants were discarded and cell
pellets snap frozen in liquid nitrogen and stored at -80ºC until RNA-extraction. Samples
were centrifuged at 4,000 g for 1 min at room temperature and the supernatants were
frozen at -80°C for HPLC analysis of glucose, organic acids and ethanol.
2.3.3 Viable cell enumeration and viability assessment
For viable cell counts, fresh samples were diluted in phosphate buffer saline 1x (pH 7.7)
supplemented with 0.05 % cysteine (C-PBS), appropriate dilutions were plated in
duplicate on C-MRS agar and incubated anaerobically at 37°C for 48 h.
Cell viability was also assessed using flow cytometry. To determine total and non viable
cells, culture samples (2 ml) were centrifuged 1 min at 4,000 g at room temperature,
washed with C-PBS, centrifuged again, resuspended and diluted 1:1000 in C-PBS. To
500 $l of the cell suspension, 0.5 $l SYBR Green I (10,000X, Molecular Probes,
Invitrogen, Basel, Switzerland) and 20 $l 7AAD 0.0005 % w/v (Viability Dye, Beckman
Coulter, Nyon, Switzerland) were added. The mixtures were incubated for 15 min in the
dark and then analyzed using a Cytomics FC 500 flow cytometer (Beckman Coulter
International SA; Nyon, Switzerland) equipped with an air-cooled argon ion laser
emitting 20 mW at 488 nm combined with a 635 nm red-diode laser and the standard
filter setup. The forward and side scatter signals were used as trigger signal in the 488 nm
band-pass filter. The green fluorescence of SYBR Green I was detected through a 525 nm
band-pass filter (FL 1 channel) and the red fluorescence of 7AAD collected in the FL 4
channel through a 675 nm band-pass filter. The rate settings were adjusted to keep the
count to approximately 3,000 events s-1. Data were collected on a logarithmic scale and
analyzed using the CXP software (Beckman Coulter International SA, Switzerland).
Discrimination between viable and non-viable cells was carried out according to
fluorescence intensities of both dyes.
53
2.3.4 HPLC analysis
Concentrations of glucose, organic acids (lactate, acetate and formate) and ethanol in the
broth samples were determined by HPLC. One ml of supernatant sample was diluted 1:5
in MilliQ water and filtered through a 0.45 µm nylon membrane filter (Infochroma, Zug,
Switzerland). Separation of compounds was carried out using an Aminex HPX-87-H
column (Bio-Rad Laboratories, Reinach, Switzerland) with 10 mM H2SO4 as eluent at a
flow rate of 0.6 ml min-1 and a temperature of 40°C. Compounds were detected using a
refractive index detector (Merck Hitachi, Darmstadt, Germany). Reported data are means
of duplicate analysis.
2.3.5 Survival tests
The parameters for survival tests were adjusted according to literature and results from
preliminary experiments in order to obtain losses in cell concentrations between 1 and 3
log10 units during the tests.
Bile salts
Bile salts tolerance was assessed according to Saarela et al. (2004) with slight
modifications. Porcine bile extract (Sigma-Aldrich, Buchs, Switzerland) was used to
simulate human bile (Mallory et al. 1973). A 2 ml bacterial culture sample was thawed at
room temperature for 30 min and subsequently centrifuged at 4,000 g for 2 min at room
temperature. The pellet was washed with C-PBS, centrifuged again, resuspended in 2 ml
C-PBS and cooled on ice for 30 min. A volume of 30 $l of cell suspension was added to
270 $l of filter sterilized 1.5 % porcine bile extract in C-PBS in a 96-well microtiterplate
(Orange Scientific, Braine-l’Alleud, Belgium) and incubated anaerobically (AnaeroGen)
at 37°C for 10 min. Cell counts before and after stress application were determined by
plating on C-MRS agar appropriate dilutions of cell suspension in C-PBC.
54
Gastric juice
Cell survival in simulated gastric conditions was determined according to Charteris et al.
(1998b). Two ml samples were thawed at room temperature for 30 min and centrifuged
(4,000 g, 2 min, room temperature). The pellets were washed, resuspended in 2 ml 0.1 %
(w/v) filter sterilized peptone (Becton Dickinson, VWR International AG, Dietikon,
Switzerland) and cooled on ice for 30 min. A volume of 30 $l of cell suspension was
added to 270 $l of filter sterilized simulated gastric juices containing 0.5 % (w/v) NaCl,
0.3 % (w/v) pepsin (0.7 FIP-U mg-1) from porcine gastric mucosa (Merck, Zug,
Switzerland) at pH 2.8 in a 96-well microtiterplate. After addition of the suspension the
pH increased to 3.1. Following incubation at 37°C under anaerobic condition
(AnaeroGen) for 15 min, the gastric juice-cell mixture was 10-fold serially diluted in CPBS to neutralize the acidic pH and plated on C-MRS agar. Cell counts were also
determined before stress application.
Heat
Heat survival tests were carried out according to Simpson et al. (2005). Two ml samples
were centrifuged (4,000 g, 1 min, room temperature), washed and diluted in C-PBS to a
final concentration of 106 - 107 cells ml-1. One hundred µl of the diluted sample was filled
into a 200 µl PCR tube and kept on ice for 30 min. Heat stress was applied in a
thermocycler (Biometra T-personal, Biolabo Scientific Instruments SA, Chatel-St.-Denis,
Switzerland) at 56°C for 5 min. After heat stress, samples were immediately cooled
down by storing on ice for 15 min. Samples were then diluted five folds in C-PBS and
analyzed by flow cytometry. Data are expressed as loss in percentage of live cells.
55
Antibiotic
Antibiograms were determined as previously described by Doleyres et al. (2004b) using
an antimicrobial disc susceptibility assay, with some modifications. Samples were diluted
in C-MRS to reach a final concentration of about 106 CFU ml-1 and plated with a cotton
bud on C-MRS agar plates. After drying the plates, antibiotic discs (0.6 cm diameter)
containing neomycin (10 $g), cefotaxime (30 $g), ampicillin (10 $g), penicillin G (10
$g), chloramphenicol (30 $g), vancomycin (30 $g), ceftazidime (30 $g) or tetracycline
(30 $g) were added onto the surface. The inhibition zone was measured after incubation
under anaerobic conditions at 37°C for 48 h.
2.3.6 Microarrays
Microarray design and RNA extraction
DNA based arrays, produced by Agilent Technologies (www.agilent.com), were obtained
by in situ synthesis of 60 mer oligonucleotides on glass slides (Wolber et al. 2006). For
each gene, 3 to 6 different probes were randomly distributed on the array. Total RNA was
extracted with the Macalo%d method and purified as previously described (Parche et al.
2006).
Array hybridization
For each hybridization, cDNA was synthesized starting from 4 $g of total RNA and
subsequently labeled using the Array 900MPX Genisphere kit (Genisphere Inc., Hatfield,
PE, USA), following the protocol provided by the supplier. Luciferase and kanamycin
control mRNA (Promega, Zurich, Switzerland) at 1 and 10 ng, respectively, were mixed
with total RNA before labeling to allow balancing of the two channels during scanning.
After the hybridization procedure, array slides were scanned at 10 µm using a Scanarray
4000 (Packard Biochip Technologies, Billerica, MA, USA). Parameters (laser power and
photomultiplier tube gain) were set in order to prevent saturation of any spot, except the
probes corresponding to rRNA.
56
Array analysis
Data extracted with Imagene 5.6 (Biodiscovery, El Segundo, CA, USA) were treated with
homemade scripts in Python language (www.python.org) and a local installation of the
ArrayPipe web server (Hokamp et al. 2004). Probes showing a signal smaller than twice
the standard deviation of the local background were considered without signal. Probes
showing no signal or saturated signals in both channels were discarded from the analysis.
Assuming an intensity-dependent variation in dye signal, (limma) loess global
normalization was applied on signal ratios. To calculate average gene expression values,
data from different probes and hybridization duplicates (with dye swap) were combined
as follows. Within each hybridization data set, gene fold changes were calculated from
the median of the corresponding probes values. The expression value of a gene was
retained if a signal was detected in at least 50 % of its probes. The average gene
expression values were then calculated by combining data from two independent
hybridizations. Genes were considered to be differentially expressed if their log2transformed signal ratios were higher than 1.5 or smaller than -1.5. The data have been
deposited in NCBI's Gene Expression Omnibus and are accessible through GEO Series
accession number GSE14896.
Classification of B. longum genes into functional categories and operon prediction
B. longum NCC2705 genes were classified into clusters of orthologous groups (COG)
according to Rezzonico et al. (2007). Briefly, percentages of differentially expressed
genes in each COG functional category were calculated by dividing the number of
induced/repressed genes in each category by the total number of retained genes in the
corresponding category. B. longum genes organized in operons were identified using the
method published by Price et al. (2005) (http://www.microbesonline.org/operons/
OperonList.html). Statistical analysis of the differential expression observed in each COG
category was based on hyper-geometric distribution. The p-values assigned to the
different COG categories express the significance of the difference observed between the
number of differentially expressed genes measured in a given COG category and the
overall level of differential expression.
57
2.3.7 Statistical analysis
The effect of culture time on cell numbers, metabolite concentrations and survival rate to
stresses was tested with regression analyses using SigmaPlot 9.0 (Systat Software Inc.,
USA) and t-tests. The slope of the regression curve over time was tested for its difference
from 0 using a t-statistic test. The tested parameters were considered to change over time
when the regression slope had a p-value smaller than 0.05. A t-test was performed for
each parameter between the first 3 samples collected during the first 30 h of fermentation
and the last 3 samples collected during the last 30 h of fermentation. Data with p-values
smaller than 0.05 were considered to be significantly different.
58
2.4 Results
2.4.1 Growth parameters and metabolism
Cell production and sugar metabolism of B. longum NCC2705 during 211 h continuous
culture are presented in Figures 5 and 6, respectively. During culture, viable cells counts
and viability percentages decreased from 8.8 to 8.6 log10 CFU ml-1 (p=0.0020) and from
95.1 to 92.1 % (p=0.0050), respectively (Figure 5). Glucose, initially present at 14.0 ± 0.2
g l-1 in the fresh medium, was totally consumed and not detected by HPLC in the
fermented broth (detection limit of 0.2 g l-1). The concentration of the main metabolite,
acetic acid, decreased from 9.2 to 8.4 g l-1 (p=0.0223) between 0 and 211 h of continuous
culture, while lactic acid production increased from 1.3 to about 2.8 g l-1 during the first
130 h (p <0.0001) and then decreased slightly but significantly (p=0.0052) to 2.2 g l-1 at
211 h (Figure 6). During the same period formic acid and ethanol concentrations also
slightly but significantly decreased from 2.5 to 2.2 g l-1 (p=0.0003) and from 1.0 to 0.8 g
l-1 (p=0.0013), respectively.
59
Figure 5 Viable cells counts of B. longum NCC2705 measured with plate counts (!) and cell viability
measured with flow cytometry (percentages of viable (") and non-viable (#) cells) during 211 h
continuous culture. Time effects were tested by linear regression analyses. Sampling times (i.e. 31,
134 and 211 h) for cell transcriptomic analyses are indicated by vertical lines (---). Time 0 on the
graph corresponds to time after 90 h stabilization of continuous culture.
Figure 6 Concentrations of lactic (#), formic ($) and acetic (%) acids and ethanol (&) during
continuous culture of B. longum NCC2705 and time effects tested by linear regression analyses.
Sampling times (i.e. 31, 134 and 211 h) for cell transcriptomic analyses are indicated by vertical lines
(---). Time 0 on the graph corresponds to time after 90 h stabilization of continuous culture.
60
2.4.2 Cell survival during stress tests
Cells collected at different time points were exposed to various stress conditions
including simulated gastric juices, heat, bile salts, and to different antibiotics to analyze
the physiological stability of the culture over time. A slight but significant increase of
bacterial susceptibility to gastric (p=0.0340) and heat (p=0.0266) stresses was measured
with increasing culture time (Figure 7). In contrast, the resistance to bile salts stress
increased (p=0.0193) over time, characterized by a reduction of bile salts-induced loss of
viability from 4.0 to 2.9 log10 CFU ml-1 between 0 and 211 h of culture (Figure 7).
The bacterial suceptibility to the !-lactam antibiotics cefotaxim, ampicillin and
ceftazidime remained constant over culture time, with inhibition zones of 3.8 ± 0.3, 3.9 ±
0.2 and 4.1 ± 0.2 cm, respectively. A slight but significant increase in the susceptibility to
tetracycline (inhibition zones increasing from 4.1 to 4.6 cm, p<0.0001), chloramphenicol
(from 3.9 to 4.4 cm, p=0.0006), penicillin (from 3.9 to 4.3 cm, p=0.0020), and
vancomycin (from 3.4 to 3.6 cm, p=0.0368) was observed over culture time (Figure 8). In
contrast, the tolerance of B. longum NCC2705 cells to neomycin increased with culture
time, illustrated by a decrease of the inhibition zone from 1.0 to 0.6 cm (p=0.0001)
(Figure 8).
61
Figure 7 A) Viability loss after gastric (%) and bile salts ($) tests of B. longum NCC2705 cells
produced during continuous culture. Values are given as loss of log10 (CFU ml-1). B) Viability loss
after heat test ($) is given in percentage of loss in viable cells measured by flow cytometry. Time
effects are assessed by linear regression analyses. Sampling times (i.e. 31, 134 and 211 h) for cell
transcriptomic analyses are indicated by vertical lines (---). Time 0 on the graph corresponds to time
after 90 h stabilization of continuous culture.
62
Figure 8 Antibiotics susceptibility of B. longum NCC2705 cells produced during continuous culture
and time effects assessed by linear regression analyses. $, neomycin (10 'g); (, penicillin G (10 'g);
), chloramphenicol (30 'g); %, vancomycin (30 'g) and #, tetracycline (30 'g). The radius of the
disk was of 0.6 cm; therefore an inhibition zone of 0.6 cm corresponds to a complete resistance to the
tested concentration of antibiotic. Sampling times (i.e. 31, 134 and 211 h) for cell transcriptomic
analyses are indicated by vertical lines (---). Time 0 on the graph corresponds to time after 90 h
stabilization of continuous culture.
2.4.3 Transcriptomic analysis
To gain insight in the physiological response of cells during continuous cultivation,
genome-wide microarray-based gene expression analysis was performed on continuously
produced cells collected at different time points (31, 134 and 211 h of cultivation). The
sample collected after 31 h was used as a common reference. Overall, 1610 and 1282
genes (i.e. about 93 and 74 % of all genes covered by the microarray were expressed in
cells collected at 134 and 211 h, respectively. The number of differentially expressed
genes exhibiting a log2-transformed average signal ratio greater than 1.5 or smaller than 1.5 increased with culture time from 18 (134 h vs. 31 h) to 65 (211 h vs. 31 h),
corresponding to 1.0, respectively, 3.8 % of the total number of genes (Table 5). Only
functional COG categories L (replication, recombination and repair) and G (carbohydrate
63
transport and metabolism) showed significant differences in percentages of up-regulated,
respectively down-regulated, genes (Figure 9).
Genes involved in replication, recombination and repair (COG L)
The percentage of under-expressed genes involved in replication, recombination and
repair increased from 3 to 11 % (corresponding to 2 to 6 genes, respectively) between
134 and 211 h (Figure 9). The genes BL1147 and BL0127, coding for a DNA primase
and a DNA polymerase, respectively, and four genes, organized in two operons (BL1196BL1197 and BL1750-BL1751) coding for nucleases, became increasingly repressed with
time (Table 5).
Carbohydrate transport and metabolism (COG G)
In this category the number of induced genes increased from 4 to 10, corresponding to 3
and 10 %, respectively, of total genes expressed at 134 and 211 h in this category (Figure
9). Compared to the sample collected at 31 h, most of the differentially expressed genes
with culture time were involved in sugar transport systems. In particular, an operon
composed of three genes (BL1694-BL1696) coding for a multiple sugar transport system
was over-expressed with a gene expression ratio of approximately 10 and 20 at 134 and
211 h, respectively (Table 5). The operon BL0411-BL0412 coding for proteins involved
in a phosphotranspherase system (PTS) and the genes BL0143, BL0144 (in the same
operon) and BL0524, coding for permeases of ABC transporter were over-expressed with
a gene expression ratio of approximately 4-6 at 211 h (Table 5).
The number of repressed genes in this COG category increased from 0 to 5,
corresponding to 0 and 5 % of total genes expressed in COG G at 134 and 211 h,
respectively (Figure 9). At 211 h, four genes (BL0033-BL0036) organized in operon and
coding for proteins involved in ribose transport (Parche et al. 2007) were down regulated,
as well as lacZ, encoding for !-galactosidase.
64
Table 5 Overview of expression ratios of genes which were differentially expressed with increasing
time during continuous culture of B. longum NCC2705.
Gene expression ratios
(fold change, positive values represents over-expressed genes, negative under-expressed ones)
Genes
134 h
211 h
Function
Posttranslational modification, protein turnover and chaperones (COG O)
BL0519
1.2
2.8
GrpE protein (HSP70 cofactor)
BL1558
2.8
1.7
10 kDa chaperonin (GroES)
BL1620
-2.3
-4.0
Alkylation damage repair protein
DNA replication, recombination, repair (COG L)
BL0127
-1.7
-2.8
DNA polymerase III subunit alpha (DnaE)
BL1147
-2.1
-2.8
DNA primase (DnaG)
BL1196
-7.0
-17.1
Widely conserved ATP-dependent DNA helicase; Rep-like protein
BL1197
-4.6
-6.5
Large hypothetical protein
BL1750
-2.3
-4.6
Exonuclease VII small subunit (XseB)
BL1751
-1.9
-3.5
Exodeoxyribonuclease VII large subunit (XseA)
Carbohydrate transport and metabolism (COG G)
BL0033
-1.2
-3.7
Probable solute binding protein of ABC transporter system possibly for sugars
BL0034
-1.1
-4.6
ATP binding protein of ABC transporter
BL0035
1.1
-4.6
Probable ABC transport system permease protein for sugars
BL0036
1.1
-4.3
Probable ABC transporter permease protein for sugars
BL0143
1.6
5.6
Permease of ABC transporter possibly for oligosaccharides
BL0144
1.9
4.0
Permease of ABC transporter possibly for oligosaccharides
BL0411
BL0412
1.3
2.0
3.7
5.6
Phosphoenolpyruvate-protein kinase (PtsI)
Histidine-containing phosphocarrier protein (Hpr protein) of Pts transport system
BL0524
1.4
5.3
Possible permease protein of ABC transporter system
BL0978
-1.9
-3.5
LacZ
BL1293
1.3
3.5
Similar to xylulose kinase
BL1294
1.3
4.6
Possible acylphosphatase (AcyP)
BL1638
3.7
2.5
Solute binding protein of ABC transporter for sugars
BL1694
10.5
19.7
Probable sugar binding protein of ABC transporter for pentoses
BL1695
8.6
19.7
ATP binding protein of ABC transporter for pentoses
BL1696
6.5
17.1
Probable ABC transport system permease protein for sugars
Nucleotide transport and metabolism (COG F)
BL0668
4.9
6.5
Glutaredoxin-like protein (NrdH, COG O)
BL0669
3.5
4.3
Hypothetical protein (NrdI)
BL0670
4.0
3.7
Ribonucleotide-diphosphate reductase alpha subunit (NrdE)
BL0671
3.7
4.0
Ribonucleotide-diphosphate reductase beta subunit (NrdF)
65
Transcription (COG K)
BL0367
1.7
7.0
Hypothetical protein with helix turn helix motif
BL0458
1.3
3.0
Narrowly conserved hypothetical protein
BL0980
18.4
24.2
Hypothetical protein in operon BL0980-BL0981 (function unknown)
BL0981
26.0
60.0
Hypothetical protein with helix turn helix motif in operon BL0980-BL0981
BL1529
3.7
8.0
Possible IclR-type transcriptional regulator
BL1530
2.8
7.5
Probable IclR-type transcriptional regulator
BL1736
-2.0
-4.0
Possible helicase (COG KLS)
Aminoacid transport and metabolism (COG E)
BL0933
1.0
-5.6
O-acetylhomoserine (thiol)-lyase (CysD)
BL1559
1.0
-3.5
Possible cystathionine gamma lyase
BL1668
1.0
3.2
Branched-chain amino acid permease (AlzD)
BL1669
2.1
8.0
Narrowly conserved hypothetical protein
Cell wall/membrane biogenesis (COG M)
BL1672
5.6
2.8
Possible cyclopropane-fatty-acyl-phospholipid synthase
Others and unknown function
BL0126
-2.6
-2.6
Hypotetical protein, function unknow
BL0126
-2.6
-2.6
Hypotetical protein
BL0139
3.7
2.8
Oxidoreductase (COG C)
BL0140
1.7
2.8
Hypothetical protein in PgaM phosphoglycerate mutase family
BL0145
1.7
4.0
Hypotetical protein
BL0155
1.1
3.0
Large transmembrane protein possibly involved in transport (COG V)
BL0194
1.5
3.7
Kup system potassium uptake protein (Kup2, COG P)
BL0196
1.0
3.0
Hypothetical protein
BL0464
-1.2
4.0
Narrowly conserved hypothetical protein
BL0572
1.3
3.0
Hypotetical membrane protein with unknown function
BL0665
1.9
3.7
Hypothetical protein
BL0674
1.4
4.6
Possible cell surface protein with gram positive anchor domain
BL0779
-1.4
-1.9
Probable signal peptidase I-2 (SipY)
BL0813
-3.5
-2.6
Hypotetical protein
BL0873
-3.5
-4.6
Hypotetical protein
BL1086
1.4
2.8
Hypothetical protein
BL1198
-2.8
-2.6
Probable serine/threonine-protein kinase
BL1199
-2.0
-4.0
Large protein with C-terminal fibronectin type III domain unknown function
BL1199a
-2.1
-6.9
Methanol dehydrogenase regulatory protein homolog (MoxR)
BL1200
BL1201
-2.5
-2.0
-11.3
-4.0
Narrowly conserved hypothetical protein with duf54
Hypothetical protein with transglutaminase domain (amino acid transport and
metabolism)
BL1287
1.7
3.0
Preprotein translocase SecE subunit (COG U)
BL1533
1.9
3.2
Hypothetical protein with possible biotin protein ligase catalytic domain (COG H)
66
BL1536
1.6
3.0
Propionyl-CoA carboxylase beta chain (PccB, COG I)
BL1540
1.6
4.6
Possible cell surface protein
BL1697
-1.1
3.0
Hypothetical protein
67
Figure 9 Percentages of differentially expressed genes in functional COG categories at different time
points (" 134 h, # 211 h) of the continuous culture of B. longum NCC2705. The percentage of induced
and repressed, genes in each category was calculated by dividing the number of significantly
induced/repressed genes in each category by the total number of retained genes in the corresponding
category. Statistical significance: !, p-value * 0.1; *, p-value * 0.05; *** p-value * 0.0005. COG
groups: J Translation; A RNA processing and modification; K Transcription; L Replication,
recombination and repair; D Cell cycle control, mitosis and meiosis; V Defense mechanisms; T Signal
transduction mechanisms; M Cell wall/membrane biogenesis; N Cell motility; U Intracellular
trafficking and secretion; O Posttranslational modification, protein turnover, chaperones; C Energy
production and conversion; G Carbohydrate transport and metabolism; E Amino acid transport and
metabolism; F Nucleotide transport and metabolism; H Coenzyme transport and metabolism; I
Lipid transport and metabolism; P Inorganic ion transport and metabolism; Q Secondary
metabolites biosynthesis, transport and catabolism; R General function prediction only; S Function
unknown.
68
2.5 Discussion
Resistance of cells to a lethal stress can be enhanced by application of homologous or
heterologous sub-lethal stress during culture (Doleyres and Lacroix 2005). It was
previously shown that responses of probiotic cells to stress conditions are strain
dependant and vary with applied stresses (Maus and Ingham 2003; Saarela et al. 2004;
Simpson et al. 2005). In addition, sensitivity of bacterial cells to stress is also dependent
on their specific growth rate (µ) as reported for E. coli and Lc. lactis (Berney et al. 2006;
Dressaire et al. 2008). In batch culture, µ changes with culture time especially during the
transition between exponential and stationary growth phases where µ value decreases
from its maximum, µmax, to 0 h-1. During pH controlled batch cultures, this progressive
decrease of µ is due to the exhaustion of one or more substrates and/or the accumulation
of toxic products. Therefore during batch cultures, the effect of µ on cellular response to
a stress cannot be specifically described because influences of the specific stress and µ
during this period are superimposed (Dressaire et al. 2008). Moreover, µ changes rapidly
during growth phase transition leading to difficulty to collect cells in the same
physiological state over different batch cultures. In contrast, bacterial growth rate can be
accurately controlled in continuous cultures by setting the dilution rate.
Traditional probiotic batch cultures are harvested in late-exponential or stationary growth
phase to achieve maximum cell yield and increase cell viability during downstream
processing (Saarela et al. 2004). To simulate the conditions of late exponential/beginning
of stationary growth phase, our continuous culture experiment was done with a low
dilution rate of 0.1 h-1. Therefore, a low generation number of only 30 was produced
during 211 h of the continuous culture. Viable cell counts and percentages of viable cells
measured by flow cytometry remained at high level even though a slight decrease over
time of 0.2 log10 CFU ml-1 and 3 %, respectively, was measured.
The continuously produced cells were transcriptionally active as indicated by the high
percentage of expressed genes over time of 93 and 74% at 134 and 211 h, respectively.
The decrease in percentage of expressed genes observed between these two points may
69
be explained by adaptation of continuously produced cells to environmental conditions in
particular glucose availability in the medium. Percentage of differentially expressed
genes increased slightly from 1.0 to 3.8 % between 134 and 211 h compared to 31 h. This
change tested during the continuous culture was much smaller than those occurring in
cells collected during different growth phases when cultivated in batch mode. Indeed,
Klijn (2005a) reported that 24 and 46 % of genes of B. longum NCC2705 were
differentially expressed for cells collected in early and mid stationary phase, respectively,
compared to exponentially growing cells. During continuous culture of Lactococcus
lactis about 30 % of the genes were shown to be differentially expressed in response to
changes in the dilution rate from 0.09 to 0.47 h-1 (Dressaire et al. 2008) which also occur
during the growth phase transition of batch cultures. A moderate stress application can
also greatly influence gene expression. For example, application of a heat stress of 7 min
at 50°C did not affect cell viability of B. longum NCC2705 but about 50 % of the genes
were differentially expressed, in particular genes related to stress response (Rezzonico et
al. 2007).
In our study, important genes coding for stress related proteins, such as GroEL, DnaJ,
ClpA, ClpB and DnaK, involved in the general stress response of bifidobacteria (De Dea
Lindner et al. 2007) were not differentially expressed over time. GrpE and groES were
marginally differentially expressed; however they were not increasingly over-expressed
with time (Table 5). Therefore we can conclude that the expression of these stress
markers was not increased over culture time. In addition, percentages of differentially
expressed genes for all COG categories, except L (replication, recombination and repair)
and G (carbohydrate transport and metabolism) did not change significantly during
continuous culture. A majority of differentially expressed genes from COG L were
increasingly repressed with time, whereas in COG G an increase over time of percentage
of induced genes was observed. These changes suggest an adaptive response of cells to
environmental conditions created in the reactor, in particular due to low carbohydrates
availability. Although changes in percentage of differentially expressed genes were
detected during continuous culture (at 134 and 211 h compared to 31 h of culture), they
remained very small as well as for changes in expression ratios, suggesting that
70
continuous cultures operated at low µ can be used to produce cells with controlled
physiology.
The complete consumption of glucose during continuous culture indicates that
carbohydrate source was limiting. Adaptation to carbon limiting condition can explain the
increased expression of genes encoding transport systems for carbohydrates other than
glucose (BL0143, BL0144, and BL1694-BL1696) after 134 and 211 h compared to 31 h
culture. This adaptive response has already been reported for B. longum NCC2705 (Klijn
2005a) and Lactococcus lactis (Redon et al. 2005) when cells were grown under
carbohydrate limitation. The major metabolites produced from carbohydrate metabolism
of bifidobacteria are acetate, lactate, formate and ethanol which come from dissimilation
of pyruvate (Devries and Stoutham 1968). During continuous culture, a moderate, but
significant, shift in pyruvate metabolism towards an increased production of lactate in
contrast to acetate, formate and ethanol was observed using regression analysis.
Remarkably, no differential expression of pyruvate dissipating enzymes, such as lactate
dehydrogenase and pyruvate formate lyase was detected. The regulation of sugar
metabolism in lactic acid bacteria and bifidobacteria is still not well understood. Many
factors other than the regulation of the production and/or activity of certain enzymes can
lead to changes in end product formation, such as the NADH + H+/NAD+ ratio, pool of
ADP and ATP and specific sugar consumption rate (Garrigues et al. 1997; Melchiorsen et
al. 2002; Palmfeldt et al. 2004; Van der Meulen et al. 2006a).
The physiological stability of continuously produced cells of B. longum NCC2705 was
also assessed according to their tolerance to different stressing conditions that can be
encountered during biomass production and ingestion. Small but significant changes of
tolerances to different stresses were detected during continuous culture. Cell resistance to
bile salts increased significantly with culture time with an increased survival rate of about
1.1 log between cells collected at the beginning and at the end of the continuous culture
experiment. In B. animalis subsp. lactis, the redox status is involved in the response of
cells to the oxidative stress caused by bile salts (Sanchez et al. 2007b). Ribonucleotide
reductases are known to counteract the deleterious effect of oxidative stress in E. coli
cells (Monje-Casas et al. 2001). The overexpression of genes BL0668-BL0671,
organized in operon as in E. coli and coding for the ribonucleotide reductases NrdHIEF,
71
could explain the increased resistance of continuously produced B. longum NCC2705
cells to bile salts.
In several Bifidobacterium strains, the resistance to bile salts was shown to be correlated
with a higher tolerance of cells to low pH (Noriega et al. 2004). Bile salts and heat
stresses induced also similar responses in B. longum cells with upregulation of dnaK and
groEL coding for stress proteins and htrA coding for a protease (Savijoki et al. 2005).
None of these genes were overexpressed in continuously produced cells of B. longum
NCC2705 which became more sensitive to gastric juice (log loss increased of 0.6 after
211h culture) and heat (increase of loss in percentage of live cells from 6.7 to 13.5%).
Cell sensitivity to the tested !-lactam antibiotics (cefotaxim, ceftazidime and ampicillin)
remained constant through the culture, while sensitivity to penicillin G increased. B.
longum NCC2705 which was tolerant to neomycin, an aminoglycoside antibiotic that
binds to the 30S ribosomal subunits and inhibit protein synthesis (Weisblum and Davies
1968; Kohanski et al. 2007) was completely resistant (10 $g disc on agar plate) at the end
of the culture. The tolerance of bifidobacteria strains to high concentrations of
aminoglycosides has already been reported (Charteris et al. 1998a; Kheadr et al. 2004;
Moubareck et al. 2005; Noriega et al. 2005), and seems to be a common characteristic
among Bifidobacterium species. B. longum NCC2705 cells became progressively more
sensitive to tetracycline, chloramphenicol and vancomycin with culture time.
Tetracycline and chloramphenicol are bacteriostatic antibiotics targeting the 30S and 50S
subunit of the ribosome, respectively, while vancomycin has a bactericidal effect and
inhibits cell wall synthesis by interaction with peptidoglycan building blocks (Kohanski
et al. 2007). At the transcriptomic level no significant change of expression of genes
coding for drug efflux system which can affect antibiotic susceptibility (Dessen et al.
2001) was observed during continuous culture.
Although significant changes in cell responses to physiological tests and gene expression
levels were detected during continuous culture, using regression analysis, these changes
remained small and could be detected due to a highly sensitive analysis, thanks to the
high number of time points analyzed during the continuous culture and the good stability
of the system. When comparing data of the first and last 3 sampling points of the
continuous culture, used as biological replicates, no significant differences were detected
72
for viable cell counts, metabolite concentrations (except for lactic acid), survival tests
(except for bile salts) and antibiotic susceptibility. Changes detected with regression
analyses were all in the range of standard errors reported in literature for similar tests
performed on bifidobacteria cells produced during batch cultures (Maus and Ingham
2003; Saarela et al. 2004; Liu et al. 2007; Sanchez et al. 2007a). In these studies, the
difficulty to reproduce the physiological state of cells grown in batch cultures and
collected at a specific growth phase was emphasized, especially for cells collected during
the transition growth phase (end exponential) and at the beginning of stationary growth
phase, where important physiological changes occur over a short period of time. In
contrast, cells produced in continuous culture are grown at a constant specific and
controlled growth rate, and our data with B. longum NCC2705 showed that only small
changes in physiological state occurred over 211 h culture.
Over culture time, physiological parameters, such as viable cells counts, metabolites
production and resistance to stresses and antibiotics remained stable or showed only
small and gradual changes. Therefore we propose that continuous cultures operated at a
low dilution rate can then be used to produce cells with controlled physiology for testing
the effect of stresses on probiotic bacteria. This approach is tested in chapter 3 for fast
and efficient screening of a range of sub-lethal stress conditions with a 2-stage
continuous culture system, with a first vessel for controlled cell production and a second
vessel in series for sublethal stress application.
73
3 Validation of a new approach for screening of
sublethal
stress
conditions
in
a
two-stage
continuous culture with B. longum NCC2705 cells
3.1 Abstract
Resistance of probiotic cells to a lethal stress, such as those encountered during
processing and digestion can be improved by sublethal stress pretreatments. In this study,
continuous culture was developed for fast screening of sublethal stress pretreatments
according to their effects on viability and cell survival to subsequent lethal stresses.
A 2-stage continuous culture was carried out with Bifidobacterium longum NCC2705 for
211 h. The first stage (R1) was operated under fixed conditions at 37°C and pH 6.0, and
with a dilution rate of 0.1 h-1 and was used to produce cells with controlled physiology,
mimicking cells in end exponential growth phase. Different stress pretreatments, applied
for 42 min, were tested in the second stage (R2), with combinations of pH (6.0, 5.0 and
4.0), temperature (37, 45 and 47°C) and NaCl concentration (0, 5 and 10%), using a 3 by
3 factorial design. This 2-stage continuous culture design allowed efficient screening of
several stress pretreatments during the same culture experiment, with up to four different
conditions tested per day. Of all tested combinations, only those with pH 4.0 significantly
decreased cell viability in the second reactor compared to control conditions (37°C, pH
6.0, 0 % NaCl), and thus could not be considered as sublethal stresses. Pretreatments with
5 or 10 % NaCl had negative effects on cell viability after gastric lethal stress. A
significant improvement in cell resistance to a heat lethal stress (56°C, 5 min) was
observed for cells pretreated at 47°C. In contrast, heat pretreatments negatively affected
cell viability after freeze drying and osmotic lethal stresses. Selected stress pretreatments
(pH 4.0, 47°C, 10 % NaCl, 47°C+10 % NaCl and pH 4.0+10 % NaCl) were also tested
during early stationary phase of batch cultures, with similar effects compared to
continuous culture.
Our data showed that the 2-stage continuous culture is an efficient screening method for
sublethal stresses, allowing for fast and controlled testing of several stress pretreatments
74
during the same culture and leading to optimal sublethal stress conditions which can be
also applied for producing cells with traditional batch cultures.
75
3.2 Introduction
Bifidobacteria are natural inhabitants of the human intestine and have very important
functions sustaining gut health (Leahy et al. 2005). Bacteria belonging to Bifidobacterium
and Lactobacillus genera are commonly used as probiotics. Probiotics are “live microorganisms which, when administered in adequate amounts (as part of food), confer a
health benefit on the host” (FAO/WHO 2002). A central issue in the application of
probiotics as food additives is their fastidious production and their sensitivity to many
environmental stresses. It is generally agreed that probiotic food products should contain
at least 106-107 viable cells per gram or ml at the time of consumption in order to achieve
a specific health effect and/or to provide bacterial concentrations that are technologically
attainable and cost effective (Champagne et al. 2005; Lacroix and Yildirim 2007). A key
industrial challenge is to increase cell numbers and viability during biomass production,
downstream processing, and in the final product during storage and consumption.
Furthermore, to survive the harsh conditions in the gastrointestinal tract, probiotics have
to adapt to a competitive and changing environment.
New approaches for enhancing stability of probiotics to various stresses have been
recently reviewed by Lacroix and Yildirim (2007). The importance of inducible cellprotective mechanisms, triggered by application of sublethal stresses, for survival under
stress conditions has been demonstrated for a number of lactic acid bacteria (Girgis et al.
2002) and bifidobacteria (Schmidt and Zink 2000; Maus and Ingham 2003; Saarela et al.
2004). Cell responses were shown to be strain-dependent and vary with applied stresses
(Maus and Ingham 2003; Saarela et al. 2004; Simpson et al. 2005). Until now, the
optimization procedure was performed using batch cultures, which can be very time
consuming and also difficult to control due to fast changing physiology of cells.
Typically, sublethal stresses are applied for a short time period of 30-60 min in the
exponential phase (Schmidt and Zink 2000) or in stationary phase before cultures are
stopped and cell harvested (Maus and Ingham 2003; Saarela et al. 2004).
Continuous cultures could be a suitable and more efficient method to test different stress
factors on one culture instead of repeating several batch cultures (Lacroix and Yildirim
2007). However, to our knowledge this strategy has never been investigated.
76
Furthermore, physiological stability of continuously produced cells is a prerequisite to
use continuous culture for stress screening purposes during the same culture experiment.
In a previous study we showed that continuous culture can be used to produce B. longum
NCC2705 cells with controlled physiology over a long period of time (Chapter 2).
Susceptibility of continuously produced cells (stable viable cell counts decreasing only
moderately from 8.8 to 8.6 log10 CFU ml-1 over 211 h) to different stress conditions
(antibiotics, heat, gastric juice and bile) was either stable or showed only small changes
over the 211-h culture. Comparison of gene transcription profiles of samples collected
after 31 h of continuous culture and after 134 and 211 h revealed only limited changes in
expression of 1.0 and 3.8 % of total genes, respectively.
In this study, we tested the application of a two-stage continuous culture of B. longum
NCC2705, with a first stage used to produce cells with controlled growth and physiology,
mimicking cells in late exponential growth phase, and a second stage where stress
pretreatments were applied under well controlled conditions. The effect of pH,
temperature and NaCl concentration stress pretreatments and their combinations were
tested on cell viability and resistance to various lethal stresses (heat, osmotic, freeze
drying, gastric and bile salts lethal tests) in a 3 by 3 factorial design. Stress pretreatments
showing an effect on cell tolerance to lethal stresses were further tested in batch cultures
to compare stress adaptation responses in both culture modes, and therefore validate the
potential of this new screening approach for optimization of industrial batch cultures.
77
3.3 Material and Methods
3.3.1 Strain and growth conditions
B. longum NCC2705 was obtained from the Nestlé Culture Collection (Lausanne,
Switzerland) and cultivated in MRS (De Man et al. 1960) medium (Biolife, Milano, Italy)
supplemented with L-cysteine hydrochloride monohydrate (Sigma-Aldrich, Buchs,
Switzerland) at a final concentration of 0.05 % (C-MRS). Two successive precultures,
inoculated at 1 % from a frozen stock, were performed for 16 h under anaerobic
conditions (AnaeroGen, Oxoid, Basingstoke, United Kingdom) at 37°C before use.
3.3.2 Viable cell enumeration
Samples were diluted in 1x phosphate buffered saline (pH 7.7) supplemented with 0.05 %
L-cysteine hydrochloride monohydrate (C-PBS). Appropriate dilutions were plated in
duplicate on C-MRS agar (DIFCO, Laboratories, Detroit, USA) and incubated
anaerobically (AnaeroGen) at 37°C for 48 h.
3.3.3 Continuous culture experiment
A schematic diagram of the two stage continuous culture is presented in Figure 10. The
first reactor (R1) (2.5-l bioreactor, Bioengineering AG, Wald, Switzerland), equipped
with a Biospectra control system (Biospectra AG, Schlieren, Switzerland) had a working
volume of 2 l. The second bioreactor (R2) with a working volume of 140 ml (500-ml
Sixfors bioreactor, Infors AG, Basel, Switzerland), operated in series, was continuously
inoculated with culture broth from R1. Reactor R1 was inoculated at 2 % (v/v) with
preculture to start culture. After 8 h in batch mode, reactor R1 was continuously fed with
fresh C-MRS using a peristaltic pump (Alitea, Bioengineering AG, Wald, Switzerland),
set at a flow rate of 200 ml h-1 giving a dilution rate of 0.1 h-1. Mean residence times in
R1 and R2 were 10 h and 42 min, respectively. Two others peristaltic pumps (Alitea), set
at a higher flow rate than the feed pump were used to transfer fermented broth from R1 to
R2 and to harvest fermented broth from R2 (Figure 10). The useful volume in R1 and R2
78
was maintained by positioning the out-flow tubes. Carbon dioxide was flushed into the
headspace of the two reactors to maintain anaerobic conditions during the culture.
Temperature was maintained at 37°C and pH controlled at 6.0 by addition of 5 M NaOH
in both reactors. The culture was stirred at 250 rpm using 2 and 1 Rushton type propellers
in R1 and R2, respectively. A stabilization period of 90 h, corresponding to nine reactor
volume changes in R1, was allowed before starting application of stress pretreatments in
R2.
Fixed
conditions
R1
Stress
pretreatments
R2
Sampling for further analyses
and lethal stress tests
Figure 10 Schematic diagram of the two-stage continuous culture processes to screen sublethal
stresses in B. longum NCC2705. A first reactor (R1) is operated in fixed conditions of temperature
and pH and used to produce cells with controlled physiology. Stress pretreatments (pH, heat,
osmotic) are applied in the second reactor (R2) which is connected in series with R1. Cells from R1,
used as control, and R2 after stress pretreatments are collected for further analysis and lethal
stresses experiments.
79
3.3.4 Applications of stress pretreatments in continuous culture
Twenty-seven combinations of temperature (37, 45 and 47°C), NaCl concentration (0, 5
and 10 %) and pH (6.0, 5.0 and 4.0) were tested in R2 using a 3 by 3 factorial design in a
randomized order. The combination 37°C, pH 6.0 and 0% NaCl, which corresponds to
standard conditions for growth of this strain, was used as control condition. Each
pretreatment was applied for 4 h corresponding to at least 6 residence times in R2 before
sampling the reactor in steady state period. Heat pretreatment was applied by increasing
temperature from 37 to 45 or 47°C using the temperature control system of the reactor,
which required approximately 10 min. Acid pretreatment was applied by decreasing pH
from 6.0 to 5.0 or 4.0 by addition of 5 M HCl. For fast pH adjustment, within 10 min, and
to avoid oscillation of the PID-control, pH-control was turned off and pH adjusted
manually before restarting the pH-control. Osmotic pretreatment was started by direct
addition into R2 of 28 or 70 ml sterile NaCl solution (30 % w/v) in order to rapidly set
the NaCl concentration at 5 or 10 % (w/v) in the reactor, respectively. R2 was then fed
with 40 or 100 ml h-1 NaCl solution (30%, w/v) to maintain NaCl concentration at fix
levels of 5 or 10%, respectively. Because addition of NaCl increased total medium flow
rate and therefore dilution rate, the volume of the reactor was increased to 168 and 210
ml, by positioning the outflow tubes, for 5 and 10 % NaCl, respectively, to maintain a
mean residence time of 42 min.
Cell samples were collected in R1 (non stressed cells) and R2 for plate counts and lethal
stress tests. Two ml samples were directly used for plate count analyses. For lethal stress
tests, 20 ml samples were centrifuged (6,000 g, 4°C, 15 min), pellets were resuspended to
their initial volume in fresh C-MRS supplemented with 10 % glycerol, aliquoted in 2 ml
eppendorf tubes, fast frozen in liquid nitrogen and stored at -80°C for a maximum time of
2 months before lethal stress tests.
80
3.3.5 Batch cultures
Cells were grown in a 500-ml working volume bioreactor (500-ml Sixfors, Infors AG,
Basel, Switzerland) containing C-MRS inoculated at 0.5 % with preculture. Temperature
was controlled at 37°C, agitation set at 200 rpm, and pH maintained at 6.0 using 5 M
NaOH. Anaerobic conditions were achieved by flushing CO2 in the reactor headspace.
Four stress pretreatments, selected from the continuous culture were tested in batch
cultures: pH 4.0, 47°C, 10 % NaCl, 47°C+10 % NaCl, and pH 4.0+10 % NaCl. They
were applied 10 min after beginning of stationary phase, determined by base pump
activity as the point when base pump activity dropped for 10 min to lower than 0.0003 ml
min-1. This point was reached approximately 10 min after glucose concentration had
dropped to 0. Samples for plate counts and lethal stress tests were taken before and after
stress pretreatments and prepared as described above. Stress pretreatments were applied
for 42 min corresponding to the mean residence time of the cells in R2 of continuous
culture. Temperature and pH adjustements of stress pretreatments were done as described
above for the continuous culture. Osmotic pretreatment was applied with single addition
of 250 ml 30 % (w/v) sterile NaCl solution to reach a final concentration of 10 % NaCl in
the reactor. The adjustment of temperature, pH and NaCl concentration was carried out
within 10 min after which the stress pretreatment time was calculated. Control cultures
without stress application were run at 37°C, pH 6.0 and 0 % NaCl for an additional time
of 42 min after reaching stationary phase as described above. All experiments were
carried out in duplicate.
81
3.3.6 Lethal stress tests
Osmotic
Two ml samples were thawed at room temperature for 30 min and subsequently
centrifuged 2 min at 4,000 g. The pellet was washed with C-PBS, collected again by
centrifugation, resuspended in 2 ml C-PBS and cooled on ice for 30 min. In a microtiter
plate 30 $l of cell suspension were added to 270 $l of sterile 30 % (w/v) NaCl solution
and incubated anaerobically for 2 h at 37°C. This NaCl concentration, determined from
preliminary experiments using overnight cultures (data not shown) induced a loss in
viable cells of approximately 2 log10 units. Viable cell counts before and after osmotic
lethal stress were determined by plating in duplicate on C-MRS after appropriate dilution
in C-PBS and data were used to calculate viable cell loss in log10 (log loss) during
osmotic lethal stress.
Freeze drying
Freeze drying was performed according to Doleyres et al. (2004b) with some
modifications. Three aliquots of 2 ml samples were thawed at room temperature for 30
min and subsequently centrifuged 2 min at 4,000 g. The pellet was washed with C-PBS
collected again by centrifugation, resuspended in the same volume of C-PBS and 5 ml
cell suspension were pooled together in a sterile bottle for freeze drying and frozen for at
least 24 h and maximal 48 h at -80°C. Frozen samples were dried in a Virtis Genesis
freeze dryer (MultiTemp Scientific, Kloten, Switzerland) with the following parameters:
-40°C for 60 min, -10°C for 300 min with ramp, -10°C for 60 min and 25°C for 600 min
with ramp, every step at 75 mTorr. The dried samples were directly resuspended in sterile
water. Viable cell counts before and after freeze drying were determined by plating in
duplicate and data were used to calculate viable cell loss in log10 (log loss) during freeze
drying.
82
Heat
Heat survival tests were carried out according to Simpson et al. (2005). Two ml samples
were centrifuged (4,000 g, 1 min), washed and diluted in C-PBS to a final concentration
of 106 - 107 cells ml-1. One hundred µl of the diluted sample was filled into a 200 µl PCR
tube and kept on ice for 30 min. Heat stress was applied in a thermocycler (Biometra Tpersonal, Biolabo Scientific Instruments SA, Chatel-St.-Denis, Switzerland) at 56°C for
5 min. After heat stress, samples were immediately cooled down on ice for 15 min,
diluted five fold in C-PBS and analyzed by flow cytometry as follows. To 500 $l of the
cell suspension, 0.5 $l SYBR Green I (10,000X, Molecular Probes, Invitrogen, Basel,
Switzerland) and 20 $l 7AAD 0.0005 % w/v (Viability Dye, Beckman Coulter, Nyon,
Switzerland) were added. The mixtures were incubated for 15 min in the dark and
analyzed in duplicate using a Cytomics FC 500 flow cytometer (Beckman Coulter
International SA; Nyon, Switzerland) equipped with an air-cooled argon ion laser
emitting 20 mW at 488 nm combined with a 635 nm red-diode laser and the standard
filter setup. The forward and side scatter signals were used as trigger signal in the 488 nm
band-pass filter. The green fluorescence of SYBR Green I was detected through a 525 nm
band-pass filter (FL 1 channel) and the red fluorescence of 7AAD collected in the FL 4
channel through a 675 nm band-pass filter. The rate settings were adjusted to keep the
count to approximately 3,000 events s-1. Data were collected on a logarithmic scale and
analyzed using the CXP software (Beckman Coulter International SA, Switzerland).
Discrimination between viable and non-viable cells was carried out according to
fluorescence intensities of both dyes. Data were expressed as loss in percentage of live
cells.
Simulated gastric conditions
The effects of simulated gastric juices were tested according to Charteris et al. (1998b)
with some modifications in order to perform the test in microtiterplates. Cells were
washed and resuspended in 0.1 % (w/v) sterile peptone water (Becton Dickinson, VWR
International AG, Dietikon, Switzerland), cooled on ice for 30 min, 10-fold diluted in
simulated gastric juices containing 0.5 % (w/v) NaCl and 0.3 % (w/v) pepsin (0.7 FIP-U
mg-1) from porcine gastric mucosa (Merck, Zug, Switzerland) at pH 2.8, and incubated at
83
37°C under anaerobic conditions (Anaerogen) for 15 min. Cell counts before and after
stress application were determined by duplicate plate counts and data were used to
calculate viable cell loss in log10 (log loss) during exposition to simulated gastric juices.
Bile salts
The effects of bile salts were tested as previously described by Saarela et al. (2004) with
some modifications in order to perform the test in microtiterplates. Cells were washed
and resuspended in C-PBS, cooled on ice for 30 min, 10-fold diluted in 1.5 % (w/v)
porcine bile extract (Sigma-Aldrich, Buchs, Switzerland) in C-PBS and incubated
anaerobically (AnaeroGen) at 37°C for 10 min. Cell counts before and after stress
application were determined by duplicate plate counts and data were used to calculate
viable cell loss in log10 (log loss) during exposition to bile salts.
3.3.7 Carbohydrates analysis
Concentrations of glucose, organic acids (lactate, acetate and formate) and ethanol in
fermented medium of R1 and R2 over the 211 h of continuous culture and before and
after application of sublethal stresses in batch cultures were determined by HPLC. One
ml of supernatant sample was diluted 1:5 in MilliQ water and filtered through a 0.45 µm
nylon membrane filter (Infochroma, Zug, Switzerland). Separation of compounds was
carried out using an Aminex HPX-87-H column (Bio-Rad Laboratories, Reinach,
Switzerland) with 10 mM H2SO4 as eluent at a flow rate of 0.6 ml min-1 and a
temperature of 40°C. Compounds were detected using a refractive index detector (Merck
Hitachi, Darmstadt, Germany). Reported data are means of duplicate analysis.
84
3.3.8 Statistical analysis
Twenty seven different stress pretreatments were tested randomly over time in the second
stage of the continuous culture (R2) using a complete 3 by 3 factorial design (Table 6).
The effects of 3 factors (pH, temperature and NaCl concentration) at 3 levels (pH 4.0, 5.0
6.0; temperature 37, 45 and 47°C; and NaCl concentration 0, 5 and 10 %) and their
interactions on cell viability were tested using analysis of variance (ANOVA) with a
significance level of 0.05. The effects of stress pretreatments on cell viability were
measured by the difference between cell counts in R1, operated under control conditions
(37°C, pH 6.0 and 0 % NaCl), and cell counts in R2 where stress pretreatments were
applied. Cell counts were transformed to their base 10 logarithms to stabilize the variance
and normalize the residuals. Variables and interactions that showed significant p-values
in the ANOVA were further analyzed with Tukey’s HSD (honestly significant difference)
post hoc pairwise tests with a significance level of 0.05, in order to compare individual
pair of groups. A similar statistical analysis was performed with cell viability data of
lethal stresses (expressed in log loss of CFU ml-1 or % increase of dead cells during lethal
stress) in order to determine the effects of stress pretreatments on cell robustness. Given
the small number of variables, model selection was performed by eliminating interactions
with highest non significant p-values. Because continuous culture had to be stopped in
advance for technical problems, data for 4 stress combinations were missing. This
problem influenced negatively the power of the statistical analysis, but did not bias the
estimated parameters, since stress pretreatments were applied randomly. ANOVA was
performed in JMP (JMP, Version 7. SAS Institute Inc., Cary, NC, 1989-2007), which
omits missing values and uses the available case analysis for dealing with incomplete
data sets (Eberle 1999). Measured parameters were expressed as unweighted means with
standard error calculated from the ANOVA analysis. For batch cultures, an onewayANOVA (significance level of 0.05) was performed after transforming cell counts to
their base 10 logarithms to stabilize the variance and normalize the residuals. Two
biological replicates were carried out for each stress pretreatment in batch cultures.
Statistical analyses were carried out using JMP (JMP, Version 7. SAS Institute Inc., Cary,
NC, 1989-2007).
85
Table 6 Table of treatments for the applied 3 by 3 factorial design.
Factor A
Factor B
Factor C
0
1
0
0
000
100
0
1
001
101
0
2
002
102
1
0
010
110
1
1
011
111
1
2
012
112
2
0
020
120
2
1
021
121
2
2
022
122
Factor A = Temperature (0 = 37°C, 1 = 45°C, 2 = 47°C)
Factor B = pH (0 = pH 6.0, 1 = pH 5.0, 2 = pH 4.0)
Factor C = NaCl concentration (0 = 0 % NaCl, 1 = 5 % NaCl, 2 = 10 % NaCl)
2
200
201
202
210
211
212
220
221
222
86
3.4 Results
3.4.1 Continuous culture
3.4.1.1 Effect of stress pretreatments on cell viability and carbohydrate
metabolism
The effect of stress pretreatments (pH, temperature and NaCl concentration), applied in
R2, on cell viability was evaluated by measuring the differences of viable cell counts in
medium from R1 and R2. These data were analyzed by ANOVA (Table 8). Stress
pretreatments and their interactions showing significant p-values in the ANOVA were
further analyzed with Tukey’s HSD post hoc pairwise tests in order to compare
individual levels of stress (e.g. pH 4.0, 5.0 and 6.0) (Table 9).
The average cell concentration tested in R1 was of 8.8 ± 0.5 log10 CFU ml-1 during 211 h
of culture. Cell counts in R2 with control conditions (37°C, pH 6.0 and 0% NaCl) were
not significantly different to that in R1, indicating no growth in R2 under these
conditions.
Pretreatments of cells in R2 with low pH, osmotic and heat stresses had a significant
effect on cell viability, as well as the interactions of acid with osmotic or heat (Table 8).
Pretreatments at pH 4.0 combined with 5 and 10 % NaCl lead to significantly lower
losses in viable cells (1.4 ± 0.1 and 2.3 ± 0.1 log10, respectively) than for 4.0 combined
with 0 % NaCl, which resulted in high loss of 4.5 ± 0.2 log10 (Table 9). No significant
effect of temperature increase or NaCl addition was observed on cell viability for pH 5.0
and 6.0 compared to control conditions (37°C, pH 6.0 and 0 % NaCl) (Table 9).
In both reactors glucose was not detectable by HPLC. Mean values for carbohydrates
metabolites were not significantly different in R1 and R2 (Table 7).
87
3.4.1.2 Effect of stress pretreatments on cell robustness after lethal stress
application
The effects of heat, low pH and osmotic stress pretreatments applied in R2 on cell
robustness to lethal stresses, measured by increase in log loss of CFU ml-1 or % of dead
cells, were evaluated by ANOVA (Table 8). Stress pretreatments and their interactions
with significant effects on cell robustness were further analyzed with Tukey’s HSD post
hoc pairwise tests in order to compare individual levels of stress (Table 9). In Table 9, as
reference for the interpretation of the post hoc tests the combination or the individual
level of stress corresponding to control conditions (37°C, pH 6.0, 0 % NaCl) is
highlighted in bold.
Osmotic lethal stress
Osmotic and acid pretreatments as well as their interactions had a significant effect on
cell viability after osmotic lethal stress. For pH 5.0 and 6.0 addition of NaCl did not show
effects on cell survival to the osmotic lethal stress, with mean viable cell losses of 2.9 ±
0.3 log10. Significantly lower losses in viable cells of 1.2 ± 0.2 and 1.5 ± 0.1, were tested
for pH 4.0 with 0 and 10 % NaCl, respectively, after the osmotic lethal stress compared
to losses of 3.2 ± 0.3 log10 at pH 4.0 with 5 % NaCl (Table 9). Pretreatments at 47°C
induced higher cell losses after osmotic stress compared to 37 and 45°C, with viability
losses of 1.6 ± 0.2 compared to 1.2 ± 0.2 and 1.0 ± 0.2 log10, respectively (Table 8 and
Table 9).
88
Freeze drying
Survival to freeze drying was significantly affected by low pH, osmotic and heat
pretreatments (Table 8). Loss in viable cells after freeze drying increased significantly
from 2.6 ± 0.4 to 3.7 ± 0.4 log10 for pH 6.0 and pH 4.0, respectively (Table 9). Heat
pretreatments also had a negative effect on cell viability after freeze drying, with losses in
viable cell significantly increasing from 3.7 ± 0.4 to 4.7 ± 0.5 log10 for cells pretreated at
37 (reference) and 47°C, respectively (Table 9). In contrast, osmotic pretreatments
showed a positive effect on cell resistance to freeze drying, with viability loss after freeze
drying decreasing from 3.7± 0.4 to 2.5 ± 0.4 log10 for pretreatments at 0 and 10 % NaCl,
respectively (Table 9).
Gastric lethal stress
Cell viability after gastric lethal stress was significantly enhanced by low pH and osmotic
pretreatments. In contrast heat pretreatments did not show significant effects (Table 8).
Pretreatments at pH 4.0 had a significant positive effect on cell robustness to gastric
lethal stress compared to pretreatments at pH 5.0 with viability losses of 0.4 ± 0.3 and 1.1
± 0.3 log10, respectively (Table 9). Viability loss after gastric lethal stress increased
significantly from 0.4 ± 0.3 to 1.2 ± 0.3 log10 for cells pretreated at 0 (reference) and 5 %
NaCl, respectively, whereas pretreatment with 10 % NaCl gave intermediate values
(Table 9).
89
Bile salts lethal stress
Cell resistance to bile salts was significantly enhanced by low pH pretreatments (Table
8), with significantly lower viability loss at pH 4.0 compared to pH 5.0 (0.4 ± 0.5 and 2.5
± 0.5 log10, respectively, which was not different to pH 6.0) (Table 9). Heat and osmotic
pretreatments did not have any significant effect (Table 8).
Heat lethal stress
Heat pretreatments showed a significant effect on survival of cells subjected to a heat
lethal stress, whereas low pH and osmotic pretreatments did not show effects (Table 8).
The percentage of dead cells produced by heat lethal stress progressively decreased
significantly from 12± 6 to -3 ± 7 % with heat pretreatment temperature from 37 to 47°C
(Table 9).
90
Glucose
Acetic acid
Lactic acid
Formic acid
Ethanol
n.d. = non detectable
R1
(g l-1)
n.d.
8.8 ± 0.7
2.2 ±0.5
2.3 ±0.2
0.9 ± 0.1
R2
(g l-1)
n.d.
9.1± 0.7
1.9 ± 0.4
1.7 ± 0.2
0.6 ± 0.1
Batch cultures before
stress pretreatments (g l-1)
n.d.
6.5 ± 0.2
6.5 ± 0.2
0.4 ± 0.0
0.3 ±0.1
91
Batch cultures after stress
pretreatments (g l-1)
n.d.
6.0 ± 0.7
6.1 ± 0.4
0.4 ± 0.1
0.3 ± 0.2
Table 7 Metabolites concentrations in continuous (reactor 1 and 2) and batch cultures of B. longum NCC2705
2
2
2
4
4
4
Acid (pH)
Osmotic (% NaCl)
Heat (Temp.)
Osmotic*acid
Osmotic*heat
Acid*heat
Error df
SS
18.197
6.687
0.521
7.372
0.153
0.908
5
p
<0.001
0.001
0.002
<0.001
0.392
0.024
Viable cells
p
<0.001
<0.001
0.005
0.001
n.i.
n.i.
12
<0.001
0.935
SS
4.637
2.669
1.129
2.376
Osmotic lethal
stress
Freeze
Gastric
drying lethal lethal stress
stress
SS
p
SS
p
4.491 0.027 1.872 0.043
5.458 0.015 2.116 0.031
3.647 0.049 0.127 0.770
n.i.
n.i.
n.i.
n.i.
n.i.
n.i.
17
15
0.019
0.031
0.555
0.562
92
Model p
<0.001
Model R2
0.996
n.i., not included in the ANOVA model; df, degree of freedom; SS, sum of squares; p, p-value.
df
Variable
in log10 after stress pretreatments or lethal stresses and % of dead cells after heat lethal stress.
SS
p
8.275 0.014
1.357 0.406
4.560 0.070
n.i.
n.i.
n.i.
14
0.019
0.619
Bile salts
lethal stress
SS
p
329.812 0.263
738.440 0.064
836.361 0.047
n.i.
n.i.
n.i.
17
0.027
0.531
Heat lethal
stress
Table 8 Results of analyses of variance (ANOVA) for the effect of stress pretreatments in continuous culture of B. longum NCC2705 for the loss in viable cells
4.5
2.3
1.4
0.6
0.3
0.3
0.2
0.1
-0.2
A
B
B, C
C, D
C, D
D
D
D
D
0.2
0.1
0.1
0.1
0.1
0.1
0.1
0.2
0.1
0.2
0.1
0.1
0.2
0.1
0.1
0.1
0.1
0.1
0.2
0.2
0.2
0.3
0.2
0.1
0.1
0.1
0.1
0.2
0.1
0.2
Bile salts lethal stress
(pH)
5
A
2.5
0.5
6
A, B 1.8
0.5
4
B
0.4
0.5
1.6
1.2
1.0
3.2
3.1
3.0
3.0
2.8
2.7
2.2
1.5
1.2
E
0.4
0.4
0.4
0.5
0.4
0.4
3.7
3.1
2.6
4.7
4.3
3.7
6
6
7
0.4
0.4
0.4
E
3.7
3.4
2.5
M
Heat lethal stress
(Temp.)
37°C
A
12
45°C
A,B 5
47°C
B
-3
Pretreatment
(% NaCl)
0%
A
5%
A, B
10%
B
(pH)
4
A
5
A, B
6
B
(Temp.)
47°C
A
45°C
A, B
37°C
B
Freeze drying lethal stress
Pretreatment
(% NaCl)
5%
A
10% A, B
0% B
(pH)
5
A
6
A, B
4
B
1.1
0.7
0.4
1.2
1.0
0.4
M
Gastric lethal stress
0.3
0.3
0.3
0.3
0.3
0.3
E
93
M, unweighted mean and E, standard error for the loss in viable cells in log10 after stress pretreatments or lethal stresses and % of dead cells after heat lethal
stress.
5.7
4.5
4.3
0.7
0.4
0.4
0.3
0.1
-0.2
A
A
A
B
B
B
B
B
B
M
Pretreatment
(% NaCl, pH)
5%/4
A
0%/5
A
5%/5
A
0%/6 A
5%/6
A
10%/5 A
10%/6 A, B
10%/4 B, C
0%/4
C
(Temp.)
47°C
A
37°C
B
45°C
B
E
Pretreatment
(pH, Temp.)
4/47°C
4/37°C
4/45°C
5/47°C
5/45°C
6/45°C
6/47°C
5/37°C
6/37°C
(%NaCl, pH)
0%/4
10%/4
5%/4
10%/5
10%/6
5%/5
5%/6
0%/5
0%/6
M
Osmotic lethal stress
Viable cells
indicating the reference for each post hoc test.
connected by same letter are significantly different (Tukey’s HSD post hoc test). Pretreatments highlighted in bold corresponds to control conditions,
Table 9 Stress pretreatments in continuous culture of B. longum NCC2705 significantly affecting viable cells numbers and lethal stress tests. Pretreatments not
3.4.2 Batch culture
Because the traditional production method for probiotics is batch cultures, five selected
stress pretreatments (47°C; pH 4.0; 10 % NaCl and combinations 47°C+10 % NaCl and
pH 4.0+10 % NaCl) showing enhancing and/or decreasing effects on cell robustness to
various lethal stresses were tested during batch cultures of B. longum NCC2705 to
compare stress adaptation responses in both culture modes. Stress pretreatments at pH 4.0
and pH 4.0+10 % NaCl were chosen because of the protective effect of salt against low
pH observed in the continuous culture. Moreover in continuous culture, pretreatments at
47°C were shown to enhance resistance to heat stress and decrease resistance to osmotic
and freeze drying, whereas stress pretreatments with 10 % NaCl improved resistance to
freeze drying. Batch control cultures without stress application were carried out at 37°C,
pH 6.0 and 0 % NaCl for an additional time of 42 min after reaching stationary phase. A
comparison of the results observed in continuous and batch cultures is represented in
Table 10.
3.4.2.1 Effect of stress pretreatments on cell viability and carbohydrate
metabolism
Viable cell counts measured at the beginning of stationary growth phase before sublethal
stress applications were similar for all sublethal stress and control culture (8.8 ± 0.3 log
CFU ml-1). For control cultures viable cell counts did not change after 42 min in
stationary phase (8.6 ± 0.5 log CFU ml-1). Glucose was not detected at the time point of
stress pretreatment application (Table 7). Pretreatments at 47°C and 10% NaCl did not
significantly affect cell counts compared to control culture (Figure 11). In contrast, cell
counts after pretreatments with 10 % NaCl in combination with pH 4.0 or 47°C were
significantly lower compared to control culture (Figure 11), and pH 4.0 caused the
highest viability loss exceeding 3 log10 CFU ml-1 (data not shown).
94
Figure 11 Viable cells before and after stress pretreatments in batch cultures of B. longum NCC2705
in log10 CFU ml-1. Control cultures without stress application were run at 37°C, pH 6.0 and 0 %
NaCl. Stress pretreatments of the duration of 42 min included 47°C, pH 4.0, and 10 % NaCl and the
combinations 47°C+10 % NaCl and pH 4.0+10 % NaCl. Data are means of two biological replicates ±
standard deviation. Pretreatments not connected by same letters are significantly different.
95
3.4.2.2 Effect of stress pretreatments on cell robustness after lethal stress
application
No further lethal stress tests were performed with samples pretreated at pH 4.0 because of
high losses in viable cells measured after this pretreatment.
Heat lethal stress
The percentage of dead cells produced by the heat lethal stress in cell samples pretreated
at 47°C was significantly lower than for the control, with 15.4 ± 5.7 and 43.3 ± 0.1 %,
respectively (Figure 12). The other applied stress pretreatments did not have significant
effects on cell resistance to heat.
Figure 12 Percentages of dead cells after heat lethal stress after stress pretreatments in batch
cultures of B. longum NCC2705. Control cultures without stress application were run at 37°C, pH 6.0
and 0 % NaCl. Stress pretreatments of the duration of 42 min included 47°C, 10 % NaCl and the
combinations 47°C+10 % NaCl and pH 4.0+10 % NaCl. Data are means of two biological replicates ±
standard deviation. Pretreatments not connected by same letters are significantly different.
96
Osmotic lethal stress
Control cells showed a cell viability loss of 1.6 ± 0.2 log10 after osmotic lethal stress,
which was similar to pretreatment at 47°C (Figure 13). Pretreatment with 10 % NaCl and
the combination of 47°C + 10 % NaCl resulted in significantly higher losses after osmotic
lethal stress, with 2.0 ± 0.3 and 2.3 ± 0.3 log10, respectively, compared to control cells.
On the other hand, pretreatment with pH 4.0 + 10 % NaCl showed the lowest viable cells
loss of 0.9 ± 0.2 log10 after osmotic lethal stress test (Figure 13).
Figure 13 Loss in viable cells in log10 CFU ml-1 after osmotic lethal test after stress pretreatments in
batch cultures of B. longum NCC2705. Control cultures without stress application were run at 37°C,
pH 6.0 and 0 % NaCl. Stress pretreatments of the duration of 42 min included 47°C, 10 % NaCl and
the combinations 47°C+10 % NaCl and pH 4.0+10 % NaCl. Data are means of two biological
replicates ± standard deviation. Pretreatments not connected by same letters are significantly
different.
97
Freeze drying lethal stress
Control cells exhibited a viability loss of 1.8 ± 0.2 log10 after freeze drying (Figure 14),
not significantly different with pretreatments at 47°C, 10 % NaCl and the combination of
47°C + 10 % NaCl. Only pretreatment with pH 4.0 + 10 % NaCl negatively affected
survival to freeze drying with high mean viability loss of 2.9 ± 0.1 log10.
Figure 14 Loss in viable cells in log10 CFU ml-1 after freeze drying after stress pretreatments in batch
cultures of B. longum NCC2705. Control cultures without stress application were run at 37°C, pH 6.0
and 0 % NaCl. Stress pretreatments of the duration of 42 min included 47°C, 10 % NaCl and the
combinations 47°C+10 % NaCl and pH 4.0+10 % NaCl. Data are means of two biological replicates ±
standard deviation. Pretreatments not connected by same letters are significantly different.
98
Gastric lethal stress
For the two repeated tests, pretreatment at 47°C showed systematically, although not
significantly, lower losses compared to control after simulated gastric conditions (Figure
15). Pretreatment with 10 % NaCl and combination 47°C + 10 % NaCl resulted in higher
viability losses than for control cells, with 0.8 ± 0.1 and 1.0 ± 0.3 log10, respectively,
whereas the combination of pH 4.0 and 10 % NaCl showed intermediate viability losses
between control and the other two NaCl pretreatments.
Figure 15 Loss in viable cells in log10 CFU ml-1 after gastric conditions lethal test after stress
pretreatments in batch cultures of B. longum NCC2705. Control cultures without stress application
were run at 37°C, pH 6.0 and 0 % NaCl. Stress pretreatments of the duration of 42 min included
47°C, 10 % NaCl and the combinations 47°C+10 % NaCl and pH 4.0+10 % NaCl. Data are means of
two biological replicates ± standard deviation. Pretreatments not connected by same letters are
significantly different.
99
Bile salts lethal stress
Loss in viable cells after bile salt test was of 1.8 ± 0.1 log10 for control cells (Figure 16).
No significant difference between control and cells pretreated at 47°C was found. On the
other hand, losses for cells pretreated with 10 % NaCl, 47°C + 10 % NaCl and pH 4.0 +
10 % NaCl exceeded the detection limit of the method (Figure 16).
Figure 16 Loss in viable cells in log10 CFU ml-1 after bile salts lethal test after stress pretreatments in
batch cultures of B. longum NCC2705. Control cultures without stress application were run at 37°C,
pH 6.0 and 0 % NaCl. Stress pretreatments of the duration of 42 min included 47°C, 10 % NaCl and
the combinations 47°C+10 % NaCl and pH 4.0+10 % NaCl. Data are means of two biological
replicates ± standard deviation. Pretreatments not connected by same letters are significantly
different.
100
Table 10 Effect of selected stress pretreatments in continuous and batch cultures of B. longum
NCC2705
Stress pretreatment
Effect in continuous culture
Effect in batch culture
All combinations of
temperature and salt
concentration with pH 5.0 or
pH 6.0
No effect on cell viability (can
be considered as sublethal
stresses)
No effect on cell viability for
47°C and 10% NaCl, however
47°C+10% NaCl had an effect
on cell viability (cannot be
considered as sublethal stress)
All combinations with pH 4.0
Addition of NaCl at pH 4.0
Increase in temperature from
37 to 47°C
Increase in temperature from
37 to 47°C
Decrease in pH from 6.0 to
4.0
Effect on cell viability (no sublethal stress)
Lower losses in cell viability compared to withouth NaCl
Increase in cell resistance against subsequent heat lethal stress
Lower cell resistance against
subsequent osmotic and a
freeze drying lethal stresses
No effect on osmotic and
freeze drying lethal stresses
Lower cell resistance against freeze drying
101
3.5 Discussion
The survival of bifidobacteria to a lethal stress can be improved by pretreatments with
sublethal stresses, but strain specific optimization is necessary to obtain notable
improvements (Saarela et al. 2004). In this study the potential of a two-stage continuous
culture as a fast screening method was investigated to study the effect of stress
pretreatments on probiotic cells survival to lethal stresses encountered during production,
down-stream processing or in the human gastrointestinal tract. We previously showed as
a prerequisite for applying such system that continuous culture allowed the production of
B. longum NCC2705 cells with constant growth rate and controlled physiology over an
extended period of time (Chapter 2). Moreover, the two stage continuous culture design
allowed efficient screening of several sublethal stresses during the same culture
experiment, because only a short time (corresponding to approximately 6 residence
times) is necessary to stabilize the second reactor after changing the conditions (Lacroix
and Yildirim 2007). Therefore, up to four different stress pretreatments could be tested
per day, with the conditions used in this study (mean residence time of 42 min in R2).
Sublethal injuries occur following exposure of bacterial cells to unfavorable physical and
chemical environment (beyond the growth range but not in the lethal range) that cause
reversible alterations in the functional and structural organization of the cells (Ray 2004).
Pretreatments applied during continuous culture, except for pH 4.0 alone or in
combination, could be considered sublethal because they did not affect significantly cell
viability compared to control conditions (no stress pretreatment). Pretreatments studied
during batch cultures showed similar effects on cell viability as the same pretreatments
applied during continuous culture with the exception of pretreatments with combination
of 47°C+10 % NaCl, which caused higher losses in batch cultures compared to
continuous culture and could not be considered sublethal. In both continuous and batch
cultures, reduction of viable cell counts for pretreatments at pH 4.0 was restrained by
adding salt, suggesting that addition of salt protects cells against acidic stress. Such
protective effect has already been observed in exponential and stationary E. coli cells,
where addition of salt resulted in an increased cytoplasmic pH and protection against
acidic stress (Casey and Condon 2002).
102
Freeze drying is an industrially important downstream process for probiotic cultures
(Lacroix and Yildirim 2007). During freeze drying, cells are subjected to osmotic,
freezing and cold stresses. In continuous culture, osmotic pretreatment showed a positive
effect on cell survival during freeze drying as already reported for B. adolescentis
NCC251 (Schmidt and Zink 2000), whereas in batch culture such effect was not shown.
Heat pretreatment improved the survival to lethal temperature for continuously produced
B. longum NCC2705 cells. Improved survival to lethal heat stress after heat pretreatment
is a general mechanism which has already been reported for many organisms, including
B. longum, B. adolescentis and Lactobacillus plantarum (Schmidt and Zink 2000; De
Angelis et al. 2004; Saarela et al. 2004). Sublethal heat stress lead to overexpression of
the dnaK and groE operons in B. longum (Rezzonico et al. 2007). The DnaK and GroE
systems are involved in general stress response and repair of damaged proteins (Hartl
1996). These general stress genes are thought to provide non-specific protection to the
cell in the event of adverse conditions. Therefore a positive effect of heat pretreatment
against other lethal stresses (cross protection) was expected. However, in our study we
did not detect any improvement by heat stress pretreatments against other tested lethal
stresses. Cross protection effects, associated to the adaptive response to a given stress,
have already been shown to be species specific in lactic acid bacteria (van de Guchte et
al. 2002) and bifidobacteria (Schmidt and Zink 2000).
During continuous culture we did not observe any adaptive response to gastric conditions
after sublethal stress pretreatments. In contrast, B. lactis, preconditioned at pH 5.2
exhibited increase in survival rate to synthetic gastric fluid (Maus and Ingham 2003).
This difference emphasized the species and strain dependence of stress response (Schmidt
and Zink 2000; Collado and Sanz 2007). However, it must be considered that differences
between studies may be due to the methods used to measure the stress resistance. For
instance in our study, because of the large amount of samples, it was necessary to freeze
samples before analysis, which could have biased the results in comparison to other
studies without freezing.
We also observed that continuously produced cells surviving pretreatment at pH 4.0,
which could not be considered a sublethal stress for its high detrimental effect on cell
viability, were more resistant to osmotic, gastric and bile lethal stresses. Selection of bile
103
resistant cells by exposition to acid pH can be explained by the fact that these two
stresses induce a very similar molecular response; it was already observed that
bifidobacterial strains showing the highest resistance to bile salt exposure were also acidresistant (Noriega et al. 2004) and vice versa (Collado and Sanz 2007). On the other hand
the lethal acid stress can have also selected a resistant subpopulation surviving this stress
and exhibiting different characteristics to the original population.
Sublethal stresses can also have negative effects on cell survival to lethal stresses.
Survival of B. longum NCC2705 during freeze drying was negatively affected by acidic
and heat pretreatments, resistance to osmotic lethal stress was decreased by severe heat
(47°C) and resistance to simulated gastric conditions was impaired by addition of NaCl
(5 %) in the reactor. Hence heat could improve the viability of probiotic cells for one
lethal treatment (heat) but could have a different effect for other lethal stresses (freeze
drying and osmotic). This could also be partially explained by the specific responses of
cells to heat and cold stress. Heat causes protein and DNA denaturation, whereas cold
stress mainly damages the membrane. Response to heat stress is principally given by the
activation of chaperone proteins (Rezzonico et al. 2007), whereas bacterial adaptation to
low temperatures is an active process resulting in increased fatty acid unsaturation and
polypeptide synthesis (Girgis et al. 2002). Additionally we can hypothesize that heat and
osmotic stress responses do not overlap in B. longum differently to B. breve UCC2003
(De Dea Lindner et al. 2007). Accordingly, dnaK was not activated after exposition to 1.5
% NaCl in B. longum contrary to B. lactis cultures (Schmidt and Zink 2000).
Because batch cultures are very often used for cell production in the industry we
compared the effect of stress pretreatments on B. longum NCC2705 cell viability and
stress resistance in continuous and batch cultures. Most pretreatments tested in batch
cultures showed similar effects compared to those observed in the continuous culture,
with the exception of application of 47°C combined with 10 % NaCl which resulted in
significant losses in viable cells in batch in contrast to continuous culture. Additionally,
in batch culture, addition of 10 % NaCl had a negative effect against the osmotic lethal
tests whereas no effect was observed for continuous culture. These differences between
continuous and batch cultures could be due to differences in time of application of stress
pretreatments. In continuous culture stress pretreatment was applied for exactly 42 min
104
(i.e. the mean residence time of the cells in the well mixed reactor), whereas in batch
cultures the time of application was prolonged due to the time needed to reach the chosen
set-point in the reactor. Furthermore the physiology of cells produced in continuous and
batch cultures was not exactly the same, even though parameters were carefully chosen.
The growth rate of cells produced in the first reactor of the continuous culture, set and
equal to the dilution rate (0.1 h-1), was selected to mimic end exponential growing cells of
batch culture. In contrast when stress pretreatments were applied cell growth was zero
during both continuous (R2) and batch cultures due to sugar starvation. Differences in
metabolites production were observed, with less lactic acid and more acetic and formic
acid and ethanol produced during continuous culture compared to batch cultures.
Data from this study suggest that continuous culture has advantages over batch cultures,
allowing fast and efficient screening of sublethal stress conditions for cell adaptation to
stress. B. longum NCC2705 cells produced during steady state continuous cultures have
constant and controlled physiology and can be directly used for sublethal stress screening.
Furthermore, cells produced in the first stage reactor can be used as direct control for
stressed cells in the second reactor, decreasing experimental time and effort compared to
testing in batch cultures. Our data confirmed that adaptive response to sublethal stresses
exists in B. longum. Moreover, application of sublethal stresses can also have negative
effects on cell robustness and therefore must be chosen carefully according to processing
and use of the culture to improve cell robustness.
105
4 Novel method for selection of resistant
bifidobacteria cells to hydrogen peroxide using
continuous culture and immobilized cell
technology
4.1 Abstract
Oxidative stress can severely compromise production at industrial scale of sensitive
probiotic strains, such as many bifidobacteria, as well as their incorporation into food
products. Exposure to oxygen of bifidobacteria causes accumulation of reactive oxygen
species, mainly hydrogen peroxide, leading to cell death. In this study, we tested the
suitability of continuous culture under increasing selective pressure combined with
immobilized cell technology for the selection of bifidobacteria resistant to hydrogen
peroxide. Cells of B. longum NCC2705 were immobilized in gellan-xanthan gum gel
beads using a two phase dispersion process. These gel beads were used for continuous
fermentation of MRS containing increasing concentration of H2O2 from 0 to 130 ppm.
Immobilization allowed reaching very high cell densities of 1013 CFU per litre of
bioreactor at the beginning of the culture. The continuous culture gradually adapted to
increasing H2O2 concentrations, as shown by the optical density (OD) of culture effluent,
which dropped after each increase of H2O2 concentration and then increased again.
However, after increasing the H2O2 concentration to 130 ppm the OD of the culture
decreased to 0. Full wash out was prevented by the immobilization of the cells in gel
matrix. Hence after stopping the stress, it was possible to re-grow the cells that survived
the highest lethal dose of H2O2 and to isolate two resistant clones (HPR1 and HPR2). In
contrast to HPR1, HPR2 showed stable characteristics over at least 70 generations and
exhibited also higher tolerance to O2 than non adapted wild type cells. Preliminary
characterization of HPR2 was carried out by global genome expression profile analysis: 2
genes coding for a protein with unknown function and possessing trans-membrane
domains and an ABC-type transporter protein were constitutively overexpressed in HPR2
cells compared to wild type cells.
106
In conclusion, our study showed that continuous culture with cell immobilization is a
valid approach for selecting cells adapted to hydrogen peroxide. Elucidation of H2O2
resistance mechanisms in HPR2 could be helpful to develop oxygen resistant
bifidobacteria.
107
4.2 Introduction
According to FAO/WHO (2002), probiotics are defined as “live microorganisms which
when administered in adequate amounts confer a health benefit on the host”. One of the
crucial points in the production and distribution of probiotic foods is hence to deliver
enough live probiotic cells to the consumers. The minimum daily intake of probiotics to
obtain a beneficial effect is still under debate. However, a concentration of 106 live cells
of probiotic bacteria per gram of product at the time of consumption is generally accepted
and selected to provide bacterial concentrations that are attainable and cost-effective for
probiotic food products (Sanders et al. 1996; Lacroix and Yildirim 2007). During
production and storage of food, microorganisms experience a wide range of stresses,
including oxidative stress, which can severely compromise cell viability of sensitive
strains as well as their incorporation into food products.
Bacterial strains belonging to Bifidobacterium and Lactobacillus genera are the most
widely used microorganisms in probiotic food products and supplements (Vasijevic and
Shah 2008). With the exception of B. indicum and B. asteroides, bifidobacteria are
obligatory anaerobes, that possess neither a respiratory chain nor catalase (Biavati and
Mattarelli 2001). Exposure to oxygen induces accumulation of reactive oxygen species,
mainly hydrogen peroxide, which cause oxidative damage to DNA, resulting in increased
levels of mutagenesis and cell death of sensitive cells (Talwalkar and Kailasapathy 2004;
Kawasaki et al. 2006).
Although, oxygen tolerant bifidobacteria can be isolated from the environment (Meile et
al. 1997), these isolates do not necessarily exhibit relevant probiotic characteristics.
Mutagenesis with UV and NTG ( N-methyl-N’-nitro-N-nitrosoguanidine) has been
applied to obtain oxygen tolerant bifidobacteria (Shiuann et al. 1998). However
mutagenesis can cause random mutations, which may also affect the probiotic
characteristics of the mutated strain. Another method to isolate stress resistant bacterial
strains consists in culturing cells in presence of a selective agent. Plating and cultivation
in batch cultures with varying concentration of a selective agent are fairly simple
procedures, but the number of generations over which selection can occur is limited.
Therefore repeated cycles of subculturing may be required (Butler et al. 1996). At the
108
contrary to batch, continuous culture can be performed over an unlimited number of
generations under strictly controlled conditions. It has been successfully used in
combination with selective pressure for isolating cells resistant to antibiotics (Noack et al.
1988; Butler et al. 1996). Continuous culture can also be used to ensure continuous
presence of unstable selective agents, such as hydrogen peroxide, at a constant rate in the
medium. In contact with organic matter of rich media such as MRS broth, hydrogen
peroxide can break up into nascent oxygen and water (Narendranath et al. 2000).
However, the use of continuous culture combined with selective pressure is limited
because the resistance level of cells can greatly vary with fermentation time. In addition,
an over-dosage of the selective agent leads generally to a wash-out of cells from the
bioreactor. This major drawback of continuous cultures can be prevented using
immobilized cell technology, which allows retaining cell in reactor even if dilution rate
exceed growth rate of the culture (Doleyres and Lacroix 2005; Lacroix and Yildirim
2007).
The aim of this study was to test the application of continuous culture with immobilized
cells for selecting resistant populations of B. longum NCC2705. For this purpose, an
oxidative stress was applied by increasing concentrations of hydrogen peroxide.
109
4.3 Material and methods
4.3.1 Strain
B. longum NCC2705 was obtained from the Nestlé Culture Collection (Lausanne,
Switzerland) and cultivated in MRS (De Man et al. 1960) medium (Biolife, Milano,
Italy). Two successive pre-cultures, inoculated at 1 % from a frozen stock at -80°C in
MRS with 10 % glycerol (Sigma-Aldrich, Buchs, Switzerland), were performed for 16 h
under anaerobic (AnaeroGen, Oxoid, Basingstoke, United Kingdom) conditions at 37°C
before use. Part of the second pre-culture, defined as wild type culture, was stored at 80°C in MRS with 10 % glycerol for further analyses.
4.3.2 Cell immobilization
Cell immobilization was based on a two-phase dispersion process as previously described
by Cinquin et al. (2004). A mixed gel of 2.5 % (w/v) gelrite gellan gum and 0.25 % (w/v)
xanthan gum (both Sigma-Aldrich) was inoculated at 2 % (v/v) with a pre-culture of B.
longum NCC2705, containing ca. 9.0 log10 CFU ml-1. Beads with diameters in the range
of 1.0 - 2.0 mm were selected by wet sieving and used for fermentation. The entire
process was completed within 1 h.
4.3.3 Continuous culture
Beads (70 ml, measured by volume displacement) with immobilized cells were
transferred into a 1-l stirred tank bioreactor (Multifors, Infors-HT, Bottmingen,
Switzerland), equipped with a complete control system (Infors-HT), containing MRS
(630 ml), corresponding to an inoculation rate of 10 % (v/v). The reactor was stirred at
100 rpm by an inclined blade propeller. Nitrogen (PanGas, Dagmersellen, Switzerland)
was aseptically injected into the headspace to maintain anaerobic conditions.
Temperature was set at 37°C and pH was maintained at 6.0 by adding 5 M NaOH.
Culture was started in batch mode for the first 24 h, followed by 24 h in continuous mode
with feeding of MRS, to allow colonization of gel beads. During this colonization step,
110
immobilized population increased from 7.0 to 11.0 log10 CFU g-1 of gel beads.
Afterwards, feeding of H2O2 solutions was started, using a calibrated peristaltic pump,
and the culture was carried out in continuous mode for 23 days. Inflow rate of MRS,
initially set to 2.6 ml min-1 was decreased to 0.9 ml min-1 at day 9. H2O2 was
continuously added to the reactor at a flow rate 10 fold smaller than those of the MRS
and using concentrated solutions ranging from 50 to 1,300 ppm depending on the applied
H2O2 level. H2O2 solutions were prepared using 30 % H2O2 (VWR, Dietikon,
Switzerland) in sterilized water. Concentrated H2O2 solution was kept on ice, protected
from light and replaced daily, to avoid H2O2 breakdown during the experiment. Bead and
effluent samples were taken from the reactor at different time intervals for optical density
(600 nm) measurements and cell enumeration using plate counts. Aliquots of 2 ml
effluent samples were centrifuged (6,000 g, 2 min) and pellets resuspended in equal
volume of fresh MRS containing 10 % glycerol and stored at -80°C for further analyses.
Gel beads samples of 1 g were placed into 1 ml of MRS with 10 % glycerol and stored at
-80°C.
4.3.4 Viable cell enumeration in culture effluent and gel beads
Samples from effluent were serially diluted in 1x phosphate buffered saline (pH 7.7)
supplemented with 0.05 % L-cysteine hydrochloride monohydrate (C-PBS). Appropriate
dilutions were plated in duplicate on MRS agar (DIFCO, Becton Dickinson AG,
Allschwil, Switzerland) and incubated anaerobically at 37°C for 48 h. The immobilized
cell population was also monitored by plate counts after adding ca. 0.5 g gel beads to 20
ml 1 % EDTA (Sigma-Aldrich) and treatment in a stomacher for 3 min for bead
dissolution before dilution in C-PBS.
111
4.3.5 H2O2 resistance of cells from culture effluent
Resistance to H2O2 over fermentation time of cells from culture effluent was tested as
follows. Frozen samples were subcultured (1 % inoculum) 2 times in MRS anaerobically
at 37°C for 24 h in order to have similar viable cell numbers in all samples. Aliquot of 1
ml containing ca. 9.0 ± 0.2 log10 CFU ml-1 was centrifuged at 6,000 g for 2 min and the
pellet was resuspended in 10 ml 400 ppm H2O2 solution. After 1.5 h incubation at room
temperature, the cell suspension was diluted in C-PBS and plated on MRS agar and
incubated anaerobically at 37°C for 48 h. Results were expressed as survival rate in
percent before and after treatment. The test was performed in duplicate.
4.3.6 Isolation of cells resistant to H2O2
Frozen beads samples (1 g) collected at day 18 of continuous culture, were dissolved in
40 ml 1% EDTA and centrifuged at 6,000 g for 5 min. Cell pellets were resuspended in
10 ml 40 ppm H2O2 and incubated for 60 min at room temperature to recover fractions of
populations adapted to H2O2 stress. 1 ml of cell suspension was subsequently plated on
MRS agar. Colonies visible within 48 h were sub-cultured 2 times anaerobically for 16 h
in MRS broth at 37°C and frozen at -80°C in MRS with 10 % glycerol until further
analyses.
4.3.7 Characterization of H2O2 resistant isolates
4.3.7.1 H2O2 resistance level of isolates
Frozen samples of wild type and H2O2 resistant isolates cultures containing
approximately 9.0 ± 0.1 log10 CFU ml-1 were thawed at room temperature. 1 ml of sample
was centrifuged at 6,000 g for 2 min. The pellet was resuspended in 10 ml 200 ppm H2O2
solution. After 2 h incubation at room temperature cell suspensions were diluted in CPBS and plated on MRS agar and incubated anaerobically at 37°C for 48 h. Results were
expressed as survival rate in percent before and after treatment. The test was performed in
triplicate.
112
4.3.7.2 Stability of H2O2 resistant phenotype
Stability of resistant phenotype of isolates was tested by subculturing cells without
selective pressure in MRS at 37°C under anaerobic conditions for 24 h. After each
subculture, containing ca. 9.2 ± 0.2 log10 CFU ml-1, resistance to H2O2 of cells was tested
using 400 ppm H2O2 solution as described above. Tests were performed in duplicate.
4.3.7.3 Growth in presence of oxygen in liquid shaking cultures
Ability of cells to grow in presence of oxygen was tested according to Meile et al. (1997)
with some modifications. The headspace of 500 ml serum flasks containing 400 ml MRS,
after creating vacuum conditions was flushed with N2 or CO2 until recreating normal
atmosphere pressure; after which 7.5 or 12.5 % (v/v) sterile oxygen were added. The
medium was then inoculated at 2 % with an overnight culture of wild type or H2O2
resistant cells and the flasks were incubated at 37°C in a shaker at 160 rpm (Kühner AG,
Basel, Switzerland) for 24 h. Samples were taken every 2 h during the first 12 h of the
culture to measure optical density. Two repetitions were carried out.
4.3.7.4 Growth in reactor with and without H2O2
Cells were grown in a 800-ml working volume bioreactor (1000-ml bioreactor, InforsHT) containing MRS inoculated at 5 % with preculture. Temperature was controlled at
37°C, agitation set at 200 rpm and starting pH adjusted to 6.1 ± 0.1. Anaerobic conditions
were maintained by continuously sparging CO2 or N2 in the medium, starting overnight
prior to inoculation. Cells were cultivated with and without addition of 42 ppm H2O2 in
mid-exponential growth phase corresponding to an OD of 0.6. Growth was monitored by
measuring OD at 600 nm. Fermentations were performed in triplicate.
113
4.3.8 Microarray analysis
Collection of samples
Samples for global transcriptional profiling were taken in mid-exponential growth phase
after 3-3.5 h of culturing at an OD between 0.7 and 0.8 in reactors sparged with CO2 and
without H2O2. Aliquots of 2 ml were centrifuged (4,000 g, 1 min, room temperature),
supernatants discarded and cell pellets snap frozen in liquid nitrogen and stored at -80ºC
until RNA-extraction.
Microarray design and RNA extraction
DNA based arrays for B. longum NCC2705, produced by Agilent Technologies
(www.agilent.com), were obtained by in situ synthesis of 60 mer oligonucleotides on
glass slides (Wolber et al. 2006). For each gene, 3 to 6 different probes were randomly
distributed on the array. Total RNA was extracted with the Macalo%d method and purified
as previously described (Parche et al. 2006).
Array hybridization
For each hybridization, cDNA was synthesized starting from 4 $g of total RNA and
subsequently labeled using the Array 900MPX Genisphere kit (Genisphere Inc., Hatfield,
PE, USA), following the protocol provided by the supplier. Luciferase and kanamycin
control mRNA (Promega, Zurich, Switzerland) at 1 and 10 ng, respectively, were mixed
with total RNA before labeling to allow balancing of the two channels during scanning.
After the hybridization procedure, array slides were scanned at 10 µm using a Scanarray
4000 (Packard Biochip Technologies, Billerica, MA, USA). Parameters (laser power and
photomultiplier tube gain) were set in order to prevent saturation of any spot, except the
probes corresponding to rRNA.
Array analysis
Data extracted with Imagene 5.6 (Biodiscovery, El Segundo, CA, USA) were treated with
homemade scripts in Python language (www.python.org) and a local installation of the
ArrayPipe web server (Hokamp et al. 2004). Probes showing a signal smaller than twice
the standard deviation of the local background were considered without signal. Probes
114
showing no signal or saturated signals in both channels were discarded from the analysis.
Assuming an intensity-dependent variation in dye signal, (limma) loess global
normalization was applied on signal ratios. To calculate average gene expression values,
data from 3 biological replicates were combined as follows. Within each hybridization
data set, gene fold changes were calculated from the median of the corresponding probes
values. The expression value of a gene was retained if a signal was detected in at least 50
% of its probes. Genes were considered to be differentially expressed if their log2transformed signal ratios were higher than 1.5 or smaller than -1.5. Statistical analysis of
the 3 biological array replicates of the hybridization between wild type and H2O2 resistant
cells were performed using the statistical software R version 2.6.1 (R Development Core
Team 2007). Bayes statistics for differential expression (Smyth 2004) was used to rank
genes in order of evidence for differential expression using default parameters. The data
have been deposited in NCBI's Gene Expression Omnibus and are accessible through
GEO Series accession number GSE16039. TMHMM-prediction server v. 2.0 was used to
identify transmembrane domains of predicted proteins (Krogh et al. 2001).
4.3.9 Statistical analysis
For H2O2 survival, a t-test assuming equal variances (significance level of 0.05) was
performed after transforming cell counts to their base 10 logarithms to stabilize the
variance and normalize the residuals. Analysis was carried out using JMP (JMP, Version
7. SAS Institute Inc., Cary, NC, 1989-2007).
115
4.4 Results
4.4.1 Continuous culture monitoring
The concentration of H2O2 in the continuous culture with immobilized cells of B. longum
NCC2705 was increased stepwise from 0 to 130 ppm in order to select for cells resistant
to oxidative stress (Figure 17). At day 2, the optical density of the culture effluent
reached 8.4, corresponding to 9.1 log10 CFU ml-1. Subsequently, OD decreased and
increased after each increase in H2O2 concentration. Viable cells in effluent samples
before changing the level of H2O2 concentration ranged from 8.8 to 9.3 log10 CFU ml-1
until day 9 (Figure 17). Following H2O2 concentration increase to 130 ppm at day 9, the
OD decreased to 0. To enrich potentially hydrogen peroxide resistant survivors after this
harsh treatment, the addition of H2O2 was stopped for 2 days and the flow rate of the
medium was decreased to 0.9 ml min-1, resulting in a new phase of growth with an
increase of OD to 3.2 at day 11 in effluent samples, corresponding to 5.8 log10 CFU ml-1.
Concentration of H2O2 was then set again at 100 ppm and OD decreased again to 0 with
viable cell counts in the effluent gradually decreasing from 5.6 at day 14 to 4.4 log10 CFU
ml-1 at day 20 (Figure 17). cell counts were generally 1 to 2 log higher than free cell
counts in effluent samples, except the end of culture where both population came very
close (Figure 17).
H2O2 resistance of free cells in the culture effluent remained stable during the first 8 days
with a survival rate of 0.0001± 0.00004 % before treatment with 130 ppm H2O2. At day
14 and 18 the survival rate was 760 and 16 folds higher than for day 1, respectively
(Figure 18) with an apparent time effect.
116
140
11
120
10
10
8
H2O2 in reactor (ppm)
100
9
80
8
60
7
6
40
5
20
4
0
0
2
4
6
6
4
OD 600 nm
-1
Log 10 (CFU ml )
12
2
0
8 10 12 14 16 18 20 22 24
Time (days)
Figure 17 Optical density of effluent (black line), H2O2 concentration in reactor (grey dashed line)
and viable cells counts in gel beads (closed circle) and in the effluent (open circle) during continuous
1e+2
140
1e+1
120
% survival
1e+0
100
1e-1
80
1e-2
60
1e-3
40
1e-4
1e-5
20
1e-6
0
0
2
4
6
H2O2 in reactor (ppm)
culture with immobilized cells of B. longum NCC2705 and H2O2 selective pressure.
8 10 12 14 16 18 20 22 24
Time (days)
Figure 18 Resistance of culture effluent to H2O2 in % survival (calculated from CFU ml-1) after 1.5 h
in 400 ppm H2O2 solution. Data are means of two replicates ± standard deviation.
117
4.4.2 Selection of resistant cells and stability of H2O2 resistance
phenotype
Because a large fraction of cell biomass of the system was in the bead matrix (ca. 11.0
log10 CFU g-1 beads after colonization) at the beginning of the fermentation, a higher
number of adapted cells was expected in the beads, which were physically retained in the
bioreactor, than in effluent at the end of culture. Cells from beads collected at day 18 (4.8
log10 CFU g-1) were subjected to an isolation step, and tested for their resistance to H2O2.
Two colonies, namely HPR1 and HPR2, were detected after this isolation step. Tolerance
to H2O2 of cells from these two isolates were 20 and 30 folds higher, respectively, than
that of wild type cells, (Figure 19). A stability test was performed with these two isolates.
HPR1 lost its H2O2 resistance phenotype after three successive cultures, showing similar
resistance level compared to wild type cells, whereas HPR2 maintained its phenotype
over at least 11 subsequent cultures (Figure 20). The survival tests showed large
variations depending on the testing day and subculture (Figure 20), however a repetition
of this test showed similar results (data not shown).
% survival
100.0
10.0
1.0
0.1
WT HPR1 HPR2
Figure 19 H2O2 resistance level of isolates (HPR1 and HPR2) and wild type B. longum NCC2705
(WT) in % survival (calculated from CFU ml-1) after 2 h in 200 ppm H2O2 solution. p-values of 0.03
were determined with a t-test.
118
% survival
100
10
1
0.1
0.01
0.001
0.0001
0.00001
0.000001
3
4
5
6
7
8
9 10 11
subculture
Figure 20 Stability of H2O2 resistant phenotype in % survival (CFU ml-1) after 2 h in 400 ppm H2O2
solution. Wild type B. longum NCC2705 (black bars), HPR1 (dashed bars), and HPR2 (white bars).
4.4.3 Growth in presence of oxygen in liquid shaking cultures
HPR2 and wild type cells grew at similar rate of 0.47 ± 0.03 and reached the same optical
density of 5.2 ± 0.4 after 24 h culture in presence of 100 % nitrogen or carbon dioxide in
the headspace (Figure 21 and Figure 22). When the atmosphere of the headspace was
composed of 7.5 and 82.5 % of oxygen and nitrogen, respectively, growth of HPR2 cells
was impaired reaching an OD of 0.6 ± 0.2 after 24 h culture and that of wild type cells
was negligible (Figure 21). A better growth was observed for both strains in presence of
oxygen, even at 12.5%, when nitrogen was replaced by carbon dioxide (Figure 22).
Under this atmosphere, growth ability was also higher for HPR2 than wild type strains
(Figure 22).
119
2.0
1.5
ln OD 600 nm
1.0
0.5
0.0
-0.5
-1.0
-1.5
-2.0
-2.5
-3.0
0
5
10
15
Time (hours)
20
25
Figure 21 Growth of HPR2 (triangle) and wild type B. longum NCC2705 (squares) in presence of 100
% N2 (closed symbols) and of 7.5 % O2 - 92.5 % N2 (open symbols) in liquid shaking cultures.
Growth was monitored using optical density at 600 nm.
2.0
1.5
ln OD 600 nm
1.0
0.5
0.0
-0.5
-1.0
-1.5
-2.0
-2.5
-3.0
0
5
10
15
Time (hours)
20
25
Figure 22 Growth of HPR2 (triangle) and wild type B. longum NCC2705 (squares) in presence of 100
% CO2 (closed symbols) and of 12.5 % O2 - 87.5 % CO2 (open symbols) in liquid shaking cultures.
Growth was monitored using optical density at 600 nm.
120
4.4.4 Growth in presence of H2O2 in reactors
Both wild type and HPR2 cells recovered rapidly and in a similar manner after addition
of H2O2 in medium sparged with carbon dioxide, and reached the same OD of 5.9 ± 0.5
than non treated cells after 24 h of culture (Figure 23). In presence of nitrogen, HPR2
strain started to recover earlier and at a higher rate than wild type cells after H2O2
addition reaching an optical density of 1.3 ± 0.03 and 0.7 ± 0.2, respectively, after 8 h
culture (Figure 24). Growth of HPR2 and wild type cells, treated and not treated with
H2O2, were negatively affected by sparging nitrogen compared to carbon dioxide in the
medium (Figure 23 and Figure 24).
4.4.5 Genome-wide transcription analysis
Transcriptome analysis of exponentially growing cells without selective pressure in
presence of CO2 showed that the genes BL1404 and BL0931 were significantly
overexpressed (p-values of <0.001 and 0.001) in HPR2 compared to wild type cells of B.
longum NCC2705. BL1404 was overexpressed with an average log2 ratio of 3.0 and
BL0931 with an average log2 ratio of 1.5. All remaining genes had log2 transformed ratios
between 1.5 and -1.5.
121
ln OD 600 nm
2.5
2.0
1.5
1.0
0.5
0.0
-0.5
-1.0
-1.5
-2.0
-2.5
0
5
10
15
20
25
Time (hours)
ln OD 600 nm
Figure 23 Growth of HPR2 (triangles) and wild type B. longum NCC2705 (squares) in liquid cultures
in reactors with CO2 atmosphere, without addition of H2O2 (closed symbols) and with addition of 42
ppm H2O2 (open symbols). Growth was monitored using optical density at 600 nm.
2.5
2.0
1.5
1.0
0.5
0.0
-0.5
-1.0
-1.5
-2.0
-2.5
0
2
4
6
8
10
Time (hours)
Figure 24 Growth of HPR2 (triangles) and wild type B. longum NCC2705 (squares) in liquid cultures
in reactors with N2 atmosphere, without addition of H2O2 (closed symbols) and with addition of 42
ppm H2O2 (open symbols). Growth was monitored using optical density at 600 nm.
122
4.5 Discussion
In this study, we tested the suitability of continuous culture under increasing selective
pressure combined with immobilized-cells technology for the selection of B. longum
NCC2705 derivatives resistant to hydrogen peroxide. Continuous culture allows
cultivation over an unlimited number of generations under strictly controlled conditions.
In addition continuously cultured cells may undergo a number of consecutive mutational
events, each contributing to improve adaptation of cells to their environment (Novick and
Szilard 1950; Butler et al. 1996). A very high cell concentration was reached in beads
(1011 CFU g-1 beads) leading to a high total population, including immobilized and free
cells, of 1 1013 CFU per litre of bioreactor similar to that reported by Doleyres et al.
(2002) with immobilized B. longum cells in gellan gum beads in continuous culture
operated at a dilution rate of 0.5 h-1. As a comparison, batch cultures with free cells of B.
longum NCC2705 generally reach 109 CFU ml-1, corresponding to 1012 CFU per litre of
bioreactor at the end of the culture (data not shown). This high cell density could favor
the occurrence of mutations since the rate of appearance of mutational events is
proportional to the amount of biomass in the culture (Lane et al. 1999).
The continuous culture gradually adapted to increasing H2O2 concentrations, as shown by
the culture oscillating OD. However, the B. longum population tested in the effluent
reached an upper limit of its adaptive capabilities at day 9 with H2O2 concentration of 130
ppm. A possible explanation for this lies in the decreasing number of cells: the less
biomass, the stronger the effect of the H2O2. For a cell biomass of ca 9.0 log10 CFU ml-1,
130 ppm is likely to be beyond the resistance threshold. Immobilizing the cells in a gel
matrix has prevented full wash-out, which would have very likely occurred with a free
cells system. Hence after stopping the stress, it was possible to re-grow the cells that
survived this high H2O2 concentration. After this enrichment step and under 100 ppm
H2O2, resistance level of continuously produced cells was higher than those tested at the
beginning of the fermentation but decreased to an intermediate level at day 18.
Heterogeneity in the immobilized and free populations which can exhibit different
resistance level and/or adaptative mechanisms to the selective pressure, as discussed
123
below for cells isolated from gel beads, could explain this change in resistance to H2O2
with fermentation time and using the same conditions.
HPR1 and HPR2, isolated from gel beads at day 18, showed a 20- and 30-fold higher
resistance to H2O2 than wild type cells, respectively. Two different mechanisms can be
proposed to explain the adaptative response of these two isolates in regard to the stability
of their resistance phenotype. HPR1 isolate lost rapidly its resistance phenotype which
could be the result of a transient adaptation caused by the stressing conditions
encountered in gel beads and not necessarily by H2O2 selective pressure. Indeed, it was
already reported that B. longum cells produced with immobilized cell technology,
continuously cultivated without specific selective pressure adapt to H2O2 stress (Doleyres
et al. 2004b). This phenotype was reversible after subculturing, and could be related to a
non specific stress adaptation caused by diffusional limitations of both substrates and
inhibitory products in the gel beads (Doleyres et al. 2004b). Resistance phenotype of
HPR2 isolate to H2O2 was much more stable (at least over 70 generations) than that of
HPR1 indicating a probable stable mutation. To our knowledge, this is the first
description of a mutant strain of bifidobacteria resistant to H2O2. HPR2 cells were then
further characterized.
HPR2 could tolerate higher O2 level than wild type cells B. longum NCC2705 and B.
thermophilum RBL67 that is considered as moderately oxygen-tolerant (von Ah et al.
2007). The ability of HPR2 isolate to grow in presence of oxygen can be associated with
its H2O2 resistance phenotype. Indeed, accumulation of H2O2 during culture of sensitive
bifidobacteria in presence of oxygen is generally considered as the primary reason for
growth inhibition (Talwalkar and Kailasapathy 2004; Kawasaki et al. 2007; Kawasaki et
al. 2009). Additionally, HPR2 and wild type seems to tolerate more O2 in presence of
CO2 than with N2 in the headspace of the culture.
The better growth of HPR2 and wild type cells observed in reactor with medium sparged
with CO2 instead of N2 are in agreement with others studies reporting the essential role of
CO2, even at low level, to stimulate growth of bifidobacteria (Kawasaki et al. 2007;
Ninomiya et al. 2009). Presence of residual dissolved CO2 in MRS medium for liquid
shaking culture, can also explain the lack of difference between growth of HPR2 and wild
124
type strains in presence of 100% N2 or CO2 in the headspace, in contrast to cultures in
reactor where these gases were directly sparged into the medium.
A known mechanism influencing resistance to oxygen in bifidobacteria is the type of
NADH oxidase activity. In O2 sensitive species, NADH oxidase exhibits H2O2 forming
activity while H2O is produced in microaerophilic species (Kawasaki et al. 2006;
Kawasaki et al. 2009). B. longum NCC2705 possess a gene (BL1266), which codes for a
putative NADH oxidase with an active site for the four electron reduction of O2 to H2O
and could therefore be implied in the detoxification of H2O2 (Klijn 2005a). However,
BL1266 is not differentially expressed in HPR2 compared to wild type cells. Constitutive
overexpression of oxidative stress related proteins can also protect cells to H2O2 as
observed in a mutant strain of Bacteroides fragilis resistant to H2O2 (Rocha and Smith
1998). In HPR2 another mechanisms seems to be involved in the resistance to H2O2. Two
genes, BL1404 and BL0931, were constitutively overexpressed in HPR2 compared to
wild type. These two genes were not differentially expressed in wild type cells exposed to
H2O2 (Klijn 2005a). BLAST search (Zhang et al. 2000) showed that BL1404, which is
annotated as hypothetical protein (Schell et al. 2002), is only homologous, 99 % on
nucleotide level, to a integral membrane protein BLD_0271 of the same species (B.
longum DJ010A). The BLAST search could not identify homologous genes in other
bacteria, indicating that BL1404 encodes a protein specific to bifidobacteria. The BL1404
protein possesses three predicted transmembrane domains and 2 outer and 2 inner
domains. BL0931 is annotated as possible ABC-type transport system involved in
lipoprotein release. Further experiments are required to confirm the role of these two
proteins in H2O2 resistance and to characterize their function.
125
In conclusion, our study showed that continuous culture with cell immobilization is a
valid approach for selecting cells adapted to hydrogen peroxide. Cell immobilization
allowed maintaining high cell numbers in the bioreactor, even when high selective
pressure was applied. This enabled controlled application of stress at high levels on the
culture over a long time. Additionally, characterization of HPR2 revealed the constitutive
induction of two genes associated with the cell membrane. However, their function needs
further characterization. Elucidation of H2O2 resistance mechanisms in HPR2 could be
helpful to improve resistance of bifidobacteria to oxidative stress.
126
5 General conclusions and perspectives
In this dissertation, two hypotheses were tested. The first hypthesis was that continuous
culture in a two stage system can be used as fast and efficient method for screening of
sublethal stresses. An important precondition for this is that continuously produced cells
show stable physiological properties over culturing time. A second hypthesis was that
continuous culture in combination with immobilized cell technology and selective
pressure can be used for efficient selection of stress resistant strains. These hypotheses
were formulated based on the observation that continuous cultures have been used for
producing cells with constant physiology over time (Hoskisson and Hobbs 2005) and also
in combination with selective pressure for selection of resistant strains to antibiotics
(Noack et al. 1988; Butler et al. 1996). Bifidobacterium longum NCC2705 is an ideal
model organism for both approaches because some aspects of its stress response,
metabolic control, and regulatory mechanisms have been characterized using genome
wide expression analyses (Klijn 2005a). This knowledge was applied in this dissertation
for screening and application of stresses and for the interpretation of the obtained data.
To test the first hypothesis, a 2-stage continuous culture with B. longum NCC2705 was
developed and applied for fast and efficient screening of sublethal stresses. To verify the
suitability of continuous culture for this purpose, the physiological stability of
continuously produced cells was shown during 211 h continuous culture. More precisely,
physiological parameters (such as viable cell counts, production of metabolites
susceptibility to antibiotic and stress conditions) showed either stable or only moderate
changes over culturing time. Comparison of gene transcription profiles between samples
collected after 31 h of continuous culture and samples collected after 134 and 211 h
revealed only limited changes in expression (1.0 and 3.8 % of total genes, respectively).
This stability allowed applying different stress pretreatments with controlled conditions
in the second stage of the continuous culture. A large number of stress pretreatments were
screened during the same continuous culture in a short time frame using a factorial
experimental design. Under the specific conditions used in this study, it was possible to
test up to four different stress pretreatments per day, with important advantages relating
127
to high throughput and control of experimental error by using cells produced in the first
stage as control cells. Combinations of pH (6.0, 5.0 and 4.0), temperature (37, 45 and
47°C) and NaCl concentration (0, 5 and 10 %) were tested using a 3 by 3 factorial design.
All tested combinations were found to be sublethal apart from conditions with pH 4.0.
However, the observed large reduction of viable cell counts for pretreatments at pH 4.0
was restrained by adding salt. Heat pretreatment at 47°C protected the cells from a
subsequent heat lethal stress. In contrast, it negatively affected cell viability after freeze
drying and osmotic lethal stresses. Generally, selected stress pretreatments (pH 4.0, 47°C,
10 % NaCl, 47°C+10 % NaCl and pH 4.0+10 % NaCl) applied to early stationary phase
cells during batch cultures produced comparable effects to continuous culture. Hence, we
showed that continuous cultures can be used for fast and efficient screening of a wide
range of stress pretreatments, and test conditions that coul then be applied for probiotic
cells production in classical batch cultures. However, application of sublethal stresses
was shown to improve cell resistance to some lethal stresses but also to negatively affect
cell robustness to other lethal stresses. Therefore, stress pretreatments must be carefully
chosen and adapted to the use of the culture to improve cell robustness. In this work we
showed that continuous culture is an efficient approach for screening sublethal stresses to
enhance cell robustness in laboratory setting. For future perspective, this technology
could be examined, in combination with sublethal stresses, as production method for
probiotic cultures. However, additional demonstration for industrial application is
needed: the effects of sublethal stresses must be tested in conditions more similar to
industrial stresses, such as spray drying. The next steps would then be to scale up the 2stage continuous culture and assess the stability of this technology to contaminations
which is an issue in open systems like continuous cultures. Additionally, combining
continuous cultures with immobilized cell technology may allow increasing the
productivity and biological stability of the system, but this need further testing.
128
The second hypothesis of this dissertation was that continuous culture in combination
with immobilized cell technology and selective pressure could be used for selection of
stress resistant strains. Resistance to oxidative stresses, such as hydrogen peroxide, is of
particular interest in bifidobacteria, because oxidative stresses can severely compromise
production at industrial scale of sensitive strains as well as their incorporation into food
products. To test this second hypothesis, a continuous culture with immobilized cells and
selective pressure (hydrogen peroxide) was developed and applied for isolating resistant
strains to oxidative stress. Immobilized cell technology allowed maintaining high cell
numbers in the bioreactor, even when high selective pressure was applied. This enabled
controlled application of stress on the culture over a long time, leading to the successful
isolation of a strain (HPR2) with improved and stable resistance to oxidative stress.
Compared to wild type B. longum NCC2705 the constitutive overexpression of two
genes, BL1404 and BL0931, was observed in HPR2. However, these two genes were not
differentially regulated in B. longum NCC2705 under H2O2 stress and the coded proteins
still need to be characterized. Additionally, in order to clarify the molecular mechanisms
that protect HPR2 from H2O2 stress its genome-wide response to oxidative stress and the
possible mutations present in its genome should be assessed. Identification of H2O2
resistance mechanisms in HPR2 could be helpful to develop oxygen resistant
bifidbacteria. The phenotypic characteristics of the HPR2 strain are technologically very
promising because this strain can tolerate higher amounts of oxygen and H2O2 as the wild
type. However, in order to be able to apply HPR2 in food products its resistance in
industrial processes (such as spray and freeze drying) and in food products (as for
example yogurt) needs first to be quantified. This study showed that continuous culture
with cell immobilization and application of a selective pressure is a valid approach for
selecting B. longum cells adapted to hydrogen peroxide. In the future, this system could
be applied to other microorganisms and to other stresses, as for example heat and acid
stresses, which are often encountered in the preparation and application of probiotic as
food supplements.
Hence, in this dissertation the benefits of continuous cultures and immobilized cell
technology as tools for improving the resistance of probiotic cells to environmental
stresses have been demonstrated, opening new doors for technological optimization of
129
sensitive strains and their utilization in food products. However, additional work with
conditions closer to industrial standards is needed.
130
6 Appendix: Genome wide expression analysis of
culture samples produced with different
technologies
6.1 Introduction
To characterize the 2-stage continuous culture used in this study for screening of stress
pretreatment (Chapter 3) more extensively and to assess if transfer from one stage to the
next affected the physiological stability of the cells, a comparison of the transcriptome
and of end-fermentation products between the first (reactor 1) and the second stage
(reactor 2) was performed. Additionally, to characterize the cellular state of the
continuously produced cells, they were compared to exponential and early-stationary
phase batch cultured cells. Few studies describe comparison of continuous and batch
cultures on the transcriptomic and physiological level and often the comparison is carried
out with exponential batch grown cells (Ihssen and Egli 2005; Franchini and Egli 2006).
However, the growth phase of continuously produced cells does not necessarily
correspond to that of exponential phase cells and because growth phase impacts on stress
behavior of cells (Klijn 2005a), the growth rate should be taken into account. In steady
state continuous cultures the growth rate corresponds, according to Monod kinetics, to the
dilution rate in the reactor and the low dilution rate in this study should correspond
therefore to a growth rate comparable to late exponential/early-stationary growth phase.
131
6.2 Material and Methods
6.2.1 Strain and growth conditions
B. longum NCC2705 was obtained from the Nestlé Culture Collection (NCC) and
cultivated in MRS (De Man et al. 1960) medium (Biolife, Milano, Italy) supplemented
with filter sterilized cysteine at a final concentration of 0.5 g l-1 (C-MRS). Two
consecutive pre-cultures were performed at 37ºC for 16 h. Anaerobic conditions were
maintained using AnaeroGen (Oxoid, Basingstoke, United Kingdom).
6.2.2 Batch cultures
Cells were grown in a 2-l working volume bioreactor (Bioengineering AG, Wald,
Switzerland), equipped with a control system (Biospectra AG, Schlieren, Switzerland).
The batch fermentations were performed in C-MRS. The bioreactor was thermostated at
37°C and agitation set at 250 rpm. The pH was maintained at 6.0 by addition of 5 M
NaOH. To ensure anaerobic conditions the reactor’s head space was flushed with CO2.
The reactor was inoculated at 2 % with pre-culture. Samples for microarrays and HPLC
analysis were taken in exponential and early stationary growth phase corresponding to
cell concentrations of 8.1 and of 8.8 log10 (CFU ml-1) and an optical density of 0.9 and
5.8, respectively. These cell numbers were enumerated by diluting the samples in
phosphate buffer saline 1x, pH 7.7 (PBS) supplemented with 0.05 % cysteine (C-PBS),
and plating appropriate dilutions in duplicate on C-MRS agar. Plates were then incubated
anaerobically at 37°C for 48 h.
132
6.2.3 Continuous culture, substrates, metabolites and
transcriptomic analyses
Samples to be analyzed were taken from the 2-stage continuous culture described in
Chapter 3. Briefly, the first and second reactor of the 2-stage continuous culture had a
working volume of 2 l and 140 ml, respectively. The second reactor, operated in series,
was inoculated with culture broth from the first reactor. Medium (C-MRS) was added at a
flow rate of 200 ml h-1 corresponding to a dilution rate of 0.1 h-1 in reactor 1 and leading
to residence times of 10 h and 42 min in reactor 1 and 2, respectively. Carbon dioxide
was injected into the headspace of the two reactors to maintain anaerobic conditions
during the culture. The temperature was maintained at 37°C and pH controlled at 6.0 by
addition of 5 M NaOH in both reactors.
Substrates and metabolites analyses were performed using HPLC and transcriptomic
analysis using microarrays as described in Chapter 3. Genome wide expression analysis
between continuously produced cells from reactor 1 and reactor 2 at time 134 h was
performed with one biological replicate. Reactor 2 at time 134 h was operated under the
same conditions found in reactor 1. Moreover, samples from the continuous culture at
134 h from reactor 2 were hybridized with samples from a batch culture in exponential
growth phase and with samples from early-stationary growth phase. These hybridizations
were performed with one biological replicate and two technical replicates including a
dyes swap, log2 transformed ratios represent average values (Figure 25).
133
Continuous culture
reactor 1, 134 h
Continuous culture
reactor 2, 134 h
Exponential growth
phase batch culture
Early-stationary growth
phase batch culture
Figure 25 Hybridization scheme. The experiments were performed in duplicate with dyes swaps.
Each arrow represents one hybridization; samples at the base of the arrow were labeled with Cy3
label and samples at the arrowhead with Cy5.
134
6.3 Results
6.3.1 Comparison of continuously produced cells collected in
reactor 1 and 2
In order to further characterize the 2-stage continuous culture described in Chapter 3 and
to assess if transfer from one stage to the next affected the physiological stability of the
cells produced within this system, metabolite production and genome wide expression of
cells from reactor 2 were compared to those of cells from reactor 1. Concentrations of
glucose, acetic, lactic and formic acids and ethanol in the 2 reactors of the continuous
culture were not different over the whole 211 h of culturing (Table 11). In the full
genome based transcription analysis of cells from the first stage compared to cells from
the second stage of the continuous culture the relative expression value of 99.6 % of the
open reading frames (ORFs) was assessed, 0.6 % (10 ORFs) of which was differentially
expressed. Seven genes were higher expressed (log2 ratio up to 2.2) and three lower
expressed (log2 ratio up to 1.7) in the second reactor compared to the first (Figure 2). No
major differences in metabolites production and gene expression could be detected
between cells collected in reactor 1 and 2 of the 2-stage continuous culture (Table 11,
Table 12).
10
8
6
log2 (ratio)
4
2
0
-2
-4
-6
-8
-10
4
6
8
10
12
14
16
log2 (average signal)
Figure 26 Effect of reactor on the global gene expression levels in B. longum NCC2705. Plot displaying
the global distribution of gene expression values for cells collected in reactor 2 relatively to cells in reactor
1.
135
Table 11 Metabolites concentrations in continuous (reactor 1 and 2) and in batch culture
(exponential phase and early-stationary phase) of B. longum NCC2705
Glucose
Acetic acid
Lactic acid
Formic acid
Ethanol
n.d. = not detectable
Reactor 1
(g l-1)
Reactor 2
(g l-1)
Batch exponential
phase (g l-1)
n.d.
8.8 ± 0.7
2.2 ±0.5
2.3 ±0.2
0.9 ± 0.1
n.d.
9.1± 0.7
1.9 ± 0.4
1.7 ± 0.2
0.6 ± 0.1
12.3 ± 0.7
1.2 ± 0.3
1.1 ± 0.2
0.1 ± 0.1
0.3 ± 0.2
Batch earlystationary phase
(g l-1)
n.d.
6.9 ± 0.1
6.0 ± 0.2
0.5 ± 0.2
0.3 ± 0.2
Table 12 Percentages of significantly differentially expressed genes in functional COG categories in
continuously produced cells collected in reactor 2 relatively to exponential and early stationary phase
cells of B. longum NCC2705 from batch culture
COG
Description
H
U
C
E
M
J
K
G
R
Coenzyme transport and metabolism
Intracellular trafficking and secretion
Energy production and conversion
Amino acid transport and metabolism
Cell wall/membrane biogenesis
translation
transcription
carbohydrate transport
general function prediction only
Exponential vs.
continuous %
+2*
-13*
-11**
+5**
+3*
+5*
+19**
+26***
+6*
Early stationary vs.
continuous %
non sig.
non sig.
non sig.
-1***
non sig.
-1**
+10*
-25***
non sig.
Percentages of induced (+), respectively repressed (-), genes in each category was calculated by dividing the number of
significantly induced/repressed genes in each category by the total number of retained genes in the corresponding
category. *, statistical significance (*, p-value & 0.05; **, p-value & 0.005; *** p-value 0.0005). Functional categories
with p-values higher than 0.05 are not shown.
6.3.2 Comparison of continuously produced cells in reactor 2 with
exponential and early-stationary phase cells from batch
culture
Continuously produced cells from reactor 2 at t = 134 h were compared to exponential
and early-stationary phase batch cultured cells in order to characterize their physiological
state.
The average concentration of acetic acid, formic acid, and ethanol was higher in the
continuous culture, whereas the amount of lactic acid was lower compared to the
concentrations in exponential and early-stationary phase batch cultures (Table 11).
136
DNA micro array analysis between continuously grown cells and exponential phase cells
enabled to assess the relative expression value of approximately 95% (1645) of ORFs. In
total 220 genes (13 %) were differentially expressed in the comparison, and the log2
transformed ratios minimum was -3.4, the maximum 7.8. A more in detailed analysis of
the data revealed induction in continuous culture of 26% of the genes in COG category G
(carbohydrate transport and metabolism) and 19% of the genes in COG K (transcription).
Repression occured in 13% of the genes in COG U (intracellular trafficking and
secretion), and in 11% of the genes in COG C (energy production and conversion) (Table
12). The majority of the regulated genes in the COG category K were transcriptional
repressors (MarR type, lacI type and LexA transcriptional regulators).
A relative expression value of approximately 60% (1055 genes) of the ORFs was found
in the comparison between continuously growing cells and early stationary phase cells
(Figure 27) of which 152 genes (14 %) were differently expressed. The log2 transformed
ratios minimum was -3.9, and the maximum 5.0. Main differences between continuous
and early-stationary growth phase batch cultures were repression (25 %) of genes in COG
category G (carbohydrates transport and metabolism) and induction (10 %) of genes in
COG category K (transcription) (Table 12).
137
10
10
A
6
4
4
2
0
-2
2
0
-2
-4
-4
-6
-6
-8
-8
-10
-10
4
6
8
10
12
log2 (average signal)
14
B
8
6
log2 (ratio)
log2 (ratio)
8
16
4
6
8
10
12
14
16
log2 (average signal)
Figure 27 Plots displaying the global distribution of gene expression values for cells collected in
reactor 2 of the continuous culture of B. longum NCC2705 relatively to a) exponential phase and b)
early-stationary phase cells of B. longum NCC2705 batch cultures.
138
6.4 Discussion
The comparison of the gene expression patterns and of the organic acid formations
between reactor 1 and 2 of the continuous culture showed no major differences between
the cells from the two reactors. It is therefore assumable that cells in reactor 1 were in a
comparable physiological state as the cells in reactor 2, even though they had to be
transferred from one reactor to the next by pumping and that they were harvested 42 min
later.
In the continuous culture more acetic acid, formic acid and ethanol and less lactic acid
were produced compared to batch cultures. In batch cultures the majority of biomass and
metabolites are produced in the exponential phase by fast growing cells, whereas in the
continuous culture the cells grow at a slow rate. It was already shown in bifidobacteria
grown on different substrates, that slow consumption of the energy source leads to a
metabolic shift from lactic acid production to more acetic acid, formic acid, and ethanol
produced (Van der Meulen et al. 2006b), and our results are in line with these
observations.
The number of differentially expressed genes in continuously grown cells was higher in
the comparison to exponential cells than in the comparison to early stationary phase cells.
Approximately 60 % of the ORF’s in the hybridization with early stationary cells was
expressed. This means that less genes were expressed in stationary phase compared to
exponential phase, which parallels previous observations (Klijn (2005a).
The higher expression of genes in involved in carbohydrate transport and metabolism
(mainly transporter systems) in continuously grown cells parallels observation in
continuous cultures of Escherichia coli with glucose limitation compared to batch
cultures in exponential phase (Ihssen and Egli 2005). Here, a large number of upregulated genes encoding periplasmic binding proteins was observed, indicating that the
cells were prepared for high-affinity uptake of all types of carbon sources. On the
contrary, we did not observed such elevated expression in the comparison with stationary
phase cells. Most probably, entering stationary phase and the absence of glucose (Table
11) trigger a similar or stronger response as the low sugar levels in the continuous
culture.
139
Such a response, due to relief of glucose mediated repression, has been described in
Lactococcus lactis (Zomer et al. 2007). On the whole, cells produced continuously in
reactor 2 compared to exponential growing cells showed up regulation of genes involved
in carbohydrates transport and metabolism and repression of genes involved with
intracellular trafficking and energy production. A higher expression of genes involved
with the carbohydrates metabolism and a general repression of all other functions was
previously observed in stationary and early stationary cells compared to exponential cells
(Klijn 2005a).
The differences of continuously produced cells to early stationary cells were basically
restrained to higher expression of genes involved in carbohydrates metabolism and the
transcription machinery, probably due to sugar depletion in the early-stationary phase
batch culture and to small differences in growth rate.
Cells of B. longum NCC2705 in the two reactors of the 2-stage continuous system
described in chapter 3 were in a comparable physiological state. The continuously
produced cells grown at a low dilution rate of 0.1 h-1 were in a physiological state which
was only partially comparable to exponential and early-stationary phase cells. A refined
analysis of the distribution of differential expressed genes in functional COG categories
revealed that continuously grown cells at low dilution rate shared more similarities with
early stationary phase cells than with exponential phase cells, partially supporting the
Monod model (Monod 1950) that cells at low dilution rate in continuous culture should
be comparable to cells in batch culture at the end of exponential/beginning of stationary
growth phase.
140
7
References
Abee, T. and J.A. Wouters (1999). Microbial stress response in minimal processing.
International Journal of Food Microbiology 50: 65-91.
Baron, S., R.C. Peake, D.A. James, M. Susman, C.A. Kennedy, M.J.D. Singleton and S.
Schuenke (1996). Medical microbiology. S. Baron. Galveston (TX), University of Texas
Medical Branch.
Beerens, H., F. Gavini and C. Neut (2000). Effect of exposure to air on 84 strains of
bifidobacteria. Anaerobe 6: 65-67.
Berney, M., H.U. Weilenmann, J. Ihssen, C. Bassin and T. Egli (2006). Specific growth
rate determines the sensitivity of Escherichia coli to thermal, UVA, and solar
disinfection. Applied and Environmental Microbiology 72: 2586-2593.
Bernstein, C., H. Bernstein, C.M. Payne, S.E. Beard and J. Schneider (1999). Bile salt
activation of stress response promoters in Escherichia coli. Current Microbiology 39: 6872.
Bezirtzoglou, E. (1997). The intestinal microflora during the first weeks of life. Anaerobe
3: 173-177.
Biviati, B., V. Scardovi and W.E. C. Moore (1982). Electrophoretic patterns of proteins
in the genus Bifidobacterium and proposal of four new species. International Journal of
Systematic Bacteriology 32: 358-373.
Biviati, B. and P. Mattarelli (1991). Bifidobacterium ruminantium sp. nov. and
Bifidobacterium merycicum sp. nov. from the rumens of cattle. International Journal of
Systematic Bacteriology 41: 163-168.
141
Biavati, B., M. Vescovo, S. Torriani and V. Bottazzi (2000). Bifidobacteria: History,
ecology, physiology and applications. Annals of Microbiology 50: 117-131.
Biavati, B. and P. Mattarelli. (2001). "The family Bifidobacteriaceae. The prokaryotes:
an evolving electronic source." 3rd edition, release 3.7. 2006.
Blaut, M. and T. Clavel (2007). Metabolic diversity of the intestinal microbiota:
Implications for health and disease. Journal of Nutrition 137: 751s-755s.
Brazma, A. and J. Vilo (2001). Gene expression data analysis. Microbes and Infection 3:
823-829.
Breed, R.S. and E.G.D. Murray (1957). Bergey’s manual of determinative bacteriology
7th ed. N.R. Smith. Williams and Wilkins, Baltimore, MD.
Brown, P.O. and D. Botstein (1999). Exploring the new world of the genome with DNA
microarrays. Nature Genetics 21: 33-37.
Buchanan, R.E. (1974). Bergey’s manual of determinative bacteriology, 8th ed. N.E.E.
Gibbons. Williams and Wilkins, Baltimore, MD.
Bukau, B. and A.L. Horwich (1998). The HSP70 and HSP60 chaperone machines. Cell
92: 351-366.
Butler, P.R., M. Brown and S.G. Oliver (1996). Improvement of antibiotic titers from
Streptomyces bacteria by interactive continuous selection. Biotechnology and
Bioengineering 49: 185-196.
Casey, P.G. and S. Condon (2002). Sodium chloride decreases the bacteriocidal effect of
acid pH on Escherichia coli O57:H45. International Journal of Food Microbiology 76:
199-206.
142
Champagne, C.P. (2006). Starter cultures biotechnology: The production of concentrated
lactic cultures in alginate beads and their applications in the nutraceutical and food
industries. Chemical Industry & Chemical Engineering Quarterly 12: 11-17.
Champagne, C.P. and P. Fustier (2007). Microencapsulation for the improved delivery of
bioactive compounds into foods. Current Opinion in Biotechnology 18: 184-190.
Champagne, C.P., N.J. Gardner and D. Roy (2005). Challenges in the addition of
probiotic cultures to foods. Critical Reviews in Food Science and Nutrition 45: 61-84.
Charteris, W.P., P.M. Kelly, L. Morelli and J.K. Collins (1998a). Antibiotic susceptibility
of potentially probiotic Bifidobacterium isolates from the human gastrointestinal tract.
Letters in Applied Microbiology 26: 333-7.
Charteris, W.P., P.M. Kelly, L. Morelli and J.K. Collins (1998b). Development and
application of an in vitro methodology to determine the transit tolerance of potentially
probiotic Lactobacillus and Bifidobacterium species in the upper human gastrointestinal
tract. Journal of Applied Microbiology 84: 759-768.
Chung, H.J., W. Bang and M.A. Drake (2006). Stress response of Escherichia coli.
Comprehensive Reviews in Food Science and Food Safety 5: 52-64.
Cinquin, C., G. Le Blay, I. Fliss and C. Lacroix (2004). Immobilization of infant fecal
microbiota and utilization in an in vitro colonic fermentation model. Microbial Ecology
48: 128-38.
Cleveland, W.S. (1979). Robust locally weighted regression and smoothing scatterplots.
Journal of the American Statistical Association 74: 829-836.
Collado, M.C. and Y. Sanz (2007). Induction of acid resistance in Bifidobacterium: A
mechanism for improving desirable traits of potentially probiotic strains. Journal of
Applied Microbiology 103: 1147-1157.
143
Condon, S. (1987). Responses of lactic acid bacteria to oxygen. FEMS Microbiology
Reviews 46: 269-280.
Cotter, P.D. and C. Hill (2003). Surviving the acid test: Responses of gram-positive
bacteria to low pH. Microbiology and Molecular Biology Reviews 67: 429-453.
De Angelis, M., R. Di Cagno, C. Huet, C. Crecchio, P.F. Fox and M. Gobbetti (2004).
Heat shock response in Lactobacillus plantarum. Applied and Environmental
Microbiology 70: 1336-1346.
De Angelis, M. and M. Gobbetti (2004). Environmental stress responses in Lactobacillus:
A review. Proteomics 4: 106-122.
De Dea Lindner, J., C. Canchaya, Z. Zhang, E. Neviani, G.F. Fitzgerald, D. van Sinderen
and M. Ventura (2007). Exploiting Bifidobacterium genomes: The molecular basis of
stress response. International Journal of Food Microbiology 120: 13-24.
De Man, J.C., M. Rogosa and E.M. Sharpe (1960). A medium for the cultivation of
lactobacilli. Journal of Applied Bacteriology 23: 30-35.
De Vrese, M. and J. Schrezenmeir (2008). Probiotics, prebiotics, and synbiotics. Food
Biotechnology 111: 1-66.
Degnan, B.A. and G.T. Macfarlane (1994). Effect of dilution rate and carbon availability
on Bifidobacterium breve fermentation. Applied Microbiology and Biotechnology 40:
800-805.
Degnan, B.A. and G.T. Macfarlane (1995). Arabinogalactan utilization in continuous
cultures
of
Bifidobacterium
longum:
Effect
of
co-culture
with
Bacteroides
thetaiotaomicron. Anaerobe 1: 103-112.
144
Desmond, C., R.P. Ross, E. O'Callaghan, G. Fitzgerald and C. Stanton (2002). Improved
survival of Lactobacillus paracasei NFBC338 in spray-dried powders containing gum
acacia. Journal of Applied Microbiology 93: 1003-1011.
Dessen, A., A.M. Di Guilmi, T. Vernet and O. Dideberg (2001). Molecular mechanisms
of antibiotic resistance in gram-positive pathogens. Current Drug Targets. Infectious
Disorders 1: 63-77.
Devries, W. and A. Stoutham (1968). Fermentation of glucose lactose galactose mannitol
and xylose by bifidobacteria. Journal of Bacteriology 96: 472-478.
Doleyres, Y., C. Paquin, M. LeRoy and C. Lacroix (2002). Bifidobacterium longum
ATCC15707 cell production during free- and immobilized-cell cultures in MRS-whey
permeate medium. Applied Microbiology and Biotechnology 60: 168-173.
Doleyres, Y., I. Fliss and C. Lacroix (2004a). Continuous production of mixed lactic
starters containing probiotics using immobilized cell technology. Biotechnology Progress
20: 145-150.
Doleyres, Y., I. Fliss and C. Lacroix (2004b). Increased stress tolerance of
Bifidobacterium longum and Lactococcus lactis produced during continuous mixed-strain
immobilized-cell fermentation. Journal of Applied Microbiology 97: 527-539.
Doleyres, Y. and C. Lacroix (2005). Technologies with free and immobilised cells for
probiotic bifidobacteria production and protection. International Dairy Journal 15: 973988.
Dong, X.Z., Y.H. Xin, W.Y. Jian, X.L. Liu and D.W. Ling (2000). Bifidobacterium
thermacidophilum sp nov., isolated from an anaerobic digester. International Journal of
Systematic and Evolutionary Microbiology 50: 119-125.
145
Dressaire, C., E. Redon, H. Milhem, P. Besse, P. Loubière and M. Cocaign-Bousquet
(2008). Growth rate regulated genes and their wide involvement in the Lactococcus lactis
stress responses. BMC Genomics 9: 343.
Dunn, J., E. Heinzle, J. Ingham and J.E. Prenosil (2003). Biological reaction engineering:
Second edition. Weinheim, Wiley-Vch Verlag GmbH & Co. KGaA. Online ISBN:
9783527603053
Eberle, T. (1999). Handling of missing values in statistical software packages for
Windows. Sonderforschungsbereich 386, Paper 170, Ludwig-Maximilans-Universität
München, Institute für Statistik.
Eckburg, P.B. (2005). Diversity of the human intestinal microbial flora. Science 308:
1635-1638.
Ehrenreich, A. (2006). DNA microarray technology for the microbiologist: An overview.
Applied Microbiology and Biotechnology 73: 255-273.
El-Mansi, M., C.F. A. Bryce, A.L. Demain and A.R. Allman (2007). Fermentation
microbiology and biotechnology: An hystorical perspective. CRC Press, Taylor &
Francis Group Eds. London, UK.
FAO/WHO (2002). Joint FAO/WHO working group report on drafting guidelines for the
evaluation of probiotics in food. London, Ont., Canada.
Favier, CF., W. M. de Vos and A.D.L. Akkermans (2003). Development of bacterial and
bifidobacterial communities in feces of newborn babies. Anaerobe 9: 219-229.
Franchini, A.G. and T. Egli (2006). Global gene expression in Escherichia coli K-12
during short-term and long-term adaptation to glucose-limited continuous culture
conditions. Microbiology 152: 2111-2127.
146
Fuller, R. (1992). History and development of probiotics. Probiotics, the scientific basis.
Pp.1-8. R. Fuller. London, Chapman & Hall.
Garrigues, C.,P. Loubière, N.D. Lindley and M. Cocaign-Bousquet (1997). Control of the
shift from homolactic acid to mixed-acid fermentation in Lactococcus lactis:
Predominant role of the NADH/NAD+ ratio. Journal of Bacteriology 179: 5282-5287.
Gasser, F. (1994). Safety of lactic acid bacteria and their occurrence in human clinical
infections. Bulletin de l’Institut Pasteur 92: 45-67.
Girgis, H.S., J. Smith, J.B. Luchansky, and T.R. Klaenhammer. 2002. Stress adaptations
of lactic acid bacteria. In: Microbial adaptation to stress and safety of new-generation
foods. Yousef, A.E. and Juneja, V.K. (eds.): CRC Press, NY. pp. 159-212.
Goldin, B.R. and S.L. Gorbach (2008). Clinical indications for probiotics: An overview.
Clinincal Infectious Diseases 46: 96-100.
Gollub, J. and G. Sherlock (2006). Clustering microarray data. Methods in enzymology
411: 194-213.
Green, S.L. (1978). Case report: fatal anaerobic pulmonary infection due to
Bifidobacterium eriksonii. Postgraduate Medicine 63: 187-188.
Grill, J.P., S. Perrin and F. Schneider (2000). Bile salt toxicity to some bifidobacteria
strains: Role of conjugated bile salt hydrolase and pH. Canadian Journal of Microbiology
46: 878-884.
Gueimonde, M.,K. Laitinen, S. Salminen and E. Isolauri (2007). Breast milk: A source of
bifidobacteria for infant gut development and maturation? Neonatology 92: 64-66.
Ha, G.Y., C.H. Yang, H. Kim and Y. Chong (1999). Case of sepsis caused by
Bifidobacterium longum. Journal of Clinical Microbiology 37: 1227-1228.
147
Hao, W.L. and Y.K. Lee, (2004) Microflora of the gastrointestinal tract. In Methods in
molecular biology. Vol 268. Public health microbiology: methods and protocols pp. 491502 (Spencer, J.F.T. and Ragout de Spencer, A.L. ed.) Humana Press Inc., Totowa, NJ,
USA
Harmsen, H.J.M., A.C. Wildeboer-Veloo and G.C. Raangs (2000). Analysis of intestinal
flora development in breast-fed and formula-fed infants by using molecular identification
and detection methods. Journal of Pediatric Gastroenterology and Nutrition 30: 61-67.
Hartl, F.U. (1996). Molecular chaperones in cellular protein folding. Nature 381: 571580.
Helmann, J.D. (2002). The extracytoplasmic function (ECF) sigma factors. Advances in
Microbial Physiology 46: 47-110.
Hokamp, K., F.M. Roche, M. Acab, M.E. Rousseau, B. Kuo, D. Goode, D. Aeschliman,
J. Bryan, L.A. Babiuk, RE. W. Hancock and F.S.L. Brinkman (2004). Arraypipe: A
flexible processing pipeline for microarray data. Nucleic Acids Research 32: 457-459.
Hoskisson, P.A. and G. Hobbs (2005). Continuous culture: making a comeback?
Microbiology 151: 3153-3159.
Hoyles, L., E. Inganas, E. Falsen, M. Drancourt, N. Weiss, A.L. McCartney and M.D.
Collins (2002). Bifidobacterium scardovii sp nov., from human sources. International
Journal of Systematic and Evolutionary Microbiology 52: 995-999.
Ihssen, J. and T. Egli (2005). Global physiological analysis of carbon- and energy-limited
growing Escherichia coli confirms a high degree of catabolic flexibility and preparedness
for mixed substrate utilization. Environmental Microbiology 7: 1568-1581.
Imlay, J.A. (2002). How oxygen damages microbes: Oxygen tolerance and obligate
anaerobiosis. Advances in Microbial Physiology 46: 111-53.
148
Kanehisa, M. (1997). A database for post-genome analysis. Trends in Genetics 13: 375376.
Kastner, S., V. Perreten, H. Bleuler, G. Hugenschmidt, C. Lacroix and L. Meile (2006).
Antibiotic susceptibility patterns and resistance genes of starter cultures and probiotic
bacteria used in food. Systematic and Applied Microbiology 29: 145-155.
Kawasaki, S., T. Mimura, T. Satoh, K. Takeda and Y. Niimura (2006). Response of the
microaerophilic Bifidobacterium species, B. boum and B. thermophilum, to oxygen.
Applied and Environmental Microbiology 72: 6854-8.
Kawasaki, S., M. Nagasaku, T. Mimura, H. Katashima, S. Ijyuin, T. Satoh and Y.
Niimura (2007). Effect of CO2 on colony development by Bifidobacterium species.
Applied and Environmental Microbiology 73: 7796-8.
Kawasaki, S., T. Satoh, M. Todoroki and Y. Niimura (2009). b-type dihydroorotate
dehydrogenase is purified as a H2O2-forming NADH oxidase from Bifidobacterium
bifidum. Applied and Environmental Microbiology 75: 629-636.
Kerkhoven, R., F.H.J. van Enckevort, J. Boekhorst, D. Molenaar and R. J. Siezen (2004).
Visualization for genomics: The microbial genome viewer. Bioinformatics 20: 18121814.
Kheadr, E., N. Bernoussi, C. Lacroix and I. Fliss (2004). Comparison of the sensitivity of
commercial strains and infant isolates of bifidobacteria to antibiotics and bacteriocins.
International Dairy Journal 14: 1041-1053.
Kiley, P.J. and G. Storz (2004). Exploiting thiol modifications. PLoS Biology 2: e400.
Klaassens, E.S. (2007). Exploring the functionality of intestinal bifidobacteria: A postgenomics approach. PhD Thesis. Wageningen University and Research Centre, The
Netherlands.
149
Klijn, A. (2005a). Physiological and molecular characterization of stress responses in
Bifidobacterium longum NCC2705. PhD Thesis. Department of Microbiology, University
College Cork, Ireland.
Klijn, A., A. Mercenier and F. Arigoni (2005b). Lessons from the genomes of
bifidobacteria. FEMS Microbiology Reviews 29: 491-509.
Koch, S., G. Oberson, E. Eugster-Meier, L. Meile and C. Lacroix (2007). Osmotic stress
induced by salt increases cell yield, autolytic activity, and survival of lyophilization of
Lactobacillus delbrueckii subsp. lactis. International Journal of Food Microbiology 117:
36-42.
Kohanski, M.A., D.J. Dwyer, B. Hayete, C.A. Lawrence and J.J. Collins (2007). A
common mechanism of cellular death induced by bactericidal antibiotics. Cell 130: 797810.
Krogh, A., B. Larsson, G. von Heijne and E.L.L. Sonnhammer (2001). Predicting
transmembrane protein topology with a hidden markov model: Application to complete
genomes. Journal of Molecular Biology 305: 567-580.
Lacroix, C., F. Grattepanche, Y. Doleyres and D. Bergmaier (2005). Immobilized cell
technologies for dairy industry. Application of cell immobilisation biotechnology. Focus
on biotechnology vol. 8b, Springer-Verlag: 295-319.
Lacroix, C. and S. Yildirim (2007). Fermentation technologies for the production of
probiotics with high viability and functionality. Current Opinion in Biotechnology 18:
176-183.
Lamboley, L., C. Lacroix, C.P. Champagne and J.C. Vuillemard (1997). Continuous
mixed strain mesophilic lactic starter production in supplemented whey permeate
medium using immobilized cell technology. Biotechnology and Bioengineering 56: 502516.
150
Lane, P.G., S.G. Oliver and P.R. Butler (1999). Analysis of a continuous culture
technique for the selection of mutants tolerant to extreme environmental stress.
Biotechnology and Bioengineering 65: 397-406.
Lauer, E. (1990). Bifidobacterium-gallicum sp. nov. isolated from human feces.
International Journal of Systematic Bacteriology 40: 100-102.
Leahy, S.C., D.G. Higgins, G.F. Fitzgerald and D. van Sinderen (2005). Getting better
with bifidobacteria. Journal of Applied Microbiology 98: 1303-1315.
Lee, G.J., A.M. Roseman, H.R. Saibil and E. Vierling (1997). A small heat shock protein
stably binds heat-denatured model substrates and can maintain a substrate in a foldingcompetent state. EMBO Journal 16: 659-671.
Lian, W.C., H.C. Hsiao and C.C. Chou (2002). Survival of bifidobacteria after spraydrying. International Journal of Food Microbiology 74: 79-86.
Liu, Z., Z. Jiang, K. Zhou, P. Li, G. Liu and B. Zhang (2007). Screening of bifidobacteria
with acquired tolerance to human gastrointestinal tract. Anaerobe 13: 215-219.
Mallett, T.C. and A. Claiborne (1998). Oxygen reactivity of an NADH oxidase C42S
mutant:
Evidence
for
a
c(4a)-peroxyflavin
intermediate
and
a
rate-limiting
conformational change. Biochemistry 37: 8790-802.
Mallory, A., F. Kern, J. Smith and D. Savage (1973). Patterns of bile-acids and
microflora in human small-intestine .1. Bile-acids. Gastroenterology 64: 26-33.
Mantzourani, M., M. Fenlon and D. Beighton (2009). Association between
Bifidobacteriaceae and the clinical severity of root caries lesions. Oral Microbiology and
Immunology 24: 32-37.
151
Masco, L., M. Ventura, R. Zink, G. Huys and J. Swings (2004). Polyphasic taxonomic
analysis of Bifidobacterium animalis and Bifidobacterium lactis reveals relatedness at the
subspecies level: Reclassification of Bifidobacterium animalis as Bifidobacterium
animalis subsp. animalis subsp. nov and Bifidobacterium lactis as Bifidobacterium
animalis subsp. lactis subsp. nov. International Journal of Systematic and Evolutionary
Microbiology 54: 1137-1143.
Matteuzzi, D., F. Crociani, G. Zani and L.D. Trovatelli (1971). Bifidobacterium suis n.
sp.: A new species of the genus Bifidobacterium isolated from pig feces. Zeitschrift für
allgemeine Mikrobiologie 1: 387-395.
Maus, J.E. and S.C. Ingham (2003). Employment of stressful conditions during culture
production to enhance subsequent cold- and acid-tolerance of bifidobacteria. Journal of
Applied Microbiology 95: 146-154.
Maxwell, F.J., S.H. Duncan, G. Hold and C.S. Stewart (2004). Isolation, growth on
prebiotics and probiotics potential of novel bifidobacteria from pigs. Anaerobe 10: 33-39.
Meile, L., L.M. Rohr, T.A. Geissmann, M. Herensperger, and M. Teuber (2001).
Characterization of the D-xylulose 5-phosphate/D-fructose 6-phosphate phosphoketolase
gene(xfp) from Bifidobacterium lactis. Journal of Bacteriology 183: 2929-2936.
Meile, L., W. Ludwig, U. Rueger, C. Gut, P. Kaufmann, G. Dasen, S. Wenger and M.
Teuber (1997). Bifidobacterium lactis sp. nov., a moderately oxygen tolerant species
isolated from fermented milk. Systematic and Applied Microbiology 20: 57-64.
Meile, L., G. Le Blay and A. Thierry (2008). Safety assessment of dairy microorganisms:
Propionibacterium and Bifidobacterium. International Journal of Food Microbiology 126:
316-320.
Melchiorsen, C.R., K.V. Jokumsen, J. Villadsen, H. Israelsen and J. Arnau (2002). The
level of pyruvate-formate lyase controls the shift from homolactic to mixed-acid product
formation in Lactococcus lactis. Applied Microbiology and Biotechnology 58: 338-344.
152
Mitsuoka, T. 1969. Comparative studies on bifidobacteria isolated from the alimentary
tract of man and animals (including descriptions of Bifidobacterium thermophilum nov.
spec. and Bifidobacterium pseudolongum nov. spec.). Zentralblatt für Bakteriologie,
Parasitenkunde, Infektionskrankheiten und Hygiene. 1. Abt. Medizinisch-hygienische
Bakteriologie, Virusforschung und Parasitologie. Originale 210:52-64.
Modesto, M., B. Biavati and P. Mattarelli (2006). Occurrence of the family
Bifidobacteriaceae in human dental caries and plaque. Caries Research 40: 271-276.
Monje-Casas, F., J. Jurado, M.J. Prieto-Alamo, A. Holmgren and C. Pueyo (2001).
Expression analysis of the NRDHIEF operon from Escherichia coli: conditions that
trigger the transcript level in vivo. Journal of Biological Chemistry 276: 18031-18037.
Monod, J. (1950). La technique de culture continue, theorie etapplications. Annals
Institute Pasteur 79: 390–410.
Morgan, C.A., N. Herman, P.A. White and G. Vesey (2006). Preservation of microorganisms by drying; a review. Journal of Microbiological Methods 66: 183-193.
Moubareck, C., F. Gavini, L. Vaugien, M.J. Butel and F. Doucet-Populaire (2005).
Antimicrobial susceptibility of bifidobacteria. Journal of Antimicrobial Chemotherapy
55: 38-44.
Narberhaus, F. (1999). Negative regulation of bacterial heat shock genes. Molecular
Microbiology 31: 1-8.
Narendranath, N.V., K.C. Thomas and W.M. Ingledew (2000). Urea hydrogen peroxide
reduces the numbers of lactobacilli, nourishes yeast, and leaves no residues in the ethanol
fermentation. Applied and Environmental Microbiology 66: 4187-4192.
Ninomiya, K., K. Matsuda, T. Kawahata, T. Kanaya, M. Kohno, Y. Katakura, M. Asada
and S. Shioya (2009). Effect of CO2 concentration on the growth and exopolysaccharide
153
production of Bifidobacterium longum cultivated under anaerobic conditions. Journal of
Bioscience and Bioengineering 107: 535-537.
Noack, D., R. Geuther, M. Tonew, R. Breitling and D. Behnke (1988). Expression and
secretion of interferon-alpha-1 by Streptomyces lividans: use of staphylokinase signals
and amplification of a neo gene. Gene 68: 53-62.
Noriega, L., M. Gueimonde, B. Sanchez, A. Margolles and C.G. de los Reyes-Gavilan
(2004). Effect of the adaptation to high bile salts concentrations on glycosidic activity,
survival at low pH and cross-resistance to bile salts in Bifidobacterium. International
Journal of Food Microbiology 94: 79-86.
Noriega, L., C.G. de los Reyes-Gavilan and A. Margolles (2005). Acquisition of bile salt
resistance promotes antibiotic susceptibility changes in Bifidobacterium. Journal of Food
Protection 68: 1916-1919.
Orla-Jensen, S. (1924). La classification des bactéries lactiques. Lait 4: 468-474.
Ouwehand, A.C. and S.J. Salminen (1998). The health effects of cultured milk products
with viable and non-viable bacteria. International Dairy Journal 8: 749-758.
Palmer, C., E.M. Bik, D.B. Di Giulio, D.A. Relman and P.O. Brown (2007).
Development of the human infant intestinal microbiota. PLoS Biology 5: 1556-1573.
Palmfeldt, J., M. Paese, B. Hahn-Hagerdal and E.W.J. Van Niel (2004). The pool of ADP
and ATP regulates anaerobic product formation in resting cells of Lactococcus lactis.
Applied and Environmental Microbiology 70: 5477-5484.
Parche, S., M. Beleut, E. Rezzonico, D. Jacobs, F. Arigoni, F. Titgemeyer and I. Jankovic
(2006). Lactose-over-glucose preference in Bifidobacterium longum NCC2705: glcP,
encoding a glucose transporter, is subject to lactose repression. Journal of Bacteriology
188: 1260-1265.
154
Parche, S., J. Amon, I. Jankovic, E. Rezzonico, M. Beleut, H. Barutcu, I. Schendel, M.P.
Eddy, A. Burkovski, F. Arigoni and F. Titgemeyer (2007). Sugar transport systems of
Bifidobacterium
longum
NCC2705.
Journal
of
Molecular
Microbiology
and
Biotechnology 12: 9-19.
Parvez, S., K.A. Malik, S.A. Kang and H.Y. Kim (2006). Probiotics and their fermented
food products are beneficial for health. Journal of Applied Microbiology 100: 1171-1185.
Payne, C.M., C. Crowley, D. Washo-Stultz, M. Briehl, H. Bernstein, C. Bernstein, S.
Beard, H. Holubec and J. Warneke (1998). The stress-response proteins poly(ADPribose) polymerase and NF-kappaB protect against bile salt-induced apoptosis. Cell
Death and Differentiation 5: 623-636.
Perez, P.F., J. Doré, M. Leclerc, F. Levenez, J. Benyacoub, P. Serrant, I. Segura-Roggero,
E.J. Schiffrin and A. Donnet-Hughes (2007). Bacterial imprinting of neonatal immune
system: Lesson from maternal cells? Pediatrics 119: 724-732.
Picot, A. and C. Lacroix (2004). Encapsulation of bifidobacteria in whey protein-based
microcapsules and survival in simulated gastrointestinal conditions and in yoghurt.
International Dairy Journal 14: 505-515.
Pieterse, B. (2006). Transcriptome analysis of the lactic acid and NaCl-stress response of
Lactobacillus plantarum. PhD Thesis. ISBN 90-8504-404-9. Wageningen Centre for
Food Sciences, Wageningen University. The Netherlands.
Potrykus, K. and M. Cashel (2008). (p)ppGpp: Still magical? Annual Review of
Microbiology 62: 35-51.
Price, C.E., S.J. Reid, A.J. Driessen and V.R. Abratt (2006). The Bifidobacterium longum
NCIMB 702259T ctr gene codes for a novel cholate transporter. Applied and
Environmental Microbiology 72: 923-6.
155
Pridmore, R.D., B. Berger, F. Desiere, D. Vilanova, C. Barretto, A.C. Pittet, M.C.
Zwahlen, M. Rouvet, E. Altermann, R. Barrangou, B. Mollet, A. Mercenier, T.
Klaenhammer, F. Arigoni and M.A. Schell (2004). The genome sequence of the probiotic
intestinal bacterium Lactobacillus johnsonii NCC533. Proceedings of the National
Academy of Sciences of the United States of America 101: 2512-2517.
Quackenbush, J. (2002). Microarray data normalization and transformation. Nature
Genetics 32: 496-501.
Ray, B. (2004). Fundamental food microbiology. 3rd edition. Florida, CRC Press.
Redon, E., P. Loubière and M. Cocaign-Bousquet (2005). Transcriptome analysis of the
progressive adaptation of Lactococcus lactis to carbon starvation. Journal of Bacteriology
187: 3589-3592.
Reuter, G. (1963). Comparative studies on the Bifidus flora in the feces of infants and
adults. With a contribution to classification and nomenclature of Bifidus strains.
Zentralblatt für Bakteriologie, Parasitenkunde, Infektionskrankheiten und Hygiene. 1.
Abt. Medizinisch-hygienische Bakteriologie, Virusforschung und Parasitologie. Originale
191: 486-507.
Rezzonico, E., S. Lariani, C. Barretto, G. Cuanoud, G. Giliberti, M. Delley, F. Arigoni
and G. Pessi (2007). Global transcriptome analysis of the heat shock response of
Bifidobacterium longum. FEMS Microbiology Letters 271: 136-145.
R Development Core Team (2007) R: A language and environment for statistical
computing. R Foundation for Statistical Computing, Vienna, Austria. ISBN 3-900051-070, URL http://www.R-project.org.
Rocha, E.R. and C.J. Smith (1998). Characterization of a peroxide-resistant mutant of the
anaerobic bacterium Bacteroides fragilis. Journal of Bacteriology 180: 5906-5912.
156
Roissard F. and M. Luquet (1994). Bactéries lactiques : Aspects fondamentaux et
technologiques. Uriage, Lorica 1: 380-410.
Ross, R.P., C. Desmond, G.F. Fitzgerald and C. Stanton (2005). Overcoming the
technological hurdles in the development of probiotic foods. Journal of Applied
Microbiology 98: 1410-1417.
Saarela, M., J. Mättö and T. Mattila-Sandholm (2002). Safety aspects of Lactobacillus
and Bifidobacterium species originating from human oro-gastrointestinal tract or from
probiotic products. Microbial Ecology in Health and Diseases of the Colon & Rectum 14:
233-240.
Saarela, M., M. Rantala, K. Hallamaa, L. Nohynek, I. Virkajarvi and J. Matto (2004).
Stationary-phase acid and heat treatments for improvement of the viability of probiotic
lactobacilli and bifidobacteria. Journal of Applied Microbiology 96: 1205-1214.
Saarela, M., I. Virkajarvi, H.L. Alakomi, T. Mattila-Sandholm, A. Vaari, T. Suomalainen
and J. Matto (2005). Influence of fermentation time, cryoprotectant and neutralization of
cell concentrate on freeze-drying survival, storage stability, and acid and bile exposure of
Bifidobacterium animalis ssp. lactis cells produced without milk-based ingredients.
Journal of Applied Microbiology 99: 1330-1339.
Sakata, S., M. Kitahara, M. Sakamoto, H. Hayashi, M. Fukuyama and Y. Benno (2002).
Unification of Bifidobacterium infantis and Bifidobacterium suis as Bifidobacterium
longum. International Journal of Systematic and Evolutionary Microbiology 52: 19451951.
Sanchez, B., M.C. Champomier-Verges, P. Anglade, F. Baraige, C.G.D. Reyes-Gavilan,
A. Margolles and M. Zagorec (2005). Proteomic analysis of global changes in protein
expression during bile salt exposure of Bifidobacterium longum NCIMB 8809. Journal of
Bacteriology 187: 5799-5808.
157
Sanchez, B., C.G.D. Reyes-Gavilan and A. Margolles (2006). The F1F0-ATPase of
Bifidobacterium animalis is involved in bile tolerance. Environmental Microbiology 8:
1825-1833.
Sanchez, B., M.C. Champomier-Vergès, M. Del Carmen Collado, P. Anglade, F. Baraige,
Y. Sanz, C.G. de Los Reyes-Gavilan, A. Margolles and M. Zagorec (2007a). Low pH
adaptation and the acid tolerance response of Bifidobacterium longum biotype longum.
Applied and Environmental Microbiology 73: 6450-6459.
Sanchez, B., M.C. Champomier-Vergès, B. Stuer-Lauridsen, P. Ruas-Madiedo, P.
Anglade, F. Baraige, C.G. de Los Reyes-Gavilan, E. Johansen, M. Zagorec and A.
Margolles (2007b). Adaptation and response of Bifidobacterium animalis subsp. lactis to
bile: A proteomic and physiological approach. Applied and Environmental Microbiology
73: 6757-6767.
Sanchez, B., L. Ruiz, C.G. de los Reyes-Gavilan and A. Margolles (2008). Proteomics of
stress response in Bifidobacterium. Frontiers in Bioscience 13: 6905-6919.
Sanders, M.E., D.C. Walker, K.M. Walker, K. Aoyama and T.R. Klaenhammer (1996).
Performance of commercial cultures in fluid milk applications. Journal of Dairy Science
79: 943-955.
Savijoki, K., A. Suokko, A. Palva, L. Valmu, N. Kalkkinen and P. Varmanen (2005).
Effect of heat-shock and bile salts on protein synthesis of Bifidobacterium longum
revealed by [s-35]methionine labelling and two-dimensional gel electrophoresis. FEMS
Microbiology Letters 248: 207-215.
Saxelin, M., S. Tynkkynen, T. Mattila-Sandholm and W.M. de Vos (2005). Probiotic and
other functional microbes: From markets to mechanisms. Current Opinion in
Biotechnology 16: 204-211.
158
Scardovi, V. and D. Trovatelli (1969). New species of bifidobacteria from Apis mellifica
L. and Apis indica F. A contribution to the taxonomy and biochemistry of the genus
Bifidobacterium. Zentralblatt für Bakteriologie, Parasitenkunde, Infektionskrankheiten
und Hygiene. Zweite naturwissenschaftliche Abt.: Allgemeine, landwirtschaftliche und
technische Mikrobiologie 12: 64-88.
Scardovi, V. and F. Crociani (1974). Bifidobacterium catenulatum, Bifidobacterium
dentium, and Bifidobacterium angulatum: 3 new species and their deoxyribonucleic-acid
homology relationships. International Journal of Systematic Bacteriology 24: 6-20.
Scardovi, V., L.D. Trovatelli, B. Biavati and G. Zani (1979). Bifidobacterium cuniculi,
Bifidobacterium
choerinum,
Bifidobacterium
boum,
and
Bifidobacterium
pseudocatenulatum: 4 new species and their deoxyribonucleic-acid homology
relationships. International Journal of Systematic Bacteriology 29: 291-311.
Schell, M.A., M. Karmirantzou, B. Snel, D. Vilanova, B. Berger, G. Pessi, M.C.
Zwahlen, F. Desiere, P. Bork, M. Delley, R.D. Pridmore and F. Arigoni (2002). The
genome sequence of Bifidobacterium longum reflects its adaptation to the human
gastrointestinal tract. PNAS 99: 14422-14427.
Schmidt, G. and R. Zink (2000). Basic features of the stress response in three species of
bifidobacteria: B. longum, B. adolescentis, and B. breve. International Journal of Food
Microbiology 55: 41-45.
Schrezenmeir, J. and M. de Vrese (2001). Probiotics, prebiotics, and synbioticsapproaching a definition. The American journal of clinical nutrition 73: 361S-364S.
Segal, G. and E.Z. Ron (1996). Regulation and organization of the groE and dnaK
operons in Eubacteria. FEMS Microbiology Letters 138: 1-10.
Shanahan, F. ( 2002). The host-microbe interface within the gut. Best Practice & Resarch.
Clinical Gastroenterology 16: 915–931.
159
Shiuann, Y.S., M.C. Chen and C.C. Liao (1998). Bifidobacteria strains with acid, bile salt
and oxygen tolerance and their culture method. U.S. patent, Food Industry Research and
Development Institute, Hsinchu, Taiwan. 5,711,977.
Simpson, P.J., R.P. Ross, G.F. Fitzgerald and C. Stanton (2004). Bifidobacterium
psychraerophilum sp. nov. and Aeriscardovia aeriphila gen. nov., sp. nov., isolated from
a porcine caecum. International Journal of Systematic and Evolutionary Microbiology 54:
401-406.
Simpson, P.J., C. Stanton, G.F. Fitzgerald and R.P. Ross (2005). Intrinsic tolerance of
Bifidobacterium species to heat and oxygen and survival following spray drying and
storage. Journal of Applied Microbiology 99: 493-501.
Smyth, G.K. (2004). Linear models and empirical bayes methods for assessing
differential expression in microarray experiments. Statistical Applications in Genetics
and Molecular Biology 3: Article 3.
Stackebrandt, E., F.A. Rainey and N.L. WardRainey (1997). Proposal for a new
hierarchic classification system, Actinobacteria classis nov. International Journal of
Systematic Bacteriology 47: 479-491.
Stevens, M. (2008). Transcriptome response of Lactobacillus plantarum to global
regulatory deficiency, stress and other environmental conditions. PhD Thesis. ISBN: 97890-8504-869-5. Wageningen centre for food sciences. Wageningen University. The
Netherlands.
Talwalkar, A. and K. Kailasapathy (2004). The role of oxygen in the viability of probiotic
bacteria with reference to L. acidophilus and Bifidobacterium spp. Current issues in
intestinal microbiology 5: 1-8
Tannock, G.W. (2002). Probiotics and prebiotics: Where are we going? Ed. Caister
Academic Press, Wymondham, UK
160
Termont, S., K. Vandenbroucke, D. Iserentant, S. Neirynck, L. Steidler, E. Remaut and P.
Rottiers (2006). Intracellular accumulation of trehalose protects Lactococcus lactis from
freeze-drying damage and bile toxicity and increases gastric acid resistance. Applied and
Environmental Microbiology 72: 7694-7700.
Trovatelli, L.D., F. Crociani, M. Pedinott and V. Scardovi (1974). Bifidobacterium
pullorum sp. nov. new species isolated from chicken feces and a related group of
Bifidobacteria isolated from rabbit feces. Archives of Microbiology 98: 187-198.
Turroni, F., A. Ribbera, E. Foroni, D. van Sinderen and M. Ventura (2008). Human gut
microbiota and bifidobacteria: From composition to functionality. Antonie Van
Leeuwenhoek International Journal of General and Molecular Microbiology 94: 35-50.
van Baarlen, P., F.J. Troosta, S. van Hemerta, C. van der Meera, W.M. de Vos, P.J. de
Groota, G.J.E.J. Hooivelda, R.M. Brummera and M. Kleerebezema (2009). Differential
NF-kB pathways induction by Lactobacillus plantarum in the duodenum of healthy
humans correlating with immune tolerance. Proceedings of the National Academy of
Sciences of the United States of America106: 2371-2376.
van de Guchte, M., P. Serror, C. Chervaux, T. Smokvina, S.D. Ehrlich and E. Maguin
(2002). Stress responses in lactic acid bacteria. Antonie Van Leeuwenhoek International
Journal of General and Molecular Microbiology 82: 187-216.
Van der Meulen, R., T. Adriany, K. Verbrugghe and L. de Vuyst (2006). Kinetic analysis
of bifidobacterial metabolism reveals a minor role for succinic acid in the regeneration of
NAD(+) through its growth-associated production. Applied and Environmental
Microbiology 72: 5204-5210.
Van der Meulen, R., L. Makras, K. Verbrugghe, T. Adriany and L. de Vuyst (2006). In
vitro kinetic analysis of oligofructose consumption by Bacteroides and Bifidobacterium
spp. indicates different degradation mechanisms. Applied and Environmental
Microbiology 72: 1006-1012.
161
Vasijevic, T. and N.P. Shah (2008). Probiotics - from Metchnikoff to bioactives.
International Dairy Journal 18: 714-728.
Vaughan, E.E., M.C. de Vries, E.G. Zoetendal, K. Ben-Amor, A.D.L. Akkermans and
W.M. de Vos (2002). The intestinal labs. Antonie Van Leeuwenhoek 82: 341-352.
Ventura, M., D. van Sinderen, G.F. Fitzgerald and R. Zink (2004b). Insights into the
taxonomy, genetics and physiology of bifidobacteria. Antonie Van Leeuwenhoek
International Journal of General and Molecular Microbiology 86: 205-223.
Ventura, M., C. Canchaya, Z. Zhang, G. F. Fitzgerald and D. van Sinderen (2007).
Molecular characterization of hsp20, encoding a small heat shock protein of
Bifidobacterium breve UCC2003. Applied and Environmental Microbiology 73: 46954703.
Ventura, M., C. Canchaya, Z.D. Zhang, V. Bernini, G.F. Fitzgerald and D. van Sinderen
(2006). How high G+C Gram-positive bacteria and in particular bifidobacteria cope with
heat stress: Protein players and regulators. FEMS Microbiology Reviews 30: 734-759.
von Ah, U., V. Mozzetti, C. Lacroix, E. Kheadr, I. Fliss and L. Meile (2007).
Classification of a moderately oxygen-tolerant isolate from baby faeces as
Bifidobacterium thermophilum. BMC Microbiology 7: 79.
Wang, Z., M. Gerstein and M. Snyder (2009). RNA-Seq: a revolutionary tool for
transcriptomics. Nature Reviews Genetics 10: 57-63.
Watebe, J., Y. Benno and T. Mitsuoka (1983). Bifidobacterium gallinarium sp. nov.: a
new species isolated from ceca chickens. International Journal of Systematic
Bacteriology 33: 127-132.
Weisblum, B. and J. Davies (1968). Antibiotic inhibitors of the bacterial ribosome.
Bacteriological Reviews 32: 493-528.
162
Whitman, W.B., D.C. Coleman and W.J. Wiebe (1998). Prokaryotes: The unseen
majority. Proceedings of the National Academy of Sciences of the United States of
America 95: 6578-6583.
Wolber, P.K., P.J. Collins, A.B. Lucas, A. de Witte and K.W. Shannon (2006). The
agilent in situ-synthesized microarray platform. DNA microarrays part a: Array platforms
and wet-bench protocols. 410: 28-57.
Yaeshima, T., T. Fujisawa and T. Mitsuoka (1992). Bifidobacterium globosum,
subjective
synonym
of
Bifidobacterium
pseudolongum,
and
description
of
Bifidobacterium pseudolongum subsp. pseudolongum comb. nov. and Bifidobacterium
pseudolongum subsp. globosum comb. nov. Systematic and Applied Microbiology 15:
380-385.
Zhang, Z., S. Schwartz, L. Wagner and W. Miller (2000). A greedy algorithm for
aligning DNA sequences. Journal of Computational Biology 7: 203-214.
Zomer, A.L., G. Buist, R. Larsen, J. Kok and O.P. Kuipers (2007). Time-resolved
determination of the CcpA regulon of Lactococcus lactis subsp. cremoris MG1363.
Journal of Bacteriology 189: 1366-1381.
163
Acknowledgements
I thank Christophe Lacroix, Leo Meile, Franck Grattepanche, Bernard Berger and Enea
Rezzonico for the supervision during this project. Many thanks go to Stefan Truttman for
his valuable support during the continuous culture experiments, David Stucki for his
precise working with batch cultures, Sebastian Reimann for agreeable collaboration,
Déborah Moine for carefully teaching the microarray techniques, Marc Stevens for
fruitful scientific discussions and to past and present colleagues of the Laboratory of
Food Biotechnology who participated in one way or the other to this work through their
scientific and technical help as well as for the friendly working atmosphere.
A big thank go to my family and friends, which supported me during this time, especially
to mamma, papà Flavio, papà Giovanni, nonna Lidia, nonna Frida, nonno Vilio, zia
Claudia & Co., Lu, Giuly, Sofi, Véro e Nicc.
This study was carried out thanks to the financial support of the Commission of
Technology and Innovation of Switzerland (CTI-Project Nr. 75272 LSPP-LS), Nestle
(Switzerland) and the the Walter Hochstrasser Foundation.
164
Curriculum vitae
VALERIA MOZZETTI
Born November 10, 1980
Citizen of Vogorno (TI)
Switzerland
2005-2009
SWISS FEDERAL INSTITUTE OF TECHNOLOGY, ZURICH
PhD Thesis at the Laboratory of Food Biotechnology
1999-2004
SWISS FEDERAL INSTITUTE OF TECHNOLOGY, ZURICH
Diploma in Food Science, with major in Food Biotechnology, Food
Chemistry and Food Microbiology (dipl. Lm-Ing. ETH)
1996-1999
LICEO CANTONALE DI MENDRISIO
Matura type B
165
© Copyright 2026 Paperzz