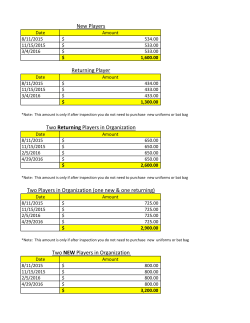
DG AGRI DASHBOARD: APPLES
INDEX
PRICES
PROD.
TRADE
BALANCE
EU AVG PRICES
MS PRICES
Apple prices in the EU (€/100kg=Euro cents/kg)
€/100 kg
€/100 kg
75
Current 2016/17
Monthly 5 year MAX
5 year avg
Monthly 5 year MIN
75
70
65
65
65
58
56
52
53
58
58
58
54
54
53
54
53
50
50
59
52
50
55
56
52
52
49
50
59
59
59
55
54
54
42
35
35
33
31
28
26
26
25
27
23
22
20
45
44
21
Oct
Nov
Dec
Jan
Feb
Mar
28
26
26
Apr
May
Jun
Jul
31
24
23
19
20
25
26
32
76
30
31
Sep
Oct
€/100 kg
76
75
75
70
69
71
70
71
66
65
65
Dec
Jan
Feb
Mar
Apr
May
Jun
Jul
65
65
66
65
65
66
60
55
15
Nov
76
YEAR
Aug
52
52
52
53
Sep
Oct
Nov
Dec
71
56
68
67
55
Feb
Mar
59
Apr
May
56
54
Jan
Jun
62
110
(Previous) 2015/16
66% upper line
66% lower line
103
101
101
99
99
48
45
45
84
86
84
80
81
79
84
80
80
78
75
81
79
78
80
79
75
68
71
70
69
72
72
77
78
Sep
Oct
Nov
Dec
Jan
Feb
Mar
Apr
May
Jun
66
Jul
39
39
38
33
31
30
23
22
20
YEAR
Aug
Sep
30
29
Oct
Nov
Dec
Jan
29
Current 2016/17
Monthly 5 year MAX
5 year avg
Monthly 5 year MIN
28
26
25
70
67
66
40
38
25
71
44
42
40
39
30
77
73
71
48
46
44
37
37
32
33
75
74
69
40
36
82
44
42
42
41
42
41
39
40
35
82
81
78
75
Aug
80
79
39
38
84
82
41
50
48
46
86
84
84
70
65
40
86
85
84
83
50
47
47
43
90
87
90
86
85
49
48
47
46
46
44
88
90
Those "producer" prices are ex packaging
station, sorted and packaged
49
50
Those "producer" prices are ex packaging
station, sorted and packaged
96
96
95
56
51
103
99
100
60
60
57
57
107
105
105
YEAR
59
58
57
56
55
106
Jul
61
60
60
114
112
62
60
60
61
115
70
Apple prices in Germany (€/100kg=Euro cents/kg)
€/100 kg
120
Current 2016/17
Monthly 5 year MAX
5 year avg
Monthly 5 year MIN
75
69
67
64
Apple prices in France (€/100kg=Euro cents/kg)
121
75
70
69
66
66
66
67
50
Aug
78
76
68
74
18
17
71
69
60
19
18
76
71
73
71
70
28
19
77
75
79
75
33
31
28
25
10
YEAR
83
81
65
20
20
89
88
88
86
85
80
32
30
25
25
98
94
92
89
85
Those "producer" prices are ex packaging
station, sorted and packaged
37
18
14
Sep
32
28
89
88
(Previous) 2015/16
66% upper line
66% lower line
86
36
28
24
20
15
35
Aug
90
40
33
32
26
24
46
43
41
41
39
34
31
25
43
42
44
41
Current 2016/17
Monthly 5 year MAX
5 year avg
Monthly 5 year MIN
95
47
38
53
41
40
66% lower line
100
39
30
44
40
5 year avg
51
Monthly 5 year MIN
48
47
66% upper line
35
50
45
(Previous) 2015/16
Monthly 5 year MAX
57
53
53
52
51
45
Current 2016/17
60
57
54
54
52
50
59
70
40
61
59
60
48
65
64
64
60
62
50
Apple prices in Italy (€/100kg=Euro cents/kg)
105
54
55
77
Those "producer" prices are ex packaging
station, sorted and packaged
67
67
67
65
78
72
68
66
55
(Previous) 2015/16
66% upper line
66% lower line
79
€/100 kg
Apple prices in Poland (€/100kg=Euro cents/kg)
Simple avg of 4 MSs (the 4 major producers)
80
Last update: 08.05.2017
EXPORT DIV.
Feb
Mar
Apr
May
(Previous) 2015/16
66% upper line
66% lower line
Jun
Jul
YEAR
Apple production, cider apples included (000 tonnes)
The 4 major EU producers
4 500
3 979
Italy
3 750
Poland
3 500
Germany
3 200
3%
2 305
11%
2006/17
2007/08
2008/09
2009/10
2010/11
2011/12
2012/13
2013/14
2014/15
Pink Lady
1 500 000
1 235 853
Apr
May
Jun
MONTH
AVG
000 tonnes (= million kgs)
238
227
220
198
203
203
206
185
179
189
181
183
176
169
160
100 000
171
156
132
166
152
151
144
134
114
116
101
2014/15
145
141
130
126
120
80 000
Linear (Exports)
907 438
139
140
2013/14
Imports
120
114
106
100
94
861 555
96
60 000
Linear (Imports)
903 268
86
80
79
2015/16
814 622
Mar
Apples - Extra-EU monthly exports -
180
Exports
1 100 000
687 825
Feb
153
1 172 034
930 912
Jan
200
2012/13
700 000
219 997
Dec
240
120 000
866 895
Monthly 5 year MIN
Nov
avg '12/13 to '14/15
1 519 061
364 151
+/-66% lower line
308 634
140 000
1 599 052
565 857
+/-66% upper line
5 year avg
000
tonne s
1 568 581
900 000
Monthly 5 year MAX
220
1 700 000
543 050
Previous 2015/16
200 000
Monthly extraEU imports of apples (tonnes)
1 752 962
619 833
300 000
Others
160 000
1 736 540
1 247 809
Current 2016/17
350 000
ExtraEU trade for apples (tonnes)
1 900 000
1 300 000
566 172
250 000
18%
12%
2015/16[e] 2016/17[f]
596 782
618 869
448 863
Honeycrisp
0
672 191
665 155
661 955
528 548
450 000
Golden Delicious
1 000
500
608 327
400 000
9%
1 100
612 439
691 994
670 957
500 000
Fuji
1 500
765 001
756 834
600 000
Granny Smith
29%
4%
1 850
2005/06
774 156
697 748
657 989
550 000
2 075
2 000
672 259
673 879
715 179
661 535
650 000
Gala
14%
807 843
736 663
771 028
750 000
Red Delicious
2 900
2 500
814 124
742 380
800 000
700 000
2 600
2 500
850 000
3 170
3 000
Apples - Monthly unstocking rates in the EU - tonnes
tonnes
Proportion of the main apple varieties produced
in the EU (average 2013-2015)
4 150
France
4 000
805 799
60
53
40
43
39
40 000
633 806
588 533
500 000
550 896
20 000
495 842
489 959
466 245
456 920
2015
2016(f)
Current 2016/17
Previous 2015/16
Monthly 5 year MAX
66% upper line
65
70
54
694 539
48
5 year avg
66% lower line
33
Monthly 5 year MIN
20
18
0
300 000
2005
2006
2007
2008
2009
2010
2011
2012
2013
2014
Aug
0
Sep
Oct
Nov
Dec
Jan
Feb
Mar
Apr
Apples - key balance indicators including consumption
Production
Imports
Marketing year: Aug to Jul -
14 000
12 263
12 000
11 097
10 095
10 000
Total Supply
(prod.+imports)
-Apparent Fresh
Consumption
-Apples for
Processing
-Exports
Years-->
8 000
11 598
6 778
11 275
10 351
11 395
11 008
10 275
9 206
6 925
000 tonnes
10 746
9 740
7 130
7 057
6 368
6 491
12 956
12 773
12 560
12 325
12 510
11 501
10 707
12 005
10 929
10 095
5 866
6 365
7 033
7 502
7 030
6 000
3 937
4 000
3 369
2 000
950
740
2006/07
3 327
2 430
0
Production
Imports
10 275
4 128
3 281
3 273
3 562
3 696
3 795
1 503
1 568
1 574
1 795
1 575
1 685
2010/11
2011/12
2012/13
2013/14
2014/15
2015/16[e]
2016/17[f]
9 740
10 746
10 095
10 929
12 560
12 325
12 005
2 973
1 196
1 214
1 010
2007/08
2008/09
2009/10
9 206
11 395
11 008
822
889
868
590
611
529
612
572
396
448
505
11 097
10 095
12 263
11 598
10 351
11 275
10 707
11 501
12 956
12 773
12 510
-Apparent Fresh Consumption
6 778
6 925
7 130
7 057
6 368
6 491
5 866
6 365
7 033
7 502
7 030
-Apples for Processing
3 369
2 430
3 937
3 327
2 973
3 281
3 273
3 562
4 128
3 696
3 795
950
740
1 196
1 214
1 010
1 503
1 568
1 574
1 795
1 575
1 685
Total Supply (prod.+imports)
-Exports
Sources: Eurostat, MSs notifications, DG Agri, Comext, Comtrade, GTA, ITC, AMI, Expert groups, Freshfel, Wapa….
May
Jun
Jul
Aug
Sep
Oct
Nov
Dec
Jan
Feb
Mar
Apr
May
Jun
Jul
MONTH AVG
INDEX
0. Summary overview, market update
1.
Prices
* EU prices
* MS prices for major producers
2.
Production (by variety + extreme weather events + stocks)
3.
Trade
* Evolution of the trade balance
* Import monitoring
* Export development
4.
Key balance indicators including CONSUMPTION
5.
Export diversification
2
Page
Previous
back to Dashboard
Next
0. SUMMARY OVERVIEW, MARKET UPDATE
1.
The EU average price was 8% below historical levels in April (to be compared with 6% below in March); at MS level prices were in April 22% below
average season in PL and beween 9% and 2% in the other major producers. Extreme weather events during recent weeks might have a positive effect
on prices since the crop of the next marketing year would be smaller.
2.
The seasonal pattern (slide 6) implies that prices should be increasing gradually since January; this is not happening which means that the gap
between current price and historical price has been on the rise so far. Low unstocking rates (9% lower than 5 year average during January and
February) put downwards pressure on prices; the March figure is an improvement (+6%) but still insufficient to bring stocks down to average levels.
This situation is closely related to lower levels of extra-EU exports.
3.
Apple prices in Poland, number 1 producer in volume terms in the EU, are much better than one year ago but significantly below season average.
Latest April figures for PL: the average price is 25 €/100 kg, one year ago it was 18 (= historical minimum) and the season average for April is 32.
4.
Unstocking rates during the past November and December were at record high levels; provisional figures for January and February (slide 16) show,
however, lower than average unstocking rates;
5.
New extra-EU export destinations, including most notably China and India, help to sustain prices. Some export destinations, especially in North Africa,
are receiving smaller volumes of EU apples than in preceding years.
Background
3
Page
Previous
back to Dashboard
Next
Bakground information on the market situation
1.
EU production during the current marketing year is estimated to be 3% lower than in the preceding marketing year;
2.
The Polish crop is 4% larger but, as the percentage of apples for processing moves from 60% to 40%, the supply of fresh apples
in Poland is 30% smaller this marketing year when compared to the preceding one;
3.
Poland (1st EU volume producer) has got access to the Chinese market at the end of 2016 and, together with other new
destinations, might result on more extra-EU export opportunities.
4.
Demand this winter, under low temperatures, was estimated to be firm;
5.
In conclusion, price prospects for fresh apples in a context of lower stocks during the current marketing year are better than in
the previous marketing year but lower than the season 5 year average.
4
Page
Previous
back to Dashboard
Next
1. PRICES
1.1. EU Prices
1.2. MS prices for major producers
* Poland (1st EU28 volume producer)
* Italy (2nd)
* France (3rd)
* Germany (4th)
5
Page
Previous
back to Dashboard
Next
Apple prices in the EU (€/100kg=Euro cents/kg)
€/100 kg
Simple avg of 4 MSs (the 4 major producers)
80
75
Current 2016/17
Monthly 5 year MAX
5 year avg
Monthly 5 year MIN
75
70
62
65
67
59
64
58
58
58
64
65
59
60
59
59
59
59
57
56
53
54
54
53
54
53
52
50
49
50
50
50
55
56
52
52
51
52
53
53
57
55
54
47
42
40
41
Oct
Nov
53
48
46
44
42
54
50
45
40
70
Those "producer" prices are ex packaging
station, sorted and packaged
65
52
50
79
77
61
54
54
52
65
60
60
58
67
67
65
78
72
68
66
55
(Previous) 2015/16
66% upper line
66% lower line
44
45
Jul
YEAR
43
35
Aug
Sep
Dec
Jan
Feb
Mar
Apr
May
Jun
6
Page
Previous
back to Dashboard
Next
Latest news
Apple prices €/100kg (= Euro cents/kg) and % changes – April 2017
CURRENT PRICES COMPARED TO 5 YEAR AVERAGE
April 2017,
Price, €/100 kg
April 2017, comparison to
5 year avg, base = 100 %
CURRENT PRICES COMPARED TO ONE MONTH AGO
5 year avg price,
changes from Mar to Apr, %
2016/17, changes
from Mar to Apr, %
53
92 %
+3 %
+1 %
PL-Poland
25
78 %
+7 %
-1 %
IT-Italy
65
92 %
+1 %
0%
FR-France
81
98 %
+2 %
+3 %
DE-Germany
40
91 %
+3 %
0%
EU
7
Page
Previous
back to Dashboard
Next
€/100 kg
Apple prices in Poland (€/100kg=Euro cents/kg)
54
55
50
48
45
40
Current 2016/17
(Previous) 2015/16
Monthly 5 year MAX
66% upper line
5 year avg
66% lower line
Monthly 5 year MIN
51
47
44
41
41
38
35
34
33
32
31
30
31
28
26
26
25
27
28
28
26
26
39
23
24
22
21
15
14
31
32
32
30
24
23
25
25
20
20
20
19
20
37
36
33
31
31
28
24
20
40
33
32
26
25
41
39
35
35
43
25
26
28
28
25
19
30
18
18
Apr
May
19
18
Jul
YEAR
17
15
10
Aug
Sep
Oct
Nov
Dec
Jan
Feb
Mar
Jun
8
Page
Previous
back to Dashboard
Next
Apple prices in Italy (€/100kg=Euro cents/kg)
€/100 kg
105
Current 2016/17
Monthly 5 year MAX
5 year avg
Monthly 5 year MIN
100
95
90
88
89
(Previous) 2015/16
66% upper line
66% lower line
86
86
85
80
76
77
75
76
98
92
89
85
Those "producer" prices are ex packaging
station, sorted and packaged
88
94
89
88
83
Those "producer" prices are ex packaging
station,
sorted and packaged
76
76
75
81
78
75
79
76
75
75
74
75
73
70
65
71
71
69
66
67
71
68
70
69
70
69
65
66
70
65
65
66
71
71
69
67
66
66
71
65
65
65
66
70
68
67
64
60
60
60
55
50
Aug
52
52
52
53
Sep
Oct
Nov
Dec
56
55
Feb
Mar
59
60
62
56
54
Jan
Apr
May
Jun
Jul
YEAR
9
Page
Previous
back to Dashboard
Next
€/100 kg
Apple prices in France (€/100kg=Euro cents/kg)
121
120
Current 2016/17
Monthly 5 year MAX
5 year avg
Monthly 5 year MIN
115
110
(Previous) 2015/16
66% upper line
66% lower line
114
112
107
106
105
105
103
103
99
100
99
99
101
101
Those "producer" prices are ex packaging
station, sorted and packaged
96
95
96
90
88
90
85
84
86
84
84
80
75
87
90
86
80
78
80
81
79
80
83
82
78
84
75
74
84
81
79
Aug
79
80
79
82
81
82
77
78
77
75
70
68
86
84
84
78
75
65
86
85
69
69
70
Nov
Dec
Jan
71
72
72
73
71
71
70
67
Sep
Oct
Feb
Mar
Apr
May
66
Jun
66
Jul
YEAR
10
Page
Previous
back to Dashboard
Next
Apple prices in Germany (€/100kg=Euro cents/kg)
€/100 kg
62
61
61
60
60
57
56
58
59
57
57
56
55
Those "producer" prices are ex packaging
station, sorted and packaged
51
50
49
48
48
46
45
45
47
47
41
49
50
48
48
46
40
39
43
41
39
42
40
39
44
36
37
46
44
44
42
40
42
40
39
39
38
38
35
42
41
50
47
46
44
40
60
60
38
37
32
33
33
30
31
30
29
28
25
26
25
23
20
Aug
Sep
Oct
22
Nov
Dec
Jan
Feb
30
Current 2016/17
Monthly 5 year MAX
5 year avg
Monthly 5 year MIN
Mar
Apr
May
29
(Previous) 2015/16
66% upper line
66% lower line
Jun
Jul
YEAR
11
Page
Previous
back to Dashboard
Next
2. PRODUCTION
2.1. EU production for MSs that are major producers
2.2. EU production by variety (%)
2.3. Extreme weather events
2.4. Apple stocks
12
Page
Previous
back to Dashboard
Next
Apple production, cider apples included (000 tonnes)
The 4 major EU producers
4 500
4 150
France
4 000
3 979
Italy
3 750
Poland
3 500
Germany
3 200
3 170
2 900
3 000
2 600
2 500
2 500
2 305
2 075
2 000
1 850
1 500
1 100
1 000
500
0
2005/06
2006/17
2007/08
2008/09
2009/10
2010/11
2011/12
2012/13
2013/14
2014/15
2015/16[e] 2016/17[f]
13
Page
Previous
back to Dashboard
Next
Proportion of the main apple varieties produced
in the EU (average 2013-2015)
Red Delicious
Gala
14%
3%
29%
4%
Granny Smith
Fuji
9%
Golden Delicious
Honeycrisp
11%
18%
12%
Pink Lady
Others
14
Page
Previous
back to Dashboard
Next
Further detail
Page
Previous
Next
15
back to Dashboard
16
Page
Previous
Next
back to Dashboard
Apples - Monthly unstocking rates in the EU - tonnes
tonnes
850 000
814 124
807 843
800 000
774 156
765 001
771 028
756 834
750 000
700 000
742 380
715 179
697 748
657 989
661 535
650 000
600 000
612 439
672 191
691 994
672 259
670 957
673 879
661 955
665 155
608 327
550 000
500 000
736 663
596 782
619 833
543 050
565 857
618 869
566 172
528 548
450 000
Current 2016/17
400 000
Monthly 5 year MAX
Previous 2015/16
448 863
350 000
+/-66% upper line
5 year avg
364 151
+/-66% lower line
308 634
300 000
Monthly 5 year MIN
250 000
200 000
219 997
Nov
Dec
Feb
Further detail
Page
Previous
Jan
Next
Mar
Apr
May
Jun
MONTH
AVG
17
back to Dashboard
6 000 000
5 629 630
5 500 000
Apple stocks in the EU (tonnes) the 1st day of the month
5 270 442
5 000 000
4 858 602
4 658 002
4 500 000
4 160 854
4 049 676
4 000 000
2011/12
2012/13
2013/14
2014/15
Previous 2015/16
Current 2016/17
2016/17 minus avg
5 year avg
Linear (2016/17 minus avg)
3 500 000
3 488 595
3 307 295
3 000 000
2 814 716
2 570 632
2 500 000
2 057 882
2 000 000
1 855 454
Current stocks minus 5 year
average
1 500 000
1 163 460
1 000 000
620 409
500 000
311 775
0
Nov
Dec
Jan
Feb
Mar
Apr
May
June
July
-500 000
18
Page
Previous
back to Dashboard
Next
3. TRADE
3.1. Evolution of the trade balance
3.2. Import monitoring
2.3. Export development (export diversification is under section 5)
19
Page
Previous
back to Dashboard
Next
ExtraEU trade for apples (tonnes)
1 900 000
1 736 540 1 752 962
1 700 000
1 599 052
1 568 581
1 519 061
1 500 000
1 300 000
1 247 809 1 235 853
1 172 034
Exports
1 100 000
900 000
700 000
Imports
866 895
930 912
687 825
Linear (Exports)
907 438
861 555
Linear (Imports)
903 268
814 622
805 799
694 539
633 806
588 533
500 000
550 896
495 842
489 959
466 245
456 920
2015
2016(f)
300 000
2005
2006
2007
2008
2009
2010
2011
2012
2013
2014
20
Page
Previous
Next
back to Dashboard
160 000
Monthly extraEU imports of apples (tonnes)
140 000
avg '12/13 to '14/15
120 000
2012/13
100 000
2013/14
80 000
2014/15
60 000
2015/16
40 000
20 000
0
Sep
Oct
Nov
Dec
Jan
Feb
Mar
Apr
May
Jun
Jul
Aug
21
Page
Previous
back to Dashboard
Next
000
tonnes
Apples - Extra-EU monthly exports - 000 tonnes (= million kgs)
238
240
227
220
220
198
200
203
203
206
185
180
179
189
181
183
176
169
160
171
156
166
152
153
139
140
132
145
151
144
141
134
130
126
120
114
116
101
120
114
106
100
94
96
86
80
60
79
Current 2016/17
Previous 2015/16
Monthly 5 year MAX
53
65
70
66% upper line
54
40
48
43
39
5 year avg
66% lower line
33
Monthly 5 year MIN
20
18
0
Aug
Sep
Oct
Nov
Dec
Jan
Feb
Mar
Apr
May
Jun
Jul
MONTH AVG
22
Page
Previous
back to Dashboard
Next
4. KEY BALANCE INDICATORS
including CONSUMPTION
- Production
- Imports
- Total supply (production +imports)
* Apparent fresh consumption
* Apples for processing
* Exports
- Market access (Imports/Fresh consumption)
- Fresh production exported (%)
- Apparent fresh consumption (kg/person)
23
Page
Previous
back to Dashboard
Next
Apples - key balance indicators including consumption
Marketing year: Aug to Jul - 000 tonnes
14 000
Production
12 263
12 000
Imports
11 097
10 095
10 000
Total Supply
(prod.+imports)
-Apparent Fresh
Consumption
-Apples for
Processing
11 598
10 351
11 395
11 008
10 275
8 000
6 778
9 206
6 925
10 746
9 740
7 130
7 057
6 368
6 491
11 501
10 707
12 773
12 560
12 325
12 510
12 005
10 929
10 095
5 866
6 365
7 033
7 502
7 030
6 000
3 937
3 369
4 000
3 327
2 430
-Exports
11 275
12 956
2 000
2 973
1 196
1 214
1 010
3 281
3 273
3 562
1 503
1 568
1 574
4 128
3 696
3 795
1 795
1 575
1 685
950
740
2006/07
2007/08
2008/09
2009/10
2010/11
2011/12
2012/13
2013/14
2014/15
2015/16[e]
2016/17[f]
10 275
9 206
11 395
11 008
9 740
10 746
10 095
10 929
12 560
12 325
12 005
822
889
868
590
611
529
612
572
396
448
505
Total Supply (prod.+imports)
11 097
10 095
12 263
11 598
10 351
11 275
10 707
11 501
12 956
12 773
12 510
-Apparent Fresh Consumption
6 778
6 925
7 130
7 057
6 368
6 491
5 866
6 365
7 033
7 502
7 030
-Apples for Processing
3 369
2 430
3 937
3 327
2 973
3 281
3 273
3 562
4 128
3 696
3 795
950
740
1 196
1 214
1 010
1 503
1 568
1 574
1 795
1 575
1 685
Years-->
0
Production
Imports
-Exports
Further detail
Page
Previous
Next
24
back to Dashboard
Apples - key balance indicators including consumption (+)
Marketing year: Aug to Jul - Units: % and kg per person (consumption)
17
Market Access
(Imp./Cons. %)
15.5
15
13.7
13
Exported fresh
production %
13.9
14.3
14.1
12.8
11
10.5
Apparent Fresh
Cons. Kg/person
12.9
14.3
13.9
14.8
14.0
13.8
12.8
12.6
11.6
11.0
10.4
10.4
9.6
9.2
9
14.0
12.7
12.2
12.1
14.4
9.0
8.4
8.0
8.2
7.2
7
5.6
Years-->
5
6.0
2006/07
2007/08
2008/09
2009/10
2010/11
2011/12
2012/13
2013/14
2014/15
2015/16[e]
2016/17[f]
Market Access (Imp./Cons. %)
12.1
12.8
12.2
8.4
9.6
8.2
10.4
9.0
5.6
6.0
7.2
Exported fresh production %
9.2
8.0
10.5
11.0
10.4
14.0
15.5
14.4
14.3
12.8
14.0
Apparent Fresh Cons. Kg/person
13.7
13.9
14.3
14.1
12.7
12.9
11.6
12.6
13.9
14.8
13.8
25
Page
Previous
back to Dashboard
Next
5. EXPORT DIVERSIFICATION
- Map of top world importers of apples
- Bar chart on top world importers and annual growth rates
- Key trade indicators on top world importers of apples
- Main apple traders in the world and degree of diversification
- World consumption of apples, main players
26
Page
Previous
back to Dashboard
Next
TOP WORLD IMPORTERS FROM ALL ORIGINS
Further detail
Page
Previous
27
back to Dashboard
Next
TOP WORLD APPLE IMPORTERS FROM ALL ORIGINS and % Annual growth in value 2011-15
Further detail
Page
Previous
28
back to Dashboard
Next
TOP WORLD APPLE IMPORTERS FROM ALL ORIGINS
Further detail
Page
Previous
29
back to Dashboard
Next
TOP 30 APPLE IMPORTERS AND SUPPLIERS FROM AND TO ALL ORIGINS – Value Terms
Remark:
Interesting method of
analysis, the scale is not
accurate, just indicative
<- diversified, many trade partners
concentrated, few trade partners->
Further detail
Page
Previous
30
back to Dashboard
Next
World consumption of apples 2015/16 (volume)
Main players
Iran
Russia 2%
2%
Other
15%
India
4%
Turkey
4%
United States
4%
China
58%
European
Union
11%
31
Page
Previous
back to Dashboard
Next
End
Thank you
32
Page
Previous
back to Dashboard
Next
© Copyright 2026 Paperzz