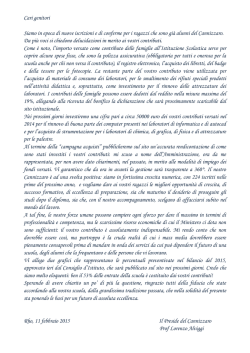
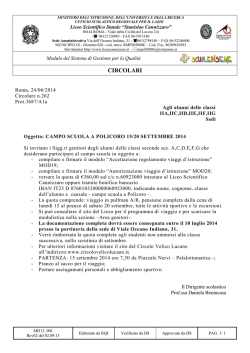
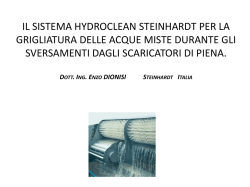
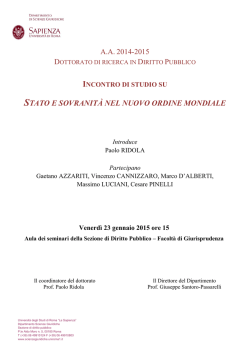
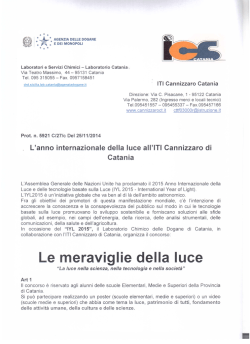
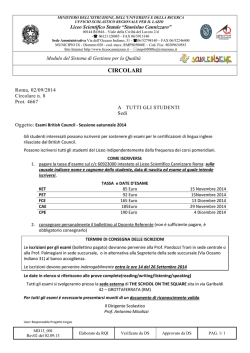
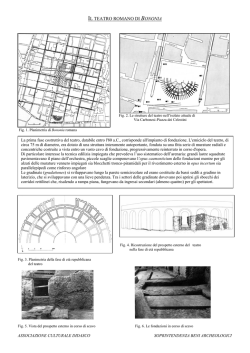
Applied Radiation and Isotopes PERGAMON Applied Radiation and Isotopes 51 (1999) 239±245 Determination of 210 Pb concentration in the air at groundlevel by gamma-ray spectrometry F. Cannizzaro, G. Greco *, M. Raneli, M.C. Spitale, E. Tomarchio Dipartimento di Ingegneria Nucleare, Universita di Palermo, Viale delle Scienze, 90128 Palermo, Italy Received 5 August 1998 Abstract 210 Pb activity concentrations in the air of Palermo were determined by g-ray spectrometric analysis of 323 particulate samples collected in the period September 1995±December 1996. For each sample, the air ®ltered through a cellulose ®lter paper was 8600 m3 on average. The values of the daily activity concentration of 210 Pb were ranging from 136 to 3390 mBq/m3. # 1999 Elsevier Science Ltd. All rights reserved. 1. Introduction Lead-210 is formed in the atmosphere by the normal process of decay of 222 Rn, which diuses as a gas from the soil. Moreover, all the 222 Rn descendants are solids and are rather rapidly adsorbed on atmospheric particulates; their removal process from the atmosphere occurs by precipitation scavenging and dry deposition. Due to its half-life of 22.3 yr, measurements of lowlevel 210 Pb have been utilized in many ®elds as dating Ð in the time scale of the past 100±150 yr Ð of sediment in seas or lakes and ice as well as study of the behaviour of aerosols in the air. In most cases, quantitative determinations of 210 Pb are performed by measuring b emission of the daughter 210 Bi (T1/2=5.01 d) or by measuring a emission of its grand-daughter 210 Po (T1/2=138.4 d). These methods are rather sensitive, but they require laborious radiochemical separation procedures and/or long waiting times for radioactive equilibrium reasons (Nevissi, 1991; Sheets and Thomson, 1992; Bou-Rabee et al., 1995; Fisenne et al., 1996). A rapid and nondestructive analysis of 210 Pb is also possible by direct measurement of 46.5 keV g-rays. It does not require preliminary chemical separations in preparing the samples but is limited by * Corresponding author. Fax: +39-091-232-215; e-mail: [email protected] the low emission probability of the g-line and the often dicult corrections for self-absorption in the sample matrix (Cutshall et al., 1983; Ishikawa et al., 1994). In this paper, we report the results of a study aimed at determining air-borne concentrations of 210 Pb at ground-level in the period September 1995±December 1996 by measuring its 46.5 keV g-line. At this end, we submitted again to g-ray spectrometry 323 atmospheric particulate samples which had been collected in such a period in the context of one of our research projects addressed usually to determine the 137 Cs and 7 Be concentrations in the air of Palermo (Agelao et al., 1984; Cannizzaro et al., 1989, 1994, 1995). Two g-ray spectrometers with HPGe detectors were nearly always utilized contemporaneously in order to complete the analysis in a shorter time. Lead-210 was identi®ed and quanti®ed in all the particulate samples examined. 2. Sampling and spectrometric measurements Particulate collection was performed by aspiration of atmospheric air through 45 45 cm So®ltra± Poelman HYN-75 (blu type) cellulose ®lter paper using a high-volume air sampler (015,000 m3 dÿ1) located on the roof of our department 20 m above ground-level (Agelao et al., 1979). The sampling time for all the particulate samples considered for this work was 14 h from 6 p.m. to 8 a.m. the next day (local time); the ®l- 0969-8043/99/$ - see front matter # 1999 Elsevier Science Ltd. All rights reserved. PII: S 0 9 6 9 - 8 0 4 3 ( 9 8 ) 0 0 1 7 7 - 8 240 F. Cannizzaro et al. / Applied Radiation and Isotopes 51 (1999) 239±245 tered air was 8600 m3 on average. After particulate sampling, the ®lters were sprayed with a suitable ®xer, cut into strips, folded and pressed into 6 6 0.7 cm packets by a 15-ton press. These samples are referred to as packet-samples. In order to detect the 46.5 keV g-line of 210 Pb, the packet-samples were analyzed by a planar HPGe detector and a coaxial HPGe detector. The planar HPGe is a LEPS (low energy photon spectrometer) ORTEC with an 16 mm active diameter and 7 mm depth, energy resolution (FWHM) of 240 eV at 5.9 keV and 530 eV at 122 keV. The detector is located in a shielding consisting of lead and iron lined with 2 cm of OFHC (oxygen-free, high-conductivity) copper plus 1 cm polyethylene; the measurement cavity is 1.6 L. The coaxial HPGe detector is a GEM-50195 ORTEC selected in the LLB series (very-low background detector). The crystal, 60% relative eciency and 1.75 keV FWHM at 1.33 MeV, has 700 mm inactive germanium and at a distance of 4 mm from the magnesium end cup. The detector is shielded by 12 cm thick lead lined with 3 cm OFHC copper and surrounded by polyethylene bricks 9 cm in thickness and plexiglas panels containing boric acid. The measurement cavity (018 L) is ¯ushed continuously with about 1.5 L/min gaseous nitrogen from the dewar to prevent radon infusion. Furthermore, the detector with its shielding is located in a room with walls and ceiling made of 75 cm thick concrete (Cannizzaro et al., 1997). Both detectors are coupled to SILENA multichannel analyzers, each equipped with spectrum stabilizer mod. 8915/P. The two spectrometric systems will be referred to as LEPS and LBS (low background system). The eciencies of the two systems for 210 Pb were determined as described below. An appropriate analysis of spectra detected by a coaxial HPGe on a packet-sample pertinent a particulate collection following the Chernobyl accident had enabled us to identify and quantify with good precision several radionuclides, including 103 Ru, 134 Cs, 136 Cs, 137 Cs emitting also low-energy g-rays as well as X-rays (Cannizzaro et al., 1990). Since several spectra had been detected on this packet-sample also by the LEPS in contact geometry, we had recourse to such a spectrum in order to deduce calibration points for evaluating the full-energy peak eciency at 46.5 keV. From the selected spectrum (Fig. 1a) we determined calibration points at the 36.4 and 37.3 keV energies of Ba X-rays, originated essentially from the 134 Cs (T1/2 =2.06 yr) and 137 Cs (T1/2=30 yr) decay, as well as at the 53.3 keV energy of the 103 Ru (T1/2=39.25 d) grays. Summing-coincidence corrections for photopeak areas were considered to be negligible. Emission probabilities adopted for X-rays were 0.139% and 0.031% Fig. 1. 33±60 keV region of g-ray spectra detected on Chernobyl packet-sample by the LEPS. (a) Spectrum taken in July 1986 (two months after particulate sampling). (b) Spectrum taken in December 1996. F. Cannizzaro et al. / Applied Radiation and Isotopes 51 (1999) 239±245 for 36.4 and 37.3 keV, respectively, from 134 Cs (Chand et al., 1988) and 1.116% and 0.273% for the same energies from 137 Cs (Metha et al., 1987); emission intensity of 0.384% was adopted for the 53.3 keV grays from 103 Ru (SchoÈtzig, 1994). Being the intrinsic eciency of HPGe-LEPS nearly constant in the 35±55 keV energy range, a linear ®t was adopted to obtain the detector eciency at 46.5 keV so the value of 0.88% was deduced. In this way self-absorption corrections were not necessary. By assuming the value of 4.26% for the 46.5 keV g-line emission probability of 210 Pb (Hino and Kawada, 1990), the absolute eciency of the LEPS for 210 Pb resulted in 3.74 10ÿ4 cps/Bq. Such a value was adopted in the context of this work as the same measurement geometry was used. Fig. 1 shows the 33±60 keV region of the spectra taken on the Chernobyl packet-sample by the LEPS in the same measurement conditions in July 1986 and December 1996. Taking into account the decays, the full agreement of the photopeak areas at 36.4 and 37.3 keV in both spectra gave further evidence of unaltered system characteristics and measurement geometry as previous periodic checks had proved too. The absolute eciency of the LBS for 210 Pb was determined using as standard a packet-sample in which the 210 Pb activity had been measured by the LEPS 241 with one-sigma counting uncertainty of 1.7%. The eciency for adopted measurement geometry resulted in 2.59 10ÿ4 cps/Bq. Fig. 2 shows the 0±200 keV region of the spectra detected on the standard packet-sample by the two systems as well as the background spectra detected on a blank packet-sample. The spectrum detected by the LEPS presents also 3 photopeaks related to internal conversion of the 210 Pb g-line; the background spectra do not highlight any photopeak. For both systems, the detection level LD expressed in terms of counts was computed by the expression proposed by Strom and Stansbury (1992) to extend that of Currie (1968) also to cases in which the background counting is carried out for a time dierent from that used for the sample counting. Using values taken from the continuum of the background spectra of Fig. 2, the LD(LEPS) values resulted equal to 26 and 79 counts for packet-sample counting times of 8 104 and 5 105 s, respectively; likewise, the LD(LBS) values resulted equal to 66 and 210 counts. Dierent counting times were used in order to obtain net countings largely higher than detection levels. Counting times of 8 104 s were usually adopted with the LEPS; generally longer times were used with the LBS. The photopeak area of 210 Pb was Fig. 2. 0±200 keV region of g-ray spectra detected on the standard packet-sample and on the blank by both the LEPS and the LBS. Counting time: 5 105 s. Fig. 3. Daily air concentration of 210 Pb in the period September 1995±December 1996. 242 F. Cannizzaro et al. / Applied Radiation and Isotopes 51 (1999) 239±245 F. Cannizzaro et al. / Applied Radiation and Isotopes 51 (1999) 239±245 243 determined by summing-up all counts in the 21.1 FWHM (46.5 keV) interval and subtracting the background contribution estimated on the basis of countings in the contiguous intervals. 3. Results and discussion Gamma-ray spectrometric analysis performed on the 323 atmospheric particulate samples collected in the period September 1995±December 1996 highlighted the presence of 210 Pb in all samples. The activity values, corrected for decay between sampling and analysis, were determined with one-sigma uncertainties ranging from 1.7 to 15% for 244 samples and to 20% at most for the rest. Daily air activity concentration of 210 Pb versus sampling-end day is shown in Fig. 3. Data are missing on days the particulate sampling was not carried out (holidays, the month of August, technical reasons). The daily concentrations present a behaviour which appears to have a oscillatory characteristic with a marked enhancement all days of the month of October 1995. The values vary from 136 to 3390 mBq/ m3, with an arithmetic and geometric mean of 980 and 791 mBq/m3, respectively. Fig. 4 shows the distribution histogram of daily concentrations together with the best ®t curve obtained by the log±normal function Fig. 5. Monthly daily averages of the air concentration of each month. 210 Fig. 4. Distribution of daily air concentrations of 210 Pb. Fit curve obtained by a log±normal function (correlation coecient = 0.993). ln x ÿ b2 y a exp ÿ : c Fig. 5 reports the monthly daily averages of 210 Pb concentrations as well as the monthly total rain; also the number of rainfall days for each month is given. Pb, and total monthly rain. The numbers give the rainfall days for 244 F. Cannizzaro et al. / Applied Radiation and Isotopes 51 (1999) 239±245 The singular 210 Pb concentration value of 2134 mBq/m3 obtained in October 1995 is about 4 higher than the value of February 1996 (minimum value). An inverse correlation seems to be between monthly averages of 210 Pb concentration and rain if the number of rainfall days are considered besides the total rain. We examined also the possible in¯uence of other meteorological conditions on the concentration behaviour of 210 Pb. Only a relationship with wind directions appeared of interest. With a windrose including eight directions, the analysis of the continuous recording of the wind direction enabled us to determine the direction predominant during the 14 h of particulate sampling. The average concentrations of 210 Pb corresponding to the eight wind directions are given in Fig. 6. Two thirds of the samplings were taken with winds west-southwest. Because of the geographical location of Palermo city, the lowest average values of concentrations correspond to the four wind directions bringing maritime air masses. 4. Conclusions Daily activity concentration of 210 Pb in the air of Palermo from September 1995 to December 1996 was lower than 1500 mBq/m3 for 83% of the determinations with an average value of 737 mBq/m3 and more than 2500 mBq/m3 for 4% of the determinations. Gamma-ray spectrometric analysis of the packetsamples for detecting 210 Pb was carried out when 7 Be Fig. 6. Average air concentration of 210 Pb versus wind direction. The numbers give the frequency of the samples. (T1/2=53.3 d, emitting 477.6 keV g-rays in 10.39% of its disintegrations) associated with atmospheric particulate was almost totally decayed. However, measurements of packet-samples performed about 10 days after the end of the particulate sampling have highlighted a background increase in the 30±100 keV energy range lower than 2 and 60% for the LEPS and the LBS, respectively, in the presence of 7 Be activity even of several tens Bq. The negligible or modest consequent increase of LD values has practically no in¯uence on quantifying 210 Pb activity also in packetsamples analyzed a few days after particulate collection. The results obtained lead us to extend the investigation into the air concentration behaviour of 210 Pb in the months following the period considered in this work as well as in previous years as particulate samples are collected since 1982. At this end, the setting up of another spectrometric system with a planar HPGe is in progress. Acknowledgements This work was supported by Ministero UniversitaÁ Ricerca Scienti®ca e Tecnologica. Meteorological data were supplied by the Osservatorio Astronomico dell'UniversitaÁ di Palermo, situated near our department. References Agelao, G., Cannizzaro, F., Greco, G., Oliveri, E., Rizzo, S., Spitale, M.C., 1979. La stazione di prelievo dell'IAIN di Palermo per misure di radioattivitaÁ atmosferica. In: Atti XXI Congresso Nazionale AIRP, Palermo, pp. 709±719. Agelao, G., Cannizzaro, F., Greco, G., Rizzo, S., Spitale, M.C., 1984. Sampling and concentration measurements of 7 Be and 137 Cs in ground-level air at Palermo. Health Physics 47, 96. Bou-Rabee, F., Bakir, Y.Y., Bem, H., 1995. Simultaneous determination of lead-210, gross beta and gross alpha activities of air ®lters by pulse shape discrimination liquid scintillation counting. Journal of Radioanalytical and Nuclear Chemistry Articles 194, 403. Cannizzaro, F., Greco, G., Raneli, M., Spitale, M.C., Tomarchio, E., 1989. Rilievi sulla radioattivitaÁ atmosferica a Palermo nel periodo aprile 1987±marzo 1989. In: Atti XXVI Congresso Nazionale AIRP, Verona, pp. 261±270. Cannizzaro, F., Greco, G., Raneli, M., Spitale, M.C., Tomarchio, E., 1990. Atmospheric radioactivity in Palermo following the Chernobyl accident: determination of gammaemitting radionuclides in the air particulate by multi-spectra analysis. Quaderni D.I.N. 4/90. Cannizzaro, F., Greco, G., Raneli, M., Spitale, M.C., Tomarchio, E., 1994. Determination of radionuclide con- F. Cannizzaro et al. / Applied Radiation and Isotopes 51 (1999) 239±245 centrations in the air of Palermo from the Chernobyl accident to December 1992. Nuclear Geophysics 8, 373. Cannizzaro, F., Greco, G., Raneli, M., Spitale, M.C., Tomarchio, E., 1995. Behaviour of 7 Be air concentration observed during a period of 13 years and comparison with Sun activity. Nuclear Geophysics 9, 597. Cannizzaro, F., Greco, G., Raneli, M., Spitale, M.C., Tomarchio, E., 1997. Study of background characteristics of a low-level HPGe spectrometer with passive shielding in various con®gurations. Nuclear Instruments and Methods in Physics Research A 390, 167. Chand, B., Goswamy, J., Metha, D., Singh, S., Garg, M.L., Singh, N., Trehan, P.N., 1988. Precision measurements of KX- and gamma-ray intensities in 103 Ru, 131 Ba, 134 Cs and 166m Ho decays. Nuclear Instruments and Methods in Physics Research A 273, 310. Currie, L.A., 1968. Limits for qualitative detection and quantitative determination. Analytical Chemistry 40, 586. Cutshall, N.H., Larsen, I.L., Olsen, C.R., 1983. Direct analysis of 210 Pb in sediment samples: self-absoption corrections. Nuclear Instruments and Methods 206, 309. Fisenne, I.M., Keller, H.W., Keller, E.W., 1996. 210 Pb in indoor air by total alpha measurement. Health Physics 71, 723. 245 Hino, Y., Kawada, Y., 1990. Measurement of the 46.5 keV gamma-ray emission probability of 210 Pb and its application as a standard for the calibration of 129 I monitors. Nuclear Instruments and Methods in Physics Research A 286, 543. Ishikawa, Y., Murakami, H., Sekine, T., Saito, T., Yoshihara, K., 1994. Nondestructive determination of low-level 210 Pb and 226 Ra with an ordinary high-purity Ge-detector. Journal of Radioanalytical and Nuclear Chemistry Articles 178, 301. Metha, D., Singh, S., Verma, H.R., Singh, N., Trehan, P.N., 1987. X- and gamma-ray intensity measurements in 137 Cs and 203 Hg decays. Nuclear Instruments and Methods in Physics Research A 254, 578. Nevissi, A.E., 1991. Measurement of lead-210, bismuth-210 and polonium-210 in environmental samples. Journal of Radioanalytical and Nuclear Chemistry Articles 148, 121. SchoÈtzig, U., 1994. Photon emission probabilities in the decay of 103 Ru/103m Rh. Applied Radiation and Isotopes 45, 641. Sheets, R.W., Thomson, C.C., 1992. Eects of Polonium-210 on determination of atmospheric gross alpha-radioactivity. Journal of Radioanalytical and Nuclear Chemistry Articles 161, 465. Strom, D.J., Stansbury, P.S., 1992. Minimum detectable activity when background is counted longer than the sample. Health Physics 63, 360.
© Copyright 2026 Paperzz