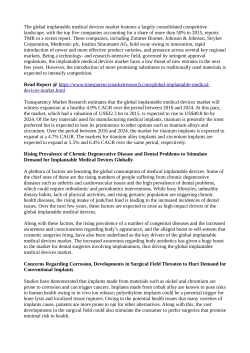
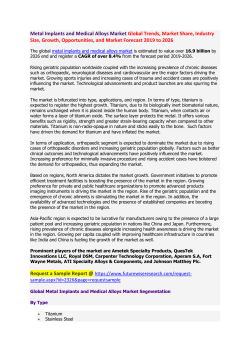
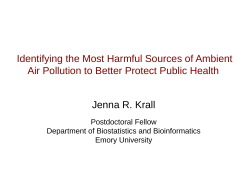
Etching Titanium with HF and Nitric Acid Solutions Part 1 Randy Markle Chemcut Chemcut has been building hydrofluoric acid etching equipment since the 1960’s. HF was first used by the glass industry to produce a non-‐glare surface on television tubes. It has now become a viable chemical for the processing of silicon, in the solar industry, and titanium and memory metals in the medical industry. Our experience has shown that HF is seldom used by itself. It is usually combined with another chemical to produce an etching or surface treatment solution. The mixture of HF and nitric acid is becoming quite prevalent. Chemcut decided to study the effects of etching titanium using this solution. Hydrofluoric acid (HF) is the primary chemical needed to etch titanium. The etching reaction is shown as: Ti + 3HF → TiF3 + 3/2H2↑ 1 Where the etching of titanium, with HF, produces titanium trifluoride and hydrogen gas. Although HF, by itself, will etch titanium, there are some disadvantages to using HF alone. First, there is the formation of hydrogen gas that is flammable and explosive. This can create a potential fire hazard. Secondly, the HF tends to dissipate quickly, requiring regular chemistry additions. Thirdly, the etch rate is relatively slow. And lastly, the resulting surface finish may be undesirable. To offset some of these disadvantages, nitric acid is added to the HF solution. This reaction is shown as: Ti + 6HF + 4HNO3 → H2TiF6 + 4NO2↑ + 4H201 Here the etching of titanium produces hexafluorotitanic acid, nitrogen dioxide, and water. With this solution, the HF tends to be more stable, the hydrogen gas is eliminated, and the etch rate increases. The purpose of this evaluation was to record the effects of different chemical concentrations on the etch rate and surface finishes when etching titanium with a hydrofluoric acid /nitric acid solution. Undercut was not evaluated at this time, because the dry film used was not compatible with the HF. It allowed the fluoride ions to penetrate the resist and which caused loss of adhesion. Undercut may be evaluated at a later date. The material used for the testing was grade 2, commercially pure titanium, 0.020” (0.508mm) and 0.035” (0.889mm) in thickness. It was purchased with a mill finish. The constituents are; titanium – 98.9% min, carbon – 0.08% max, oxygen – 0.25% max, nitrogen – 0.03% max, iron – 0.3% max, and hydrogen – 0.015% max. Its density is 0.163 lb/in3, its hardness is Rockwell B68 to B80, and its yield strength is 40,000psi min. The titanium was prepared for etching in the following manner. The titanium was sheared into 6”x 6” sheets. The sheets were then degreased, by hand, with a solvent, and soaked in a phosphoric acid based cleaner for two minutes. They were then rinsed and dried. The thickness of each sheet was measured in four places, with a micrometer, averaged and recorded. One side of each sheet was then masked from the etching solution. Two sheets were etched under each set of chemical concentrations. The masking was then removed, and the resulting thickness measured, in four locations, and averaged. The amount of removed material was then divided by the etch time to give an etch rate in microns or mils per minute. The etching solutions were prepared with hydrofluoric acid (49%, s.g. – 1.18), nitric acid (68%, s.g. – 1.41), and water, by weight percent. Additions were made during the testing to adjust and maintain acid concentrations. The etching was done in a Chemcut model 2315. The etch chamber has four spray tubes, top and bottom, running parallel to the direction of travel. The spray tubes also oscillate perpendicular to the direction of travel. Each spray tube contains four, 80° full cone nozzles rated at 2.84 l/min (0.75 gal/min) at 2.76 bar (40psi). The panels were etched using the top spray only at a pressure of 2.07 bar (30psi). The oscillation rate was 30 sweeps per minute and the etching temperature was 43.3°C (110°F). The effective length of the etching chamber is 21” (53.34cm). Following is a small chart showing the HF and nitric acid concentrations that were evaluated. HF HNO3 3% 0%, 3%, 6%, 10%, 15% 4.21% 20% 5% 0%, 3%, 6%, 10%, 15%, 20% 10% 0%, 3%, 6%, 10%, 15%, 20% This chart shows the average thickness before etching, the average thickness after etching, the average thickness (material) loss, and the calculated etch rate for the 3% HF solutions. Etching Average thickness Average thickness Average thickness Calculated Etch time Solution before etching after etching loss etch rate Minutes 507.7µ 418.6µ 89.2µ 8.92µ/min 3% HF (19.99 mils) (16.48 mils) (3.51 mils) (0.351 mils/min) 3% HF + 536.2µ 364µ 172.5µ 17.25µ/min 3% Nitric (21.11 mils) (14.33 mils) (6.79 mils) (0.68 mils/min) 3% HF + 524.3µ 313.9µ 210.3µ 21.03 µ/min 6% Nitric (20.64 mils) (12.36 mils) (8.28 mils) (0.83 mils/min) 3% HF + 535.4µ 290.3µ 245.1µ 24.51µ/min 10% Nitric (21.08 mils) (11.43 mils) (9.65 mils) (0.97 mils/min) 3% HF + 517.1µ 247.7µ 270.8µ 27.08 µ/min 15% Nitric (20.36 mils) (9.75 mils) (10.66 mils) (1.07 mils/min) 4.21% HF + 536.2µ 130.6 µ 405.9 µ 40.59 µ/min 20% Nitric (21.11 mils) (5.14 mils) (15.98 mils) (1.6 mils/min) 10 10 10 10 10 10 The etch graph. rate at each chemical concentration is also show on the following Titanium Etch Rate - 3% HF 45 40.59 Etch Rate (µ /min) 40 35 30 27.08 24.51 25 21.03 20 17.25 15 10 8.89 5 O 3 H 20 % 4. 21 % H F& 15 % F& H 3% F& H 3% N O 3 H N 10 % H N O 3 3 O N 6% H F& H 3% 3% H F& 3% H 3% N H O F 3 0 Etching Solution Following is the same information for the 5% HF and 10% HF testing. Etching Average thickness Average thickness Average thickness Calculated Etch time Solution before etching after etching loss etch rate Minutes 883.6µ 717.8µ 166.1µ 16.61µ/min 5% HF (34.79 mils) (28.26 mils) (6.54 mils) (0.654 mils/min) 10 5% HF + 887.7µ 671.6µ 216.2µ 21.62µ/min 3% Nitric (34.95 mils) (26.44 mils) (8.51 mils) (0.85 mils/min) 5% HF + 884.7µ 529.3µ 355.3µ 35.53 µ/min 6% Nitric (34.83 mils) (20.84 mils) (13.99 mils) (1.4 mils/min) 5% HF + 887.0µ 431.0µ 455.9µ 45.59µ/min 10% Nitric (34.92 mils) (16.97 mils) (17.95 mils) (1.8 mils/min) 5% HF + 887.2µ 376.2µ 511.3µ 51.13 µ/min 15% Nitric (34.93 mils) (14.81 mils) (20.13 mils) (2.01 mils/min) 5% HF + 886.2µ 620.8 µ 265.4 µ 53.1 µ/min 20% Nitric (34.89 mils) (24.44 mils) (10.45 mils) (2.09 mils/min) 10 10 10 10 5 Titanium Etch Rate - 5% HF 60 51.13 53.1 50 Etch Rate ( µ /min) 45.59 40 35.53 30 21.62 20 16.61 10 0 5%HF 5%HF&3%HNO3 5%HF&6%HNO3 5%HF&10%HNO3 5%HF&15%HNO3 5%HF&20%HNO3 Etching Solution Etching Average thickness Average thickness Average thickness Calculated Etch time Solution before etching after etching loss etch rate Minutes 890.5µ 790.5µ 100.1µ 20.0µ/min 10% HF (35.06 mils) (31.12 mils) (3.94 mils) (0.79 mils/min) 10% HF + 888.7µ 652.8µ 236.0µ 47.2µ/min 3% Nitric (34.99 mils) (25.7 mils) (9.29 mils) (1.86 mils/min) 10% HF + 886.5µ 283.7µ 603µ 120.6 µ/min 6% Nitric (34.9 mils) (11.17 mils) (23.74 mils) (4.75 mils/min) 10% HF + 886.5µ 563.1µ 323.5µ 161.75µ/min 10% Nitric (34.9 mils) (22.17 mils) (12.74 mils) (6.37 mils/min) 10% HF + 890.0µ 487.4µ 402.6µ 201.3 µ/min 15% Nitric (35.04 mils) (19.19 mils) (15.85 mils) (7.93 mils/min) 10% HF + 888.5µ 482.1 µ 406.5 µ 203.3 µ/min 20% Nitric (34.98 mils) (18.98 mils) (16.0 mils) (8.0 mils/min) 5 5 5 2 2 2 Titanium Etch Rate - 10% HF 250 201.3 203.3 Etch Rate (µ/min) 200 161.75 150 120.6 100 47.2 50 3 10 % H F& 20 % HN O 3 HN 10 % H F& 10 % 10 % H F& 15 % HN O 3 O 3 O N 6% H F& H 10 % 10 % H F& 3% H 10 % N H O F 3 20 0 Etching Solution The The following graph shows how the etch rate of each concentration compares to the others. Titanium Etch Rate (µ/min) 250 200 3% HF Etch Rate (µ/min) 5% HF 10% HF 150 100 50 4.21% HF 0 0% HNO3 3% HNO3 6% HNO3 10% HNO3 15% HNO3 20% HNO3 Percent Nitric Acid A As shown by the graph above, as the nitric acid concentration increases, so does the etch rate. With no nitric acid, the etch rates are similar at the tested HF concentrations The etch rate increase percentage begins to decline after reaching the 10% nitric acid level. The following chart and graph illustrates this point. Etch Rate Increase - Percentage %HNO3 3% HF 5% HF 10% HF 3% 93.4 30.2 136 6% 21.9 64.3 155.5 10% 16.5 28.3 34.1 15% 10.5 12.2 24.5 3.4 1 20% Percent Etch Rate Increase 400 350 Percentage Increase 300 3% HF 250 5% HF 200 10% HF 150 100 50 0 3% 6% 10% 15% 20% Nitric Acid Concentration This graph shows that the increase in etch rate begins to level off above the ten percent nitric acid concentration. This holds true for each concentration of HF. While measuring the panels after etching, it was noticed that as the chemical concentrations increased, the measurements showed more inconsistency. The standard deviations of each set of measurements were calculated and graphed to create a visual interpretation. Standard Deviation - Microns 70.0 Standard Deviation (microns) 60.0 3%HF 5%HF 50.0 10%HF 40.0 30.0 20.0 10.0 4.21% HF 0.0 0% Nitric 3% Nitric 6% Nitric 10% Nitric 15% Nitric 20% Nitric Percent Nitric Acid It can be seen, that as the nitric acid concentration increases, the etch rate increases and the surface attack becomes more erratic and uncontrollable. The second part of the evaluation was to see the how the various chemical concentrations affected the etched surface. The following photographs show a side-‐by-‐side comparison at the tested HF and nitric concentrations. 3% HF 0% Nitric 10% Nitric 15% Nitric 5% HF 0% Nitric 10% Nitric 20% Nitric 10% HF 0% Nitric 10% Nitric 20% Nitric Without the nitric acid being present, the titanium surface is very rough and nodular in appearance. As the nitric acid concentration increases, the surface roughness decreases to the point of creating a surface that is almost reflective. The following chart shows a comparison of the average roughness using the various chemical concentrations. Mill 5% HF& 5% HF& Finish HF 5% 10% HNO3 20% HNO3 (microinches) Ra 13.63 112.3 34.7 56.85 Mill 10% HF& 10% HF& Finish 10% HF 10% HNO3 20% HNO3 (microinches) Ra 13.63 120.82 35 39.54 Summary Etching titanium with hydrofluoric acid is a slow process and produces a by-‐product of hydrogen gas. It also produces a rough surface finish. The addition of nitric acid increases the etching rate, eliminates the formation of hydrogen gas, and produces a smoother surface finish. Nitric acid concentrations above ten percent did little to increase the etching rate. At the fifteen and twenty percent level, the etch rate begins to stabilize, however, it becomes more erratic and uncontrollable. Also, as the HF concentrations increased, titanium oxide formed on the material surface. This white oxide may be undesirable and is very difficult to remove. The undercut characteristics were not evaluated because the photoresist, that was used, was not compatible with the process. Recommendation To maintain a good controllable etch rate, when etching grade 2 titanium, a recommended etching solution is 3-‐5% HF with 10% nitric acid. 1 Allen D M, 1986, The Principles and Practice of Photochemical Machining and Photoetching, Pg. 97
© Copyright 2026 Paperzz