George L. Smith" and Gary A. Zartllo"
' Depa r t m e n t of G eology a n d
Geophysics
University of Wi sconsin
Madi son , Wiscon sin 53 70 6
"De pa r t .men t of Oc eanograph y
and Ocean Engineering
Fl or ida Insti tute of T echnology
M elbourne , Fl orida 329 0 1
ABSTRACT
••.,
- .
~,"II'
...
@i3J
-+ +-~_~wit'
_
SMITH, G.L. and ZARILLO, G.A., 1989 . Calcu lati ng long-term shore line recessio n rat es usin g
aerial photogr aph y and beach profiling techn iques. Jo u rna l o{ Coas ta l R esear ch . 6(1 ). 111 -12 0 .
Fort Laud erdal e (Florida ), ISSN 0 749-020 8 .
Quantifying measurem ent err or and preci sion may be th e most diffi cult ste p of sho reli ne recession rate ca lcula tions . Ca lcu la tion of long -term sho reli ne recessio n rates based on aeria l photograph ana lys is refl ect on ly th e s hore li ne positions at th e tim e of photog raphy . Conve nti ona l
met hods of lon g-t er m recessi on rate ca lcula tion we re combine d wi th beach profiling techniqu es
in order to quantify potentia l errors tha t can be produ ced by short -te rm variatio ns in s hore li ne
position . Monthly beach profiling of a typi cal n ort.he a st ern/mid-A tl a n t.ic microtidal and wav edomin ated shore li ne demon strat ed s hort-te rm s hore line pos ition cha nges of up to 20 m over a
one yea r peri od. Aver age long-t erm shore li ne recessi on rates in th is area we re 1.2 m /yr ::!:. 1.0
m/y r . S hort-te rm shore li ne posi ti on changes were th e largest sou rce of error in th e long-t erm
recessio n rate measu rem ent s . Thi s emphas izes th at phot ogra phe d sho reli nes do not necessarily
represent the seasona l mea n shore line position , parti cul arl y in locat ion s wher e s hore li nes cha racte rist ica lly ex hibit re lat ive ly large s hort-te rm var ia tions in sh ore li ne position.
ADDITIONAL INDEX WORDS: Coas ta l erosion. sho reline posit ion . su ruey m et ho ds . rat e cal culations , beac h.
INTRODUCTION
Changes in shoreline po sition have been
quantified using a variety of techniques and
data bases . Studies examining long-term shoreline dynamics have generally utilized maps and
charts (TAN E Y, 1961 ) or vertical aerial photographs (DAVIS, 1976 ; DOLAN et al., 1979 ,
1980 ; LEATHERMAN, 1979 , 1983; LEATHERMAN and ZAREMBA , 1986 ; STAFFORD ,
1971 ; STAFFORD and LANGFELDER, 1971;
WAHLS, 1973). Short-term shoreline dynamics
are typically measured using beach profiling
techniques (e .g ., BOKUNIEWICZ , 1981 ;
DEWALL , 1979; DEWALL et al., 1977 ;
MCCANN , 1981 ). Aerial photographs are most
commonly used to measure long-term shoreline
position changes which have occurred since the
advent of high-resolution, large-scale vertical
aerial photography (cir ca 1930). Aerial photographs are frequently used to quantify changes
along 10 to 100 km lengths of shoreline. In contrast , beach profiling is generally limited to
smaller (i .e., less than 10 krn ) lengths of shore88053 receiued24 A ug ust 1988. accep ted in reuision 14 March 1989 .
lin e . Beach profiling surveys are typically
repeated at regular intervals in order to meas u r e relatively short-term (daily to annu al)
variations in shoreline position and beach volum e.
Maps and charts a r e seldom used for quantitative long-term sh or eli n e position measurements because most are small scale, many are
restricted to areas adjacent to ports and shipping lanes (STAF F ORD and LANGFELDER,
1971 ), and "some are of questionable accuracy"
(DOLAN et al. , 1979 ). Historical maps and
charts are particularly subject to inaccuracies
(LE ATH E RMAN , 1983). Thus , DOLAN et at.
(1979) concluded that high-resolution measurements of changes in shoreline position are best
accomplished using either large-scale vertical
aerial photographs or beach profiling.
The accuracy and precision of aerial photographic measurements are mainly limited by
the accuracy of the photographs and base maps
u sed , and by the precision with which the photographs and base m aps can be superimposed
(DOLAN et al ., 1979, 1980; STAFFORD, 1971;
STAFFORD and LANGFELDER, 1971 ). Preci-
112
Smith and Zarillo
sion is also limited by difficulties in locating
shoreline position, typically taken as the high
water line (DOLAN et al., 1979, 1980; LEATHERMAN, 1979, 1983). Quantifying measurement error (e.g., DOLAN et ale 1980) is probably
the most difficult and critical step in any measurement of long-term shoreline position
changes. Beach profile measurements are generally subject to the limitations of conventional
surveying techniques.
A common assumption, often unstated, is that
the aerial photographs used in shoreline position studies record the seasonal mean shoreline
position and configuration. DOLAN et ale (1980)
pointed out that calculations based on aerial
photographs, in addition to being subject to a
variety of measurement errors, reflect only the
shoreline positions at the time of photography.
Beach profiling studies along the wave- and
storm-dominated shorelines of the northeastern
United States (BOKUNIEWICZ, 1981;
DEWALL, 1979; DEWALL et al., 1977;
MCCANN, 1981) have shown that shoreline
positions and beach volumes fluctuate on a variety of time scales in response to seasonal and
storm-induced variations in coastal processes.
The magnitudes of these short-term changes
may be comparable to the magnitudes of longterm changes in shoreline position measured
over time spans of decades. This suggests that
the assumption of "seasonal mean shoreline
position" used in aerial photographic analyses
may not always be valid.
Some studies have utilized post-storm aerial
photographs (LEATHERMAN, 1979; LEATHERMAN and ZAREMBA, 1986; WAHLS, 1973).
These photographs clearly do not record seasonal mean shoreline positions or configurations. Instead, this technique assumes that
post-storm shorelines typically attain a characteristic post-storm configuration. It is not
clear whether or not this approach circumvents
the problem of short-term variability; this technique will not be discussed here. Erosional
headland or seacliff-dominated coasts (e.g.,
KUHN and SHEPARD, 1984) are less affected
by short-term variability, compared to the lit-
results having well defined limits of accuracy.
This was accomplished by combining the relative magnitudes of short- and long-term variability in shoreline position along a representative stretch of coastline with the usual inherent
measurement errors of map and aerial photo
analysis, Short-term variability was quantified
in order to determine its effect on the accuracy
of long-term shoreline position measurements.
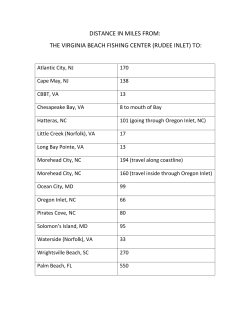
STUDY AREA
The shoreline examined in this study is a barrier beach 1.2 km in length fronting Mecox Bay
on the south shore of Long Island, New York
(Figure 1). The mean ocean tidal range in this
area is 0.9 m and the spring tidal range is 1.1
m (NATIONAL OCEANIC AND ATMOSPHERIC ADMINISTRATION, 1984). Wave climate data collected 3 km west of the study area
from January to December, 1971, indicated that
the mean wave height was approximately 0.6 m
whereas maximum height, was approximately
1.8 m (U.S. ARMY CORPS OF ENGINEERS,
unpublished data). According to HAYES
(1979), mean tidal ranges of 0.9 m and mean
wave heights of 0.6 m should produce a "microtidal wave-dominated" shoreline. The narrow,
400 m wide linear barrier beach across the seaward side of Mecox Bay and the barrier islands
west of the study area are characteristic of this
class of shoreline and are representative of
large portions of northeastern and mid-Atlantic
United States coastlines.
An ephemeral tidal inlet, Mecox Inlet, is
located in the center of the study area. This
unstabilized inlet is the only open-channel connection between the bay and the ocean -and is
typically open for periods of one to two weeks
seven times per year. The beach adj acent to the
inlet has not been modified by filling or groinbuilding. DOLAN et ale (1979) did not examine
shorelines adjacent to inlets because of concern
that the high variability of inlet-influenced
shorelines would bias long-term shoreline position measurements. Although Mecox Inlet is
AREA
I
l
N
o~~~....
3.okm
MECOX BAY
1
N
1
0,
Figure 1.
0.5
,
!km
(Top). Locati on of st u dy a rea on Lon g Isl a nd . (Bottom ). Section of ba r r ie r bea ch shore li ne exa mined during this st udy .
changes in beach volume and shoreline position
in the study area.
LEATHERMAN (1979, 198 3), COOKE (1985),
and LEATHERMAN and ZAREMBA (1986).
Long-Term Measurements
METHODS
Long- and short-term changes in shoreline
position were measured on a 1.2 km length of
barrier beach fronting Mecox Ba y using aerial
photographic and beach profiling techniques .
Short-term s h or e l i n e position change s were
measured over 13 months using the EMERY
(1961) method of beach profiling . Short-term
data quantified the potential effects of sea son a l
variability and storm-induced changes on the
precision of long-term shor eli n e position measurements. Long-term changes in shoreline
position were measured between 1938 and 1984
using a variation of conventional a eri al photographic techniques described in STAFFORD
(1971), STAFFORD and LANGFELDER (1971 ),
WAHLS (1973), DOLAN et at. (1979,1980 ),
Lon g-term shoreline position changes were
mea sured from vertical aerial photographs
taken on June 30 , 1938, and March 24 , 1984.
First a 1:2400 scale Suffolk County, New York,
topographic map was chosen as a base map and
field checked for accu racy . The map's accuracy
was determined by surveying ground distances
between five pairs of reference points within the
study area and appearing in the 1938 and 1984
photographs. Reference points consisted of the
corners of clearly identifiable structures, roaddriveway intersections, and the point at which
a road ended . The base map was determined to
be more accurate than the precision with which
measurements could be made on the map ( :!: 1
m ). A mylar copy of the ba se map was used
J ou rn al of Coasta l Researc h, Vol. 6, No.1 , 1990
114
Sm ith a nd Zarillo
throu ghou t the study in or der to elimi nate error
introdu ced by stretc hi ng or sh r in kage.
Next , the aerial pho t ogr aphs we re projected
on to the base m ap u sing a Bausch a n d Lomb
Z oom Tran sfer Scope a nd or ie nted a nd en la rged
in or de r to ma tch r eferenc e point s . This procedure rectified sca le di fferences between the tw o
photographs du e to cam era alti tud e a n d t ilt
(STAFF ORD and LANGFELDER, 1971 ). Each
project ion was positioned t o :=: 1 m by this process .
On vertical aerial photographs , scale varies
radically outw ard from th e center (pr i m a r y
point) of the photograph. In addition , sca le varies in re spon se to topo graphic relief. These
s ca le va r ia t ions a re inherent features of the
ph oto graph. Th ey a ffe ct th e a cc u r a cy of th e
photograph since they make high-relief refere nce points (z.e., hou ses on dunes ) a ppe a r t o
s h ift radiall y outw ard . Radial d isplac ement
effects and sca le vari a ti on s could not be corr ect ed but were min imized by ch oosing ph oto gra phs whi ch centere d t he stu dy a rea . Th e ma ximum e rror du e to r ad ial di s t or t ion s was
esti mat ed at :=: 3 m at hi gh- el eva t ion reference
point s (houses on dune tops ) at the ends of the
study a rea . Th is estimate was ba sed on ca lcula tio ns of r a dia l d ispl a cem ent us ing an
assu me d a ircra ft el ev a t ion a nd known gr ou nd
di st ances a nd elevati ons .
Th e wa ter and hi gh water lines of the projected ph otographs were t ra ce d on t o the ba se
map . The high water line (HW L) is a comm onl y
u sed shoreline indicator a nd appears as a t onal
cha n ge on the beach face du e to differences in
water content of the sand. The HWL migrates
from 1 to 2 m horizontally (DOLAN et al ., 1980 )
as a function of bea ch s lope, wave h eight, and
tid al range (EVERTS a n d WILSON , 19 81) .
DOLAN et al . (198 0) con s id ered a 2 m migration
t ypical for medium sa n d bea ch es ha ving slopes
of 3 t o 6 degree s. Intertidal beach slopes in the
s t u d y a re a were t ypi call y 5. 5 degr ees . Thi s
s t u dy a ss u med t hat the pos iti on s of the t wo
h igh wa te r lines (1938 and 1984) were ea ch subject t o a n uncert a in ty of :=: 2 m .
The HWL wa s not vis ible in the 19 38 ph oto-
line was substituted for t he HWL . Accord in g to
unpubli sh ed U.S . COAST AND GEODETI C
SURVEY da ta (1938b), t ida l elevati ons mea sured on t he da y of t he ph otograph exceede d predict ed elevations by ab ou t 30 percen t , altho ugh
predicted ti da l ra nges we re s im ilar on t he dates
of t he 1938 a nd 1984 photographs (U .S. COAST
AND
GEODETI C
SURVEY ,
1938a ;
NATIONAL OCEANIC AND ATMO SPHERIC
ADMINISTRATION , 1984 ). Thi s would ha ve
di spl ac ed the water line (see n in the 1938 photo graph) landward beyond the mean HWL. This
combination of circumstances reduced the distance between the 1938 and 1984 s hor eli n es,
eliminating a ny artificial infl ation of shor eli ne
recession values .
The position of each trac ed HWL wa s measured a long shore -nor mal transect s to :=: 1 m relative to a n a r bi t ra ry baseline. The transect s
we re s paced a t a ppr oxi ma te ly 50 m intervals
a long the 1.2 km section of beach bounded by
sho r t -te r m beach profile lines (F igur e 2).
Lon g-term sho r eli ne posi ti on s we re measured
to :=: 12 m. Thi s value for tota l erro r r efle ct s
errors d ue to inheren t ina ccu racies of t he base
map a nd pho to graphs, t he na tural va ria bility of
HWL position, a nd mea surement error . Th ese
er ro rs were liste d in Table 1.
Short-Term Shoreline Position Changes
Sho r t -ter m va r ia bil ity in shore li ne position
wa s qu antified using 13 se ts of monthly beach
profil e m ea surements. Tw elv e benchmark s
were es tablishe d at a pproxima tely 100 m interval s a lo n g the 1.2 km s ect ion of s h or e li n e
within the st udy area (F ig ur e 3). These beach
pr ofiles were measured a t a pproxi ma te ly spr ing
lo w wa te r from March 198 5 t o March 1986
using t he EMERY (196 1) method of beach profilin g. Emery es ti ma te d that this method was
ac curate wi thin the va r ia t ion s in beach profile
du e to sma ll -scale fea tures. Durin g t h is study
elevations we re mea sured to the ne arest centimeter a nd horiz ontal di stances to the n earest 2
em. Rep ea t sur vey s indicated t h at t h is method
t
N
'------'
100m
Figure 2. Locat ion s of sho re -nor ma l transects use d to mea sure lon g-term cha nge s in s ho re li ne posit ion . Th e 1938 a nd 1984 s horelin e positi ons are als o shown.
Tabl e 1. E rrors in m eas urem en ts of long -ter m cha nges in
shorel ine position .
So u rce *
(Expla na t ion )
Value ( + / -
rn )
Base map a ccura cy (inhe rent feature
of map )
Overl ay of pr oj ect ed ph otos (h u ma n er ro r )
1938 pho tograp h
1984 ph otogr aph
Radi al distortion (in herent fea t u re
of ph otos )
3
HWL positi on (na t u ra l variab ility )
1938 HW L
1984 HWL
2
2
Sho re line pos it ion mea surement (hu ma n e rror)
1938 s hore li ne
1984 s hore li ne
TOTAL ERROR
12
*Note : Th is is t he order prese nted in the t ext.
SHORELINE POSITION CHANGES
Short-Term
Sho r t -ter m bea ch profil e mea surem en t s indi-
cated t hat the s hor e line positio n , ave raged ove r
the length of the study a rea , migra t ed ac ross a
20 m wi de swa t h of s ho reface durin g t he 13mon th study (F igu re 4 ). F igure 4 s hows ave rage
s ho re li ne posi t ion for each mon th , me a sured
fr om t he dune scar p to HWL , as "beach width ."
Th e average cu m ulative bea ch volu me for t he
study a rea is sho wn for referen ce on t he bot t om
of Fi gure 4. Th e 20 m range in sho re line positi on does not r efl ect t he e ffe cts of Hurricane
Gl ori a, wh ich wa s r ega rd ed as a n unusual event
within the time fr ame of thi s 13-month st u dy .
Two m in im a in b e a ch w idth oc curred in
November 1985 a nd March 1986 . Ob servations
s u ggeste d that be a ch width minima occurred
a fter periods of in cr ea sed wa ve a ctivity . Beach
widths r em ained fairl y con stan t (44 t o 48 m )
throu gh out most of t he s t u dy, flu ctu a ting
within a 20 m r ange. Other studies (e.g ., BOKUNIEWI CZ, 1981 ; MCCANN , 1981 ) h av e measur ed seasonal varia ti on s in beach wi dt h . Durin g this study bea ch vol umes a ppe a re d to va r y
seaso nally whe reas widths remained r elativel y
consta nt, with t he exce ption of cha nges produ ced by Hu rricane Gloria (F igure 4).
J ourna l of Coas ta l Resea r ch. Vol. 6. No. I , 1990
116
Smit h a nd Zarillo
,",otl\;\\-'\
t
N
I
\ y\\-'\
,.,0""
100 m
Figure 3. Location s of th e 12 bea ch profile lin es used during t he 13-m on th s t udy of bea ch wid th s and volumes .
60 I
~
~~
4°1
~ ~
_ . ~ -- \
T
20m
..
E
. , 20f
....- L:
,,
1/ \\
0::1
-
-.1
~ o
>
0,
,
/
..
/
-,
'/
-20
I
,
,
,
!
4
2
°
I
I
6
10
8
12
MONTHS
Fi gure 4. Beach widths a nd volum es av erag ed over th e 1.2 km st udy a rea , from March 198 5 to March 198 6. Widths are sho wn
by th e solid lin e, volumes by th e da sh ed lin e. Arrow indica tes land fall of Hurri can e Glori a (Septe mber 27. 1985 ).
Lo ng-Term
An important source of er r or in the long-term
shoreline change m easurements is apparent
from the observation that s hort -t er m shoreline
positions migrated across a 20 m swath of shor-
t erm position change calculations would be subject to a total error of ± 52 m.
Long-term changes in sh oreline position consis ted exclusi vel y of sh oreline recession . Recess ion di stances averaged 53 ± 52 m over the
entire study area and ranged from 35 m in the
3
39
4
37
0.8
0 .8
5
54
1.2
6
7
8
9
10
52
43
1.1
1.1
0 .8
0 .8
0.9
48
1.0
52
1.1
51
39
37
11
12
Inl et position
13
14
15
62
63
71
1.6
16
17
18
19
65
1.4
55
54
55
57
1.2
1.2
1.2
1.2
64
1.4
20
21
22
1.4
1.4
65
63
23
24
25
1.4
54
59
1.4
1.2
1.3
26
62
1.4
27
56
1.2
*Note : Sh orelin e recession distan ce measurem en t s a re s ubj ect t o a max imu m un certa inty of + 1- 52 m .
**Not e: Recess ion rates a re subje ct t o a n un certa inty of +1 - 1.1 m /yr.
area . Th ese re sults indicate that there was little or no s ign ifica n t ch ange ov er much of the
st udy area. Th is apparent lack of si gnifi cant
long-term change is du e to a consideration of
the effects of sh or t -term variability on the ac curac y of long-t erm m easurem ents of shoreline
position change .
DISCUSSION
The a ve r a ge shor eline recess ion rate ca lculated in this st udy 0 ,2 ::!:: 1.1 m/yr ) is comparable to the 1.5 m/yr r ecession rate cal culated
by TANEY (961) for the shor e line in the vici n it y of Mecox Bay between 1933 and 1956. Taney
determin ed that shor e li ne recession rates in the
Mecox Bay area varied from 0.6 m lyr between
1838 and 19 33 t o 1. 5 m/yr betwe en 19 33 a n d
1956 . In a ddit ion , Taney sh owed that sho re li ne
positi on s i n th e vicinity of Mecox Bay (a n d
a long the south shor e of Long Isl and in ge n er a l)
vary on a time sca le of decades. The accuracy of
the nautical m aps and charts that Taney used
for the older t im e inter val is uncertain . Therefor e , the 0.6 m/yr reces sion rat e he calculated
may be less accurate than the more recent va lu e
of 1.5 m/yr. However, eve n if Taney 's values are
cons ide re d complet el y a ccu ra te , short -term
va r ia tio ns in sho r e line po siti on could eas i ly
acc oun t for all of the differ ences b etween
Taney's sh ore li n e r ecession rates a n d the rates
calculated durin g this study .
Long-term s ho r e li n e r ecessi on rates ca lcu lated a long the mid-Atl antic coa st (us ing ae r ial
photographs) t ypically a ve r age about 1.5 m/yr
(DOLAN et ai ., 1979 ; WAHLS , 1973 ) whereas
r ec es si on rates on Ca pe Cod , Massachusetts ,
a r e fr equ entl y 0.5 to 1. 5 m/yr , depending on
J ournal of Coas t al Research, Vol. 6, No.1 , 1990
118
Smith and Zarillo
l oca ti on (LE AT H E RMA N a n d ZARE MB A ,
1986 ). Ana lyzing a va r iety of pu bli shed and
u npubli sh ed data , MAY (1 983) ca lc u late d
recessi on rates of 1.5 m /yr for barrier islands
(Ne w York to North Ca roli na) and 1.3 m /y r for
"sand bea ch es" (Ma ssa ch u set t s to New J ers ey).
These r ecessi on rates a re s im ilar t o t he rates
ca lc ulated for t he sho reline adjace nt to Mecox
Ba y . Again, sho rt-ter m va r iatio ns in sho re li ne
posit ion cou ld easily account for t he differen ces
between r eces si on r ates in these differen t locati on s.
Lon g-t erm r ec es s ion r a t e s ca lc u l a te d fo r
m an y n orth e a st a n d m id -A tl ant ic Un ited
Sta tes coastlines a re re ma r ka bly consiste nt in
li ght of th e r a ther large sho r t- te r m va r iat ions
in s ho re li n e posi ti on m e a sured durin g th is
s t u dy. Ass u mi ng t hat t he sim ilar lon g-t e rm
r e ce s s ion r ate va l ues are correct, a pos sibl e
ex planatio n for t his consiste ncy is t hat conve n tio na l lon g-t e rm s hore li ne pos it ion m e asureme nt s generally ut ili ze ph ot ographs that reflect
seasona l mea n sho reline posi t ions . Howe ver, in
one of t he few pa pers t hat q uantifies t he errors
involve d in lo ng-term shoreline position change
m ea suremen t s , DOLA N et al . (1980 ) s uggested
t hat 1.2 to 16 .4 m /yr variations in lo ng-term
e rosio n rates we re l a r ge r t ha n year -to-year
cha nges in beach systems . This study suggests
t hat t his variability may be pa r tl y du e t o
unq u an t ified short-term fluct uations in sho relin e positio n .
It may be poss ibl e to use aeria l ph ot ographs
in or de r t o reduce the uncer t ain ty pr odu ced by
s hort-ter m va r iabil it y in shore li ne position . A
s eries of photogr aphs bra ck etin g the date (a n d
ph ot ograph ) of interest cou ld be used to qu ali tat iv el y ass ess t he m a gn itud e of s ho r t -te r m
s ho re l ine po s iti on varia bi lity . Alt ho ug h thi s
t e chniqu e would r el y on a series of r andom
"s na ps hots" of t he s horeli ne in q uestio n, i t
co u l d b e u s ed t o q ua l itative ly a ns we r so me
qu e s t i on s abo ut t he relative importance of
sho rt-te r m variability .
CONCLUSIONS
meas u red . Be cau s e of t his va ria bility, t he
ass u mption that the map ped shoreline r eflects
"seaso na l mea n s ho reli ne pos i t i on " m ust be
used with caution. In a ddition, since recessio n
rates of t he magnitudes ca lcu lated in t his and
other studies are smaller t han many month-tomonth variatio ns in s hore li ne pos iti on , lon gterm recession r a tes cannot be mea sured us ing
mon thl y be a ch profile me a sur em ents even if
conti n ue d for severa l years.
T his st udy combined con vention al methods of
ae r ia l ph ot ographi c s hore l i ne m app in g a nd
bea ch profili ng in order to qu antify errors du e
to s ho r t- ter m varia t io ns in sho re li ne pos ition .
Th e r esults of thi s study s uggest th a t sho rtterm cha nges in sho re li ne pos ition may be the
si ngle largest so u r ce of er ror in q ua ntita tive
ca lc u latio ns of lon g -t er m s hore li ne pos ition
cha nge . P r e vi ou s cal cul a t ion s of lon g-t erm
recessio n ra tes may be su bject to large er rors
du e t o unqu an ti fied s ho rt-ter m va riatio ns in
shoreline position .
Anothe r concl usio n of t his study is t hat a long
interva l between aeria l ph ot o sets is req ui re d to
establish a significa nt net change in shoreline
pos ition t hat is greater t han short-term variability. Examination of Table 2 shows that in t he
present study area net recessio n over a 46-year
period only slightly exceeds, on the ave rage ,
uncer ta in t y du e to t he comb ina t ion of measu reme nt error and sho rt-term variability in beach
wi dth .
LITERATURE CITED
BO KUNI E WIC Z, H .J. , 198 1. The seaso na l bea ch a t
East Ham pt on , Ne w York . S ho re and Beach , 49(3 ),
28-33 .
COO KE , T., 1985. A se dime n t budget for Stony Broo k
Ha r bor based on aer ial photogra phic tec h niq ues.
un pu b . M.S . th es is, M.S .R .C .: S .U .N .Y. at Stony
Brook , Sto ny Brook, NY 123p.
DAVIS, R.A., J r ., 1976. Coastal changes, eastern La ke
Mic higan , 1970- 73 . U .S . Army Corps of Engi ne ers ,
T echnical Paper No . 76-16, 64p.
DEWALL, A.E ., 1979. Beach changes at Westhampton Beach , New York, 196 2 to 1973 . U.S. Army
Corps of Engi neers , Coastal Engin eering Research
Center, Mi scellan eous R eport No . 70 -5, 129p .
93.
EVERTS, C.H ., a nd WIL SON, D.C., 198 1. Base map
a na ly sis of coa stal cha n ges u s in g ae r ia l photogr aph s . U .S . Arm y Co r ps of En gin e ers , Coas ta l
En gineerin g Research Ce n t er , T ech n ical Paper 8 14, 14p.
HAYES , M.O. , 1979. Barrier is land morp hology as a
fu nct ion oftida l a nd wave regim e . In: Leath erman ,
S.P ., (e d.) Barrier Isl ands . New York : Acad em ic, pp .
1-27.
KUHN , G.G . and SHEPARD , F .P ., 19 84 . Sea cliffs ,
beaches , a nd coastal valleys of San Dieg o Cou n ty .
Berk el ey: Un iv er s ity of Calif. Press, 193p .
LEATHERMAN , S.P ., 1979 . Migrati on of Assateagu e
Isl and , Maryland, by inl et and overw ash proc esses.
Geology , 7, 104-107 .
LEATHERMAN, S .P ., 1983. Shorelin e mapping: A
comp ari son of t echn iqu es . Shore and B each , 51 , 2833.
LEA THERMAN , S .P ., a nd ZAREMBA, R.E. , 19 86 .
Dyn am ics of a northern barrier bea ch : Nau set Sp it ,
Ca pe Co d, Ma ss a chu setts . Geol og ical So ciety of
America B ulletin , 97, 116-124.
MAY , S .K .; DOL AN , R., and HAYDE N , B.P ., 198 3.
Er os ion of U.S . Sho re li nes. E os , 64, 52 1-522.
MCCAN N , D.P ., 19 8 1. Beach cha ng es a t At la nti c
SMITH G.L . a nd ZARI LL O, G.A., 1988 . Sh or t -t erm
inte ractio ns betwee n h ydrau lics a nd morph od yna mi cs of a s ma ll t id al inlet, Lon g Island, New Yor k .
J ournal Coastal R esearch , 4, 30 1-3 14.
STAFFORD , D.B ., 197 1. An a er ia l ph ot ograph ic t echniqu e for bea ch erosio n su rveys in North Ca ro li na ,
U. S . Army Cor ps of En gin eer s, Coa s ta l En gin eerin g
Research Ce nt e r .. T ech nical Memorandum No . 36 ,
115p .
STAFFORD, D.B. a nd LAN GFELDER, J ., 1971. Air
photo s u rv ey of coa stal e r os ion . Photogramm etric
Engineering , 37 , 565-575 .
TANEY , N .C ., 1961. Geomorphology of th e s ou t h
shore of Long Isl and , New York . U.S . Army corps of
Engineer s, Beach Er osion Board T echnical Mem oir s
N o. 128, 49p.
U .S. COAST AND GEODETI C SURVEY, 1938a . Tide
Tables 1938 . U.S . Dep artm ent of Comm erc e , 107p.
U .S . COAST AND GEODETI C SURVEY , 19 3 8b .
Tid es: Hourly hei gh ts a t Sa ndy Hook , New J ers ey ,
2 5 Jun e to 1 Jul y 19 3 8 . u npubl ish ed data , U .S .
Dep a rtm en t of Comme rce, l p.
WAHLS , H. E ., 19 73 . A s u r vey of No r t h Ca ro li na
beach e r os io n by air p hoto me th od s . Ce n te r for
Coastal Mar ine Studies R eport No . 73-1 . Nor th Ca roli na State Univ ersi ty , Ral ei gh , NC, 3 1p.
o
ZUSAMMENFASS UNG 0
Die Qu nnt ifizierun g von Me Ofehle rn und di e Pr iizison der Messung si nd wahr sch einl ich die sc hwierigsten Faktor en be i der Ber ech nun g der Kusten r uck ver la gerungsgesch windigkeit. Die Berech nun gen von Ku sten verlager u ngen ube r liin gere Zei triium e , die a u f
Luftb ild aufna hm en ba s iern , spiege lt nu r die La gezustiinde der Kust en l in ien zur Zeit der je we ilig e n Aufna hme n wider . In Erganzun g zu den konvent ionelle n Methoden zu r Berechnung der Ku s te nver la geru ng werden morph ometrische Kar ten des St ra ndes
ange fe rt igt urn die moglich en Fehler , die d ur ch k urz fr isti ge Schwan kun gen der Ku ste n linie ent ste he n konnen , zu qu antifizieren .
Mon atl ich e mor phomet ri sch e Aufna hm e n e iner ty pische n no rdos t-/mit telatla ntisc he n . mi kr oti dal en und du rch Well en ge pra gtcn
Kustenlirrie zeig te , da O ku rzzeitige Schwankungen der Kusten lin ie von bis zu 20 m in eine m J ah r a uft re te n konn en , Die du rch schn ittli che La ngz ei t- Kustenve r la gerungs rate betra gt in diesem Gebiet 1,2m/a '" 1.0 m/yr. Die ku rzfri sti gen Schwa n ku ng en s te llen die haup tsachl iche Fehl er qu ell e bei den Messungen der La ngzeit -Kustenver lag erung da r. Dies wei st ver stiirk t da rauf hin ,
daO Luftbild au fn ahmen von Ku st enli ni en ni cht notw endi gerwe ise die jahreszeitliche durchschnittliche Posit ion der Ku st enlini e
repr iisenti er en , ins bes onde re a n Lok alitiit en , wo der Verl auf der Ku st enl in ie verg leichs weise groflon Kurzze it -Schw ankungen
unterworfen ist. - Ulr ich R adtke, Geog raphisches l n stitu t , Un iuersi tat Du sseldorf , FR .G.
o
RES UME 0
L'et ap e la plu s difficil e iJ. fr an chir pour es t imer Ie recul du ri va ge est de qua ntifier los er re u rs de mesure et leur pr ecisi on . Les
ca lculs de taux de r ecu l du rivage a long term e r eposent su r I'an al yse de ph otogr aph ies ae r ien nes q ui donn en t Ie positi on du ri va ge
insta nta ne au momen t de la prise de vu e. Les methodes conv entionne lle s d'est ima ti on de recu l iJ. long ter me ont ete cornbinees iJ.
un profilage des plages pO U T pouvoir quanti fier les erre urs qu i peu vcnt et re gener ces par les variations a court te rme de la pos iti on
du riva ge . Le profil age men s ue l d'un e plage ty pique du NW de I'Atlantique moye n de ty pe microt idal et dorni ne par les houl es
presente u ne vatia tio n atte igna nt 20 m su r un a n . Les ta ux moyens de rec ul da ns cet te zone sont de 1.2 m /an '" 1. Ce sont les
chan gement s iJ. court te rme qui sont les sou rces les plu s impor tantes d'err eu rs du calcu l des ta u x de rec u l a lon g terme . Cec i
souli gne Ie fa it que les ph otogr ap h ies de ri va ges ne rep resen tent pa s for cernent la posit ion moyenne sa iso nn iere du r ivage , s ur tout
1iJ. ou d'i mp or t antes va riation s il court term e so nt enregis t rees. -Cathe ri ne Bressolier , Lobo. Geom orphologie E .P .H .E ., Montr oug e,
France.
o
RESUME N 0
La cua ntifi cac i6n del er ro r y la pr ecis i6n de medid a pu ede se r la eta pa ma s dificil en los ca lculos de la ve locida d de reces i6n de la
linea de costa . Los calc ulos de la s ve locida des de reces i6n a la rgo pl azo, basad os en la fotogr afia ae rea , reflej a n s610 la s pos ici on es
de la linea en el instante de la fotog rafi a . Los met odos conve nciona les de calculo de la reces ion a lar go plazo se combi na n con
tecnica s de perfil de play a s para cu a nt ifica r los e rro res poten cial es q ue pu eden pr oduc ir se por la s variaciones a corto plazo en la
posici6n de la lin ea de cost a .
J ou rn a l of Coasta l Resear ch, Vol. 6. No. 1, 1990
120
Smit h a nd Za r ill o
El perfi lado mensua l de un a li nea de cost a tipica microm a real y dominad a por el oleaje en el Nor deste Atlanti co demu est r a que
las var iac iones a corto plazo e n la pos ici on de In line a de cost a pued en se r de hast a 20 m en e l per iod o de un a na. La vel ocidad
medi a de r ecesion a la r go pla zo con ese a re a es de 1.2 m/an o j: 1.0 m/an o, Los cam bios de posi cion de la lin ea de costa a corto
pla za fuero n las mayor es fu en tes de error en la s medida s de la velocida d de recesion a largo pla za. Est a rem ar ca qu e las lin eas de
cos ta fot ogr a fiad a s no r eprese nt an necesa r iam ente su pos icio n medi a estacioria l, es pecia lmente en aque llos lu ga res dond e la lin ea
de costa presenta va r ia cion es a corto pl a zo relati va mente imp ort ant es.-Department of Water Sci ences, University of Cantab ria,
Santa nder, S pain .
© Copyright 2026 Paperzz