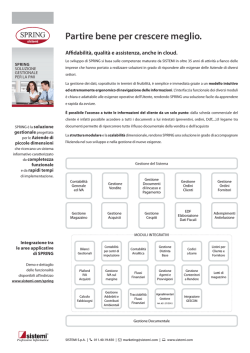
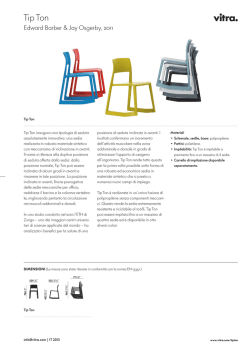
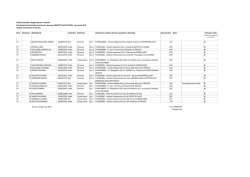
An Application of Atomic Force Microscopy to Measure the Spring Constant
of Single Antigen-antibody Complex
L. A. Chtcheglova*, G. T. Shubeita, S. K. Sekatskii and G. Dietler
*Institut de Physique de la Matière Condensée, University of Lausanne,
CH-1015 Lausanne, Switzerland
e-mail address corresponding author: [email protected]
fax: +41 (0)21 692 3635
Aim of our study is to use Atomic Force Microscopy (AFM) to measure the spring constant for
single bovine serum albumin (BSA) – polyclonal antibody to BSA (Ab-BSA) complex (kcomplex)
as a function of pulling off force and complex extension. By the combination of AFM operated in
the force-spectroscopy mode with the small dithering of the AFM tip we are able to detect the
change of the dithering amplitude upon the pulling off process and to derive the value of kcomplex.
At the moment of single specific bond rupture the spring constant value of 0.017 ± 0.003 N/m is
determined.
1. Introduction
Over the last decade, the AFM has been widely extended to measure interaction forces at
the molecular level (Force Spectroscopy) [1]. By biological functionalization of tip and sample it
becomes possible to investigate molecular forces, like forces between a receptor and a ligand
including antigen-antibody (Ag-Ab) interactions [2].
Recently, Schindler et al. [3] proposed to use in addition a small modulation of the tipsample distance at a selected optimal driving frequency ω. Recording the amplitude of the tip
vibrations at this driving frequency leaded to an improved molecular recognition fidelity. This
method opens also the possibility to measure the dynamical properties of single molecules. Here
we developed this approach for the measurement of the spring constant of a stretched BSA – AbBSA complex. A complete study of specific unbinding forces between BSA and poly- and two
monoclonal antibodies to BSA were earlier accomplished in our laboratory.
2. Materials and Methods
Standard Si3N4 cantilevers with a nominal spring constant of 0.06 N/m (Digital
Instruments (DI), Santa Barbara, CA) and with range of resonant frequency in liquid from 8.5 to
10 kHz were functionalized with polyclonal rabbit anti-bovine serum albumin antibody (AbBSA). Before biological functionalizion of substrates (mica) with BSA molecules chemical
coating of mica was done by silanization using 3-aminopropyltriethoxysilane (APTES). BSA and
antibodies were purched from Sigma and used without further purification. All experiments were
performed in a phosphate buffer solution (PBS) (50 mM, 150 mM NaCl, pH 7.4).
Experimental setup is presented in self-exploratory Fig. 1. A commercial scanning probe
microscope (Nanoscope IIIa; DI) operated in “force-volume” mode was used. A small sine wave
modulation voltage Umod with a peak-to-peak amplitude of 20-80 mV at frequency of ω=2π*3.2
kHz was additionally applied on the piezocrystal (normally used in tapping mode option). This
modulation was equivalent to application of a driving force Fω onto the cantilever, and caused a
tip dithering with the amplitude of 0.5-2 nm. This resulted in the modulation of the photodiode
current at the same frequency ω. The signal from the photodiode was measured by a SR750
digital lock in amplifier. Therefore, force-distance cycles and amplitude-distance cycles were
recorded simultaneously. We have not detected a dependence of the results on the dithering
amplitude. The smallest reasonable loading rate value of 0.7 nN/s was used.
3. Results and Discussion
Fig. 2A shows our typical experimental data. The recording of the data starts when the tip
and sample are in the non-contact region (interval A-B). When the tip is in contact with the
surface (B-C approaching, C-D retracting), the cantilever deflection is a linear function of the
displacement of the sample.
84
Figure 1. The experimental setup.
In point D, the tip loses the contact from the sample. Interval D-E represents further retraction of
the tip from the surface and finally point E corresponds to the breaking of bonds (unbinding
force) between functional groups of the tip and surface.
Below we estimate a value of the spring constant of a tip-sample complex kcomplex basing
on the following considerations. In liquids, for small amplitudes of vibrations a process of
excitation of tip vibrations can be described as forced vibrations of a nonlinear oscillator [4]. Let
δz be a variable describing a tip movement away from its equilibrium position z0 . The position of
z0 is determined by a quasi-static pulling off force Fpul. One can write the following differential
equation for δz:
..
.
meff δz + γ δz + k eff δz = Fω cos(ωt )
(1)
Parameters meff and γ characterize the tip vibrations in liquid and keff = k + kcomplex, where k is the
spring constant of the cantilever. The solution of (1) is well known: δz = A cos(ωt + ϕ ) with an
amplitude A
Fω
(2)
A=
(meff ω 2 − k ) 2 + γ 2ω 2
and a phase shift ϕ
sin ϕ =
γω
(meff ω − k ) 2 + γ 2ω 2
2
(3)
If ω<<ω0 (where ω 0 = k / meff and for the small quality factor Q ≥ 2 ω0 ≈ ωres, where ωres –
resonance frequency and ω res = ω 0 1 − (1 / 4Q 2 ) ) the equation for an amplitude can be further
simplify and gives
A=Fω/k
From measurements of A done with a lock in amplifier for following cycles: tip vibrations
without antigen-antibody interaction, tip vibrations with such a bond at different pulling off
forces Fpul and tip vibrations after rupture of Ag-Ab bond, we calculate the reciprocal spring
constants k-1, (k+kcomplex)-1 and k-1 respectively. The value of k is known that makes possible to
determine kcomplex of single antigen-antibody complex as a function of z and Fpul .
From our recorded data we distinguish the following cases (see Fig. 2):
single bond rupture with unbinding force of about 130 pN (Fig. 2A), double bond rupture (Fig.
2B, 295 pN), the forces greater than 1nN are believed to be the breaking of multiple
glutaraldehyde-amine bonds (data not shown) and “no specific event” (Fig. 2C). The lower curve
in Fig. 2C imitates well a single bond rupture behavior but the upper curve does not shows
85
peculiarities (there is no descending tendency of k during the pulling off process). Consequently,
Fig. 2C does not represent specific antigen-antibody interactions.
2B "doubl e bond rupture"
2 A "singl e bond rupture"
Amplitude [arbitrary units]
6
2C "no s pec ifi c e ve nt"
6
di thering ampl itude
10
5
8
4
4
2
0
tip de fle ction (pulli ng off f orce )
C
-2
6
3
2
4
1
2
0
A
B
E
D
0
-1
-4
-2
-2
-6
-10
-5
0
5
10
15
20
-3
- 40
-2 0
Z displacement [nm]
0
20
-4
6 0 - 30
40
-2 0
Z displacement [nm]
- 10
0
10
20
30
40
50
Z displacement [nm]
Figure 2. Lock in amplifier signal (or dithering amplitude) and pulling off force as function of
sample displacement z.
Fig. 3 shows z-dependencies of complex spring constant kcomplex(z) (Fig. 3A) and of
pulling off force Fpul(z) (Fig 3B) for single-bond rupture. We have observed that the spring
constant of single (and double) BSA - Ab-BSA complex always increases with the increasing of
the pulling off force and reaches its maximum at a moment of bond rupture. We obtain a good
correlation between the value of specific interaction force and the estimated complex spring
constant. At the moment of single Ag-Ab bond rupture the average value of 0.017 ± 0.003 N/m
for kcomplex is calculated.
Figure 3A "kcomplex "
0,08
0,06
0,04
0,02
0,00
-0,02
-10
Figure 3B "F pul "
150
Pulling off force [pN]
Complex spring constant [N/m]
0,10
-5
0
5
10
15
20
100
50
0
-50
-100
-150
-10
Z displacement [nm]
-5
0
5
10
15
20
Z displacement [nm]
Figure 3. Complex spring constant and pulling off force for single BSA-Ab-BSA complex as function of
sample displacement z.
This study gives us the important complementary information about the process of
antigen-antibody binding which is not yet well understood. We are strongly confident that the
technique described above reveals an importance of the measurement of the spring constant for
the analysis of the tip-sample interaction. We are convinced that the spring constant of tip-sample
complex plays essential role as a unique characteristic comparable with a pulling off force F.
Acknowledgements
We are grateful to D. A. Lapshin for useful suggestions. This work was supported by the
Swiss National Science Foundation grant Nos. 2000-065160.01 and 2000-61751.00.
[1] Ducker, W. A., Senden, T. J., Pashley, R. M. Nature, 353 (1991) 239.
[2] Hinterdorfer, P., Baumgartner, W., Gruber, H. J., Schilcher, K., Schindler, H. Proc. Natl.
Acad. Sci. USA, 93 (1996) 3477.
[3] Shindler, D. Badt, P. Hinterdorfer, F. Kienberger, A. Raab, S. Wielert-Badt, and V. Ph. Pastushenko,
Ultramicroscopy, 82 (2000) 227.
[4] D. Sarid, in Scanning Force Microscopy, Oxford University Press, London, 1991.
86
© Copyright 2026 Paperzz