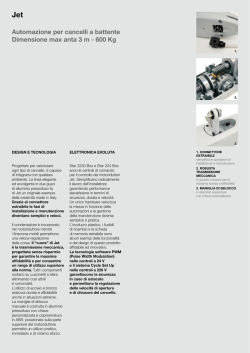
Astronomy
&
Astrophysics
A&A 566, A129 (2014)
DOI: 10.1051/0004-6361/201423944
c ESO 2014
The HH34 outflow as seen in [Fe II] 1.64 μm by LBT-LUCI
(Research Note)
S. Antoniucci1 , A. La Camera2 , B. Nisini1 , T. Giannini1 , D. Lorenzetti1 , D. Paris1 , and E. Sani3
1
2
3
INAF – Osservatorio Astronomico di Roma, via di Frascati 33, 00040 Monte Porzio Catone, Italy
e-mail: [email protected]
DIBRIS, Università di Genova, via Dodecaneso 35, 16146 Genova, Italy
INAF – Osservatorio Astrofisico di Arcetri, Largo Enrico Fermi 5, 50125 Firenze, Italy
Received 4 April 2014 / Accepted 9 May 2014
ABSTRACT
Context. Dense atomic jets from young stars copiously emit in [Fe ii] IR lines, which can, therefore, be used to trace the immediate
environments of embedded protostars.
Aims. We want to investigate the morphology of the bright [Fe ii] 1.64 μm line in the jet of the source HH34 IRS and compare it with
the most commonly used optical tracer [S ii].
Methods. We analyse a 1.64 μm narrow-band filter image obtained with the Large Binocular Telescope (LBT) LUCI instrument,
which covers the HH34 jet and counterjet. A point spread function deconvolution algorithm was applied to enhance spatial resolution
and make the IR image directly comparable to a [S ii] HST image of the same source.
Results. The [Fe ii] emission is detected from both the jet, the (weak) counter-jet, and from the HH34-S and HH34-N bow shocks.
The deconvolved image allows us to resolve jet knots close to about 1 from the central source. The morphology of the [Fe ii] emission
is remarkably similar to that of the [S ii] emission, and the relative positions of [Fe ii] and [S ii] peaks are shifted according to proper
motion measurements, which were previously derived from HST images. An analysis of the [Fe ii]/[S ii] emission ratio shows that
Fe gas abundance is much lower than the solar value with up to 90% of Fe depletion in the inner jet knots. This confirms previous
findings on dusty jets, where shocks are not efficient enough to remove refractory species from grains.
Key words. stars: protostars – stars: mass-loss – stars: jets – ISM: jets and outflows – ISM: abundances – techniques: image processing
1. Introduction
The Herbig-Haro (HH) object HH34 and its related jet represent
one of the most remarkable and well studied flow of matter from
a young star. The object HH34 is composed by a couple of large
bow-shocks (HH34 S and HH34 N) that are symmetrically displaced at a distance of about 0.2 pc with respect to the embedded
driving source HH34 IRS. Associated with the two bow-shocks,
a highly collimated chain of knots originating from HH34 IRS
forms a bright optical jet that points towards the HH34 S bow
(Bührke et al. 1988)
Imaging observations of a larger field around HH34 have revealed a number of additional bow shocks at larger distances,
indicating that the total extent of this bipolar flow is almost 3 pc
(Eislöffel & Mundt 1997; Devine et al. 1997). The driving source
HH34 IRS is a ∼0.5 M actively accreting protostar with Lbol ∼
15 L (Antoniucci et al. 2008).
The HH34 flow has been the subject of intense observational campaigns that include spectro-photometry and kinematical measurements at both optical and IR wavelengths (e.g.,
Heathcote & Reipurth 1992; Eislöffel & Mundt 1992; Morse
et al. 1992, 1993; Reipurth et al. 2002; Beck et al. 2007).
Detailed proper motion studies were conducted with multiepoch HST images, which were used to model the time-history
of the flow (Raga & Noriega-Crespo 1998; Raga et al. 2012).
These studies show that the HH 34 jet is subject to variations in
Based on observations obtained with the Large Binocular
Telescope.
velocity and jet axis direction, which might be due to precession
of the outflow induced by a possible companion.
Several IR spectroscopic investigations have been performed
on the HH34 jet, showing that it copiously emits in both [Fe ii]
and H2 transitions (Podio et al. 2006; Takami et al. 2006;
Garcia Lopez et al. 2008; Davis et al. 2011). The IR spectroscopy has revealed for the first time the presence of a counterjet (Garcia Lopez et al. 2008), which has later been imaged with
Spitzer (Raga et al. 2011). The aim of this note is to complement the previous near-IR spectroscopic investigations of HH34
with high quality imaging in [Fe ii] 1.64 μm, as obtained with
the instrument LUCI (Seifert et al. 2003) mounted on the Large
Binocular Telescope (LBT). We compare the morphology of the
jet in the IR with that of a commonly used optical tracer like
[S ii]. The [Fe ii] 1.64 μm line traces dense (∼104 cm−3 ) shocked
gas at low excitation (T ex = 11 000 K): being in the infrared, it
can reveal details on the more embedded jet regions that remain
obscured at optical wavelengths.
Previous imaging observations in [Fe ii] of HH34 were performed by Stapelfeldt et al. (1991) and Reipurth et al. (2000);
this latter observation was obtained with the HST-NICMOS
camera. The sensitivity of these images was, however, not high
enough to study the details of the IR jet and identify the embedded counter-jet. Sensitive spectro-imaging in [Fe ii] were obtained by Davis et al. (2011), but they cover only a small 3 × 3
field around the HH34 IRS source.
In the present note, we describe the [Fe ii] morphology of
the flow in comparison with an optical [S ii] image taken with
Article published by EDP Sciences
A129, page 1 of 5
A&A 566, A129 (2014)
the HST. Such a comparison has been improved by the application of a suitable deconvolution method (La Camera et al. 2014)
to the seeing limited LBT image. In addition, we measure the
[Fe ii]/[S ii] ratio along the jet and relate it to iron depletion variations in the different shock episodes.
HH34 N
2. Observations and reduction
Jet direction
Imaging with LUCI (4 × 4 field of view with a pixel scale of
0. 118/pix), which was equipped with the [Fe ii] filter (λeff =
1.646 μm, Δλ = 0.018 μm), was carried out at the LBT on two
different nights (Feb. 19 and Apr. 1 2013) using a dithering technique for a total combined exposure time of 30 min. The reduction of the two datasets was achieved using the LBT pipeline
developed at the Rome Observatory, in which the raw frames are
first pre-reduced by subtracting a median stack dark image and
by applying a flat-field that is obtained by combining a set of
sky flats (each subtracted by its own dark and normalised by its
own median background level). After this step, cosmetic masks
are created to flag out saturated regions, cosmic rays events, and
bad pixels; maps of background are then subtracted from each
image. Finally, for each scientific frame, an accurate astrometric
calibration is computed to correct for geometrical distortions;
this allows the use of SWarp (Bertin et al. 2002) to both resample the processed images and create the final mosaic stack. Given
that the seeing conditions were similar during the two nights of
observations, the final [Fe ii] image was obtained from the combination of the two exposures. The point spread function (PSF)
full-width-at-half-maximum of this final image, which was measured on several field stars, is about 0. 85.
3. Results and analysis
3 arcsec
HH534
counterjet
nebula
HH34 IRS
Re 22
10 arcsec
3.1. Large-scale morphology
The central portion of the final image covering an area of
75 × 75 around HH 34 is shown in the middle panel of Fig. 1.
The collimated southern jet (detected in optical images and composed by blue-shifted gas) emerges from the IR bright HH34 IRS
source and is clearly visible. The northern counter-jet is also detected, although at a much fainter level. The region around HH34
IRS is characterised by a large nebulosity, which prevents a clear
view of the red-shifted counter-jet close to the central source. An
enhanced collimated emission is, however, observed along the
direction of the jet axis, which indicates that the counter-jet extends close to the source, as already shown spectroscopically by
Garcia-Lopez et al. (2008). The emission knots observed in the
counter-jet are about an order of magnitude fainter than the corresponding blue-shifted jet knots. Assuming this is due to the
extinction, this implies an AV of about 12−13 mag towards the
brightest counter-jet knots (at a distance of ∼15 from source).
The extinction value in the jet blue-shifted and symmetrically
displaced knots, as estimated through IR spectroscopy of [Fe ii]
line ratios, is about 1.5 mag (Podio et al. 2006). To account for
the different extinctions, a H2 column density that is about a factor of ten higher in the counter jet than in the blue-shifted jet
is therefore needed. Such a higher column density in the redshifted region is not supported by millimeter maps of the region
(Johnstone & Bally 2006). On the other hand, the HH34 jet and
counter-jet appear symmetric in the Spitzer IRAC images, which
are sensitive to H2 emission (Raga et al. 2011). It is possible
that the counter-jet has a different excitation structure with the
molecular component that is more enhanced with respect to the
atomic one.
A129, page 2 of 5
HH34 S
Jet direction
3 arcsec
Fig. 1. LBT-LUCI image of the HH34 region obtained with a narrowband filter centred on the [Fe ii] 1.64 μm transition. The middle panel
shows the region that comprises the HH34 collimated jet and its driving source, HH34 IRS. The top and bottom panels display the region
around the two large bow shocks HH34 N and HH34 S, respectively,
which are located at about 100 from HH34 IRS. Background areas
display a mean rms of 9 × 10⁻¹⁹ erg s−1 cm−2 pixel−1 . The bottom contour mark the 5σ level in the upper and lower panels and the 10σ level
in the central panel. The remaining nine contours are traced using a logarithmic scale with the highest level corresponding to a flux 100 times
greater than the first contour. We note that in spite of the large nebulosity associated with the driving source, the HH34 counter-jet is detected
as a faint collimated emission.
In addition to the HH34 jet, the 1.64 μm image shows extended nebulosities that originate from the IR sources IRS5
S. Antoniucci et al.: HH34 as seen in [Fe ii] 1.64 μm by LBT-LUCI (RN)
[Fe II] deconvolved image
[Fe II] LBT - LUCI
HH34 IRS
[S II] HST
PSF residuals
A6-A5
A6-A5
A4
A4
jet knots
A3
A3
jet knots
A2
A2
A1
A1
1 arcsec
1 arcsec
1 arcsec
Fig. 2. [Fe ii] 1.64 μm image of the central HH34 region. The left and
middle panels show the original image and the image deconvolved by
adopting the algorithm described in La Camera et al. (2014), respectively. In the right panel, a HST image in [S ii] at 6716+6730 Å taken
in 2007 is shown for comparison (Hartigan et al. 2011).
and Re22, but no collimated emission that is indicative of shockexcited gas is associated with the HH534 object (Reipurth et al.
2002).
Symmetrically displaced at about 100 from the source, we
detected both the HH 34 N and HH34 S bow shocks (top and
bottom panels of Fig. 1, respectively). They do not present structures that are morphologically different from those observed in
[S ii] with HST. Figure 1 shows that the HH34 N bow shock
appears to not be aligned with the direction of the jet. This is
consistent with the variations of the jet axis due to precession
already observed in optical HST images.
3.2. Image deconvolution and small scale morphology
As we see from Fig. 1, the close surrounding of HH34 IRS is
dominated by continuum emission from the bright source and
its reflection nebula. To reduce the contribution of the continuum
emission and get information on the jet structure at resolutions
comparable with HST images, we have applied a deconvolution
algorithm optimised for separating point-like structures from a
diffuse extended continuum to the image, which is named multicomponent Richardson-Lucy (MC-RL) (La Camera et al. 2014).
The MC-RL method is based on the decomposition of the target
as a sum of a point source (the star) and an extended source (the
jet). By assuming Poisson noise, a regularisation term is added to
the negative logarithm of the likelihood, which enforces smoothness of the jet component. A Richardson-Lucy like method is
finally employed for the minimisation of the obtained function
through iterations alternating between the two components.
The deconvolution algorithm was applied to the central region of the image, which covers the entire HH34 collimated jet,
by using 500 iterations. The PSF for the deconvolution was extracted from the average of three (point-like) stars present in the
image field by means of the Software Package AIRY (Correia
et al. 2002; La Camera et al. 2012).
Figure 2 shows the inner part of the HH34 jet before and
after the deconvolution. The PSF of the deconvolved image is
around 0. 24. For comparison, the figure also shows the most recent (2007) HST image in [S ii] at 6730 Å (Hartigan et al. 2011).
In the HST image the HH34 IRS continuum from the nebula
is weak, and the jet is traced close to the source through several emission knots, which have been named after Reipurth et al.
(2000) from A1 to A7, for decreasing distance from the source.
In the [Fe ii] deconvolved image, we are able to resolve knots
from A1 to A5, which are located at about 1 from the central
source. The position of the [Fe ii] knot peaks are shifted with respect to the knots in the [S ii] image due to the proper motion of
the jet. Raga et al. (2012) have recently studied the kinematics of
the HH34 jet using HST images with a nine-year time baseline.
They found that the jet knots follow a ballistic motion and the
tangential velocity of the internal A knots is about 200 km s−1 .
Assuming a distance of 414 pc (Menten et al. 2007), we expect
the knots to have moved by about 0. 5 during the time-line between the [S ii] and [Fe ii] observations. In A1, A2, and A3, we
measure a shift between 0. 4–0. 5, which is consistent with previous proper motion results. This evidence implies in turn that
there is no large difference in the [Fe ii] and [S ii] morphologies,
at least at a half-arcsec resolution.
Figure 3 shows the [Fe ii] deconvolved image of the entire
collimated jet compared to the [S ii] image. Given the small
number of field stars available for realignment, we estimate that
the two images are registered with an accuracy of about 0. 2. The
jet morphology in the two tracers is again very similar. In the
figure, the main knot peaks detected in [Fe ii] are indicated with
crosses and also reported on the [S ii] image for comparison. All
the knots visible in [S ii] are also detected in [Fe ii] with no appreciable variations in morphology but with the expected shifts
in position due to proper motion. These shifts range between 0. 4
and 0. 7 in the C-L knots with no apparent trends with distance.
Raga et al. (2012) derived that the tangential velocity decreases
from about 200 km s−1 to about 170 km s−1 going from the internal A knots to the more external C-E knots. We do not detect
variations in the angular shifts corresponding to this velocity decrease, which would correspond to about 0. 1. This is, however,
lower than the estimated image alignment accuracy.
3.3. [Fe II]/[S II] ratio and Fe abundance
The LUCI narrow-band image has been flux calibrated by considering the 2MASS K-band magnitude of four stars that are detected in the field. Zero point magnitude variations of the order of 0.3 mag have been measured among the selected stars,
which results in a 20% uncertainty on the absolute flux calibration of the image. Considering that the effective wavelengths of
the Fe narrow-band and 2MASS K-band filters (1.646 μm and
1.662 μm, respectively) differ by less than 0.02 μm and that the
stars used for determining the zero point do not present peculiar
spectral shapes in the near-IR range, we expect that the error related to the different bandwidths of the filters is negligible with
respect to the local fluctuations of the sky background. Table 1
reports the [Fe ii] fluxes measured on individual knots, by considering an aperture with a radius of 0. 6 (representing the typical
size of the brightest knots) and centred on the knot peak (coordinates are given in the table).
The [S ii] HST image has also been flux-calibrated to compare the [Fe ii]/[S ii] line ratios. With this aim, we used the
star 2MASS J05353040-0627072, which is the only optically
bright and isolated star present in the field. For this star, we
adopted an R-band magnitude of 17.95 ± 0.15 from the average of the R photometry from the GSC 2.3.2 (Lasker et al.
2008) and USNO-B1.0 (Monet et al. 2003) catalogues (18.1 and
17.8 mag, respectively). The relative uncertainty on flux calibration is therefore 15%.
The [Fe ii] 1.64 μm transition has a critical density of the order of 104 cm−3 and an excitation temperature of ∼11 000 cm−1 .
In comparison, [S ii] (6716+6730 Å) lines have critical densities of the order of 103 cm−3 and excitation temperatures of the
A129, page 3 of 5
A&A 566, A129 (2014)
[Fe II] LBT
A3
A2
A1
C
L
D1
D2
E
F1 F2
G
H
I
J
K
2 arcsec
[S II] HST
A3
A2
A1
C
L
D1
D2
E
F1 F2
G
H
I
J
K
N
2 arcsec
E
Fig. 3. [Fe ii] 1.64 μm deconvolved image of the entire HH34 jet is shown in comparison with the HST image in [S ii] at 6716+6730 Å. Both
images are rotated for a better comparison. Crosses mark the peaks of the emission knots detected in the [Fe ii] image. The same positions are
reported on the [S ii] image to make evident the shifts due to the jet proper motion.
Table 1. [Fe ii] 1.64 μm line fluxes.
Knot
A3
A2
A1
C
D1
D2
E
F
G
H
I
J
K
L
RA (J2000)
h m s
5:35:29.89
5:35:29.92
5:35:29.95
5:35:29.99
5:35:30.02
5:35:30.04
5:35:30.09
5:35:30.11
5:35:30.14
5:35:30.16
5:35:30.19
5:35:30.22
5:35:30.26
5:35:30.3
Dec (J2000)
◦
–6:27:00.6
–6:27:02.0
–6:27:03.2
–6:27:05.8
–6:27:07.5
–6:27:09.0
–6:27:11.6
–6:27:13.5
–6:27:15.7
–6:27:16.8
–6:27:18.3
–6:27:19.9
–6:27:22.1
–6:27:26.3
Fa
(10−15 erg s−1 cm−2 )
6.1
2.7
1.5
1.3
1.3
1.4
8.8
5.9
5.0
3.8
5.7
3.4
1.3
0.4
Notes. (a) Fluxes measured in a 0. 6 radius beam centred at the given
coordinates. Flux calibration uncertainty is of the order of 20%.
order of 20 000 cm−1 . Therefore, [Fe ii] is more sensitive than
[S ii] to dense gas at low excitation. Nisini et al. (2005) compared the relative intensity profiles of [Fe ii] and [S ii] lines expected in the post-shocked gas, showing that the emission zone
of the [Fe ii] 1.64 μm line overlaps with that of the [S ii] optical lines, although it is broader and covers a larger area in the
post-shocked region. However, these spatial differences are well
below the resolution of our observations, being the cooling zone
of the post-shocked gas only about 1014 cm wide (i.e. 0. 02 at
414 pc) (Hartigan et al. 1994).
Given the above considerations, the [Fe ii] 1.64 μm/[S ii]
(6716+6730 Å) line ratio is sensitive to the shock physical conditions, in particular for temperatures up to 20 000 K and in the
density range between 103 and 105 cm−3 (see Fig. 4). This ratio is, however, also sensitive to the relative Fe/S abundance in
the shocked gas. Iron, being a refractory element, is depleted
on grains in the dusty interstellar medium. If jets are dusty,
shocks can erode the grains and release Fe in gaseous form in
A129, page 4 of 5
Fig. 4. [Fe ii] 1.64 μm/[S ii](6716+6731 Å) intensity ratio, as predicted
by NLTE statistical equilibrium calculations, as a function of the electron density and for temperatures of 10 000 K and 20 000 K. Solar abundances from Asplund et al. (2006) are assumed. The dashed areas indicate the range of extinction corrected values measured in the internal
knots A and the external knots from C to L. The reported ranges also
include the uncertainties from both image calibrations and extinction.
The measured ratios are always below the predicted value, irrespective
of the assumed temperature and density, which indicates a Fe abundance
lower than solar.
a percentage that depends on the shock strength and pre-shock
density (e.g., Draine 2003). Several studies have shown that
the abundance of Fe gas along jets is indeed much lower than
solar with percentages of depletion that considerably change
among shocks and range from ∼10% up to 90% (i.e. Nisini
et al. 2002, 2005; Podio et al. 2006; Giannini et al. 2008, 2013).
In particular, Podio et al. (2006) derived that the abundance of
Fe gas along the HH34 jet, which is measured using the ratio
of [Fe ii] 1.64 μm/[P ii] 1.18 μm lines, is only about 10% of
the solar value. In Fig. 4, we compare the [Fe ii] 1.64 μm/[S ii]
(6716+6730 Å) ratio in the various knots along the jet with
S. Antoniucci et al.: HH34 as seen in [Fe ii] 1.64 μm by LBT-LUCI (RN)
the values predicted by assuming a solar Fe/S abundance ratio. Abundance values were taken from Asplund et al. (2006).
For this comparison, we have measured the [S ii] intensity in the
knots by considering the peak shifts with respect to the positions
given in Table 1 due to the proper motion. Observed values have
also been corrected for extinction by assuming the AV values estimated by Podio et al. (2006), which are namely AV = 7 mag in
the A knots and AV = 1.5 mag in the more external C-L knots
(see also Garcia Lopez et al. 2008). An error of about 1 mag
can be considered for these visual extinction estimates: this is
basically due to the uncertainty on the rate coefficients of the
[Fe II] lines used for the AV determination (see, e.g., Giannini
et al. 2008). The figure shows that the observed ratios are always
significantly lower than the predicted values, irrespective of the
assumed physical conditions. This agrees with Fe being largely
depleted from gas phase. We point out that the presented comparison assumes that [Fe ii] and [S ii] come from the same spatial region. However, as discussed above, [Fe ii] covers a larger
post-shocked region with respect to [S ii], so the observed values
should be corrected for their relative filling factors before comparison. This correction would make the observed ratios even
lower, thus exacerbating the difference with models that assume
solar values.
From the ratios of several optical/IR forbidden lines, Podio
et al. (2006) and Garcia Lopez et al. (2008) determined that the
density in the HH34 jet varies from ∼104 to ∼1−3 × 103 cm−3 in
the inner A and outer C-L knots, respectively, with a temperature
in the range 6000−14 000 K. Assuming these conditions, from
Fig. 4 we infer that the Fe gas phase abundance is ∼1−10% Fe
for knot A and ∼15−90% Fe for knots C-L. These results show
evidence that a larger Fe depletion is found in the inner knots
with respect to the rest of the jet. This dependence of Fe depletion on the distance from the driving source was also observed
in the HH1 jet (Nisini et al. 2005). Other refractory species, like
Ca, show the same trend of decreasing gas-phase abundance in
the inner jet regions (Podio et al. 2009). These trends might be
due to a higher density or lower shock velocity in the inner regions, which would diminish the efficiency of dust disruption.
Acknowledgements. We kindly thank Pat Hartigan for providing the [S ii] HST
image. We acknowledge the support from the LBT-Italian Coordination Facility
for the execution of observations, data distribution and reduction. The LBT is
an international collaboration among institutes in the United States, Italy, and
Germany. LBT corporation partners are: the University of Arizona on behalf of
the Arizona university system; the Istituto Nazionale di Astrofisica, Italy; the
LBT Beteiligungsgesellschaft, Germany, representing the Max-Planck Society,
the Astrophysical Institute of Potsdam, and Heidelberg University; The Ohio
State University, and the Research Corporation, on behalf of the University of
Notre Dame, University of Minnesota, and University of Virginia. The Guide
Star Catalogue-II is a joint project of the Space Telescope Science Institute
and the Osservatorio Astronomico di Torino. The USNO-B1.0 catalog was created by Dave Monet and collaborators at http://www.nofs.navy.mil/data/
fchpix/
References
Antoniucci, S., Nisini, B., Giannini, T., & Lorenzetti, D. 2008, A&A, 479, 503
Asplund, M., Grevesse, N., & Jacques Sauval, A. 2006, Nucl. Phys. A, 777, 1
Beck, T. L., Riera, A., Raga, A. C., & Reipurth, B. 2007, AJ, 133, 1221
Bertin, E., Mellier, Y., Radovich, M., et al. 2002, ASPC, 281, 228
Bührke, T., Mundt, R., & Ray, T. P. 1988, A&A, 200, 99
Correia, S., Carbillet, M., Boccacci, P., Bertero, M., & Fini, L. 2002, A&A, 387,
733
Davis, C. J., Cervantes, B., Nisini, B., et al. 2011, A&A, 528, A3
Devine, D., Bally, J., Reipurth, B., & Heathcote, S. 1997, AJ, 114, 2095
Draine, B. T. 2003, ARA&A, 41, 241
Eisloeffel, J., & Mundt, R. 1992, A&A, 263, 292
Eislöffel, J., & Mundt, R. 1997, AJ, 114, 280
Garcia Lopez, R., Nisini, B., Giannini, T., et al. 2008, A&A, 487, 1019
Giannini, T., Calzoletti, L., Nisini, B., et al. 2008, A&A, 481, 123
Giannini, T., Nisini, B., Antoniucci, S., et al. 2013, ApJ, 778, 71
Hartigan, P., Morse, J. A., & Raymond, J. 1994, ApJ, 436, 125
Hartigan, P., Frank, A., Foster, J. M., et al. 2011, ApJ, 736, 29
Heathcote, S., & Reipurth, B. 1992, AJ, 104, 2193
Johnstone, D., & Bally, J. 2006, ApJ, 653, 383
La Camera, A., Carbillet, M., Olivieri, C., Boccacci, P., & Bertero, M. 2012,
Proc. SPIE, 84453
La Camera, A., Antoniucci, S., Bertero, M., et al. 2014, PASP, 126, 180
Lasker, B. M., Lattanzi, M. G., McLean, B. J., et al. 2008, AJ, 136, 735
Menten, K. M., Reid, M. J., Forbrich, J., & Brunthaler, A. 2007, A&A, 474,
515
Monet, D. G., Levine, S. E., Canzian, B., et al. 2003, AJ, 125, 984
Morse, J. A., Hartigan, P., Cecil, G., Raymond, J. C., & Heathcote, S. 1992, ApJ,
399, 231
Morse, J. A., Heathcote, S., Hartigan, P., & Cecil, G. 1993, AJ, 106, 1139
Nisini, B., Caratti o Garatti, A., Giannini, T., & Lorenzetti, D. 2002, A&A, 393,
1035
Nisini, B., Bacciotti, F., Giannini, T., et al. 2005, A&A, 441, 159
Podio, L., Bacciotti, F., Nisini, B., et al. 2006, A&A, 456, 189
Podio, L., Medves, S., Bacciotti, F., Eislöffel, J., & Ray, T. 2009, A&A, 506, 779
Raga, A., & Noriega-Crespo, A. 1998, AJ, 116, 2943
Raga, A. C., Noriega-Crespo, A., Lora, V., Stapelfeldt, K. R., & Carey, S. J.
2011, ApJ, 730, L17
Raga, A. C., Noriega-Crespo, A., Rodríguez-González, A., et al. 2012, ApJ, 748,
103
Reipurth, B., Yu, K. C., Heathcote, S., Bally, J., & Rodríguez, L. F. 2000, AJ,
120, 1449
Reipurth, B., Heathcote, S., Morse, J., Hartigan, P., & Bally, J. 2002, AJ, 123,
362
Seifert, W., Appenzeller, I., Baumeister, H., et al. 2003, Proc. SPIE, 4841, 962
Stapelfeldt, K. R., Scoville, N. Z., Beichman, C. A., Hester, J. J., & Gautier, III,
T. N. 1991, ApJ, 371, 226
Takami, M., Chrysostomou, A., Ray, T. P., et al. 2006, ApJ, 641, 357
A129, page 5 of 5
© Copyright 2026 Paperzz