12th IMEKO TC10 Workshop on Technical Diagnostics
New Perspectives in Measurements, Tools and Techniques for Industrial Applications
June 6-7, 2013, Florence, Italy
An Automatic Measurement System for the Performance Evaluation of Medium-sized
and Large Photovoltaic Plants
Giovanni Bucci°, Fabrizio Ciancetta*, Edoardo Fiorucci°
°Dip. di Ingegneria Industriale e dell’Informazione e di Economia, Università degli Studi dell’Aquila,
Via G. Gronchi, 18 - 67100 L’Aquila
Phone: +390862434634; Fax: +390862434403
{ giovanni.bucci; edoardo.fiorucci}@univaq.it
*Dip. di Ingegneria Elettrica e delle Tecnologie dell’Informazione, Università di Napoli Federico II,
Via Claudio, 21 – 80125 Napoli
Ab st ra c tIn recent years renewable sources of power are being increasingly exploited to address the challenges of climate
change and fossil fuel depletion. Wind power and solar power are two of the few renewable energy sources
capable of rapidly satisfying a reasonable proportion of future energy requirements [1].
Acceptance testing of medium-sized and large photovoltaic (PV) plants requires functional tests executed to
verify the proper working and energy efficiency. A final certificate ensures the compliance with the technical
requirements, as required by Italian Conto Energia program. Tests must be conducted according to several
technical norms. The paper describes a measurement system, implemented for testing medium-sized PV plants in
full compliance with the international standards; moreover, the measurement system can be configured to
measure additional parameters, because it is software based. The measurement system has been adopted for the
performance evaluation of a 842 kWp PV plant, with satisfactory results.
I. Introduction
The first step in the PV plants testing consists in the checking of: i) electrical continuity and correct connection
among the PV modules; ii) correct grounding of voltage dischargers and external conducting parts; iii)
insulation of the electrical circuits from the ground, with measured resistance values according to IEC 603646:2006-02 “Low voltage electrical installations - Part 6: Verification” [2];; iv) behaviour of the plant in several
working conditions, as starting, stopping and mains voltage outage, as required by the standards [3-7].
In CEI 82-25 “Guide for design and installation of photovoltaic (PV) systems connected to MV and LV
networks” [3], the experimental characterization of PV plants is required to investigate their performance; to
evaluate the overall efficiency, the quantities to be measured are: i) the solar radiation on the panels’ surface; ii)
the air temperature in the shade; iii) the panels temperature; iv) the DC bus voltage; v) the total DC bus output
current in the; vi) the inverter output AC voltage; vii) the invert output AC current; ix) the active power and, x)
the electric energy injected to the mains.
The overall accuracy, that is required for the measurement chain including the transducers, must be equal or
better than: i) 5% for solar radiation; ii) 1 % for both the air and modules temperature; iii) 2% for voltage,
current and power.
Further requirements are defined in IEC 61724:1998-04 “ Photovoltaic system performance monitoring Guidelines for measurement, data exchange and analysis” [4]; in this standard, the features of the data
acquisition systems (DAQ) suitable for the PV plants testing are described. A particular attention is given to the
simultaneous sampling of the above mentioned quantities, to carry out all the measurements with the required
contemporaneity; this is a binding feature for the definitions of the measurment system architecture and in the
choice of the DAQ. The presence of voltage and current harmonic distortion, that are introduced by the inverter,
involves the adoption of transducers and DAQs with appropriate bandwidth and sampling frequency,
respectively.
To draw up a testing report, the measurment of the overall efficiency of the PV plant is required; it can be
perfomed in two steps.
The first one concerns the evaluation of the minimum efficiency of the installed PV modules; the conditions that
must be satisfied is (1):
Pdc > 0.85 * Pnom * I/Istc
(1)
189
12th IMEKO TC10 Workshop on Technical Diagnostics
New Perspectives in Measurements, Tools and Techniques for Industrial Applications
June 6-7, 2013, Florence, Italy
where Pdc is the PV generator output power, Pnom is the PV generator rated power, I is the solar radiation in
[W/m2] on the PV modules surface, Istc the solar radiation in standard conditions, assumed as 1000 W/m2.
The second step investigates the perfomance of the DC/AC convertion system; the conditions that must be
verified is (2):
Pac > 0.9 * Pdc
(2)
where Pac is the DC/AC convertion system output active power and Pdc is the PV generator output power.
The measurment of Pac and Pdc must be performed when the solar radiation on the modules surface I is at least
600 W/m2.
The modules temperature variations can involve appreciable effects on their efficiency; so, if during the
measurement of (1) the acquired temperature of the modules is grether than 40 °C, it is accepted a temperature
compensation. In these conditions, instead of (1), we can use (3):
Pdc > (1 − Ptpv - 0,08) * Pnom * I/Istc
(3)
where Ptpv quantifies the PV generator thermal losses, as reported in its datasheet; all the remaining losses ar
tipically assumed as 8%
In the performance evaluation of medium-sized and large PV plants, the geometrical dimensions make it difficult
to consider a uniform solar radiation for each installed PV module; moreover, the intensity of the DC and AC
currents can reach hundreds of ampere, with the related problems in their transduction [8, 9].
Finally, because of the use of DC/AC power converter, the PV plants can involve some important Power Quality
phenomena, in terms of voltage fluctuations, harmonic distortion and transients; their effects can be increased by
the MV line lenght, because in many cases the PV plants are located in the countryside and are distant from a
primary cabin [10, 11, 12, 13].
II. The measurement system
As reported in Section I, specific requirements are defined by the international standards, in particular for the
accuracy of the measurements and for their simultaneous execution.
It is possible to find commercially available measurment kits for the PV plants testing, but, often, their
performance are not completely satisfactory. The results of experimental characterizations carried out on the
most adopted kits show lacks in the sampling frequency and in the simultaneous acquisition of the signals; the
use of multiplexer, or transducers and AD/DC converter with long response times, can reduce the bandwidth of
the measurement system, and it introduces a phase displacement between the current and voltage signals, that
increases the errors in the efficiency measurement. Starting from these considerations, we decided to develop a
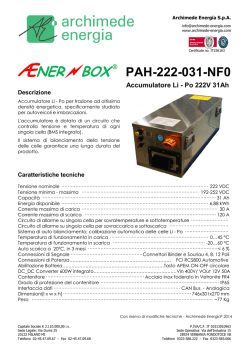
measurement system (Fig. 1) to perform all the required tests, in full compliance with the international standards;
moreover, the measurement system can be configured to measure additional parameters, because it is software
based [14, 15].
190
12th IMEKO TC10 Workshop on Technical Diagnostics
New Perspectives in Measurements, Tools and Techniques for Industrial Applications
June 6-7, 2013, Florence, Italy
Figure 1. The block diagram of the automatic measurement system.
The core of the measurement system is an Agilent multichannel data acquisition unit, equipped with: i) a chassis
Agilent U2781A; ii) 5 boards U2542A DAQ; iii) 5 terminal block and SCSI-II 68-pin connector U2902A.
The system can perform the simultanous sampling of 20 analog channels, with 16 bit resolution, and a sampling
frequency up to 500 kSample/s. With the adopted sampling frequency of 20480 Sample/s, time intervals of 200
ms have been acquired, according to IEC 61000-4-7 [16, 17].
The input signals have been transduced with: i) 1 LEM CV 3-1000 for the DC voltage; ii) 1 LEM LF 2005-S
for the DC current; ii) 3 LEM CV 3-500 for the AC voltages; iv) 6 LEM LF 2005-S for the AC currents; v) a
digital Sunmeter, 0–1250 W/m2, whit temperature compensation, for the solar radiation; vi) 4 J-type
thermocouples with compensation modules, for the air and PV modules temperatures.
We decided to use 2 current transducers in parallel connection on the AC busbars because of their sizes.
The perfomance of the measurment system have been evalueted by means of the Fluke 6100A Power Standard.
The obtained accuracies for each measured quantity are: i) ±0,2 % for the DC voltages; ii) ±0,2 % for the AC
voltages; iii) ±0,3 % for the DC currents; iv) ±0,3 % for the AC currents; v) ±0,5 % for the DC power; vi) ±0,5
% for the AC power; vi) ±3 % for the solar radiation; vii) ±1 % for the air and modules temperatures; viii) ±2 %
for the air humidity. In Fig. 2 the block diagram of the automatic measurement system is depicted.
The software performing the data acquisition, the measurements and the data processing has been developed in
the National Instruments LabVIEW environment, and it has been installed on a notebook PC linked to the
Agilent system via USB. The software can configure all the parameters required for the tests execution, and it
processes the instantaneous power waveforms, the power and efficiency values, attesting if the efficiency test [2]
has got a positive result; the measurement of the voltage and current harmonic distortion has been also included.
In detail, the software allows the user to perform the following task: i) input of the reference parameters for
testing; ii) input of the rated parameters of the PV plant under test, as reported in the technical documentation;
iii) setting of the acquisition parameters, in terms of number of channels to acquire, sampling frequency, buffer
sizes, transducers constants; iii) simultaneous acquisition of temperatures, solar radiation, AC and DC voltage
and current waveforms; iv) check of the presence of standard conditions for the solar radiation (I ≥ 600 W/m2)
and the PV modules temperature, to evaluate the efficiency according to (2) or (3); v) processing and
visualization of line and phase voltage and current waveforms; vi) processing and visualization of AC and DC
instantaneous power waveforms; vi) data processing for the check of conditions in (1), (2) or (3); vii) processing
and visualization of the amplitude spectra of the acquired voltage and current waveforms; viii) processing of the
current and voltage THD indexes; ix) data storage in NI TDMS format, and automatic visualization of the testing
report. A screenshot of the developed software is in Fig. 3.
III. The tested photovoltaic plant: experimental results
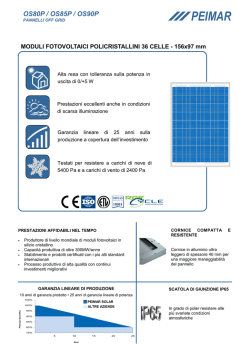
Figure2. PV plant layout.
The automatic testing system we developed has
been adopted to test the PV plant that
ENERGETICA Italy built near Cupello, a town
in the central Italy. 3828 PV polycrystalline
silicon modules, produced by ENERGETICA,
have beed installed in 2 sub-plant blocks, with a
total rated power of 842 kWp. Each sub-plant
consists of 87 parallel connected strings, each of
them consisting of 22 modules, type E2000/220,
rated power of 220 W @ 1000 W/m2 (Fig. 2).
Each subplant is connected to a different inverter,
type ABB PVS 800, rated power 500 kW; the
inverter cabin is aquipped with other
components, as a PLC, EMC filters, measuring
current and voltage transformers, current
breakers and sectionalising switches.
In Figures 4-6, some experimental results have
been reported; they allow the evaluation of the
performance of the tested PV plant. The results
refer to the efficiency testing of Inverter 1, in the
following conditions: i) solar radiation on the
modules surface 933 W/m2; ii) air temperature
30.2 °C; iii) PV modules mean temperature 38.4
191
12th IMEKO TC10 Workshop on Technical Diagnostics
New Perspectives in Measurements, Tools and Techniques for Industrial Applications
June 6-7, 2013, Florence, Italy
°C; iv) air humidity 46%; v) DC voltage 545.4 V; vi) AC current 683.1 A; vii) DC power 372.58 kW. The final
results of the testing are shown in Table I.
Figure 3. Screenshot of the developed measurement software.
Figure 4. Output voltage waveforms.
Figure 5. Output current waveforms.
Figure 6. Output instantaneous power waveforms.
192
12th IMEKO TC10 Workshop on Technical Diagnostics
New Perspectives in Measurements, Tools and Techniques for Industrial Applications
June 6-7, 2013, Florence, Italy
Table I. Results of the testing
Date and time of the test
Weather conditions
Air Temperature [°C]
Air Humidity %
PV Modules mean temeperature [°C]
Solar radiation [W/m2]
DC bus voltage [V]
DC bus current [A]
DC bus power [W]
Sub-plant rated power [W]
Reference sular radiation [W/m2]
AC bus voltages [Vrms]
AC bus currents [Arms]
AC bus active powers [W]
Power Factors
AC bus total active power [W]
Total apparent power [VA]
AC conversion efficiency %
Sub-plant #1
August 09, 2011; 12:22
clear sky
30
46
38
894,81
551,68
634,36
349967,68
420640
1000
V1 = 176,15; V2 = 175,72; V3 =
176,28
I1 = 648,55; I2 = 613,54 A; I3 =
614,44
P1 = 113114,44; P2 = 106395,84;
P3 = 107313,08
PF1 = 0,99; PF2 = 0,99;
PF3 = 0,99
326823,36
330366,84
93,3
Subplant #2
August 10, 2011; 11:12
clear sky
25
54
37
933,16
545,41
683,11
372573,12
420640
1000
V1 = 176,66; V2 = 176,13; V3 =
176,67
I1 = 655,80; I2 = 659,07 A; I3 =
660,32
P1 = 114581,14; P2 = 114672,37;
P3 = 115376,04
PF1 = 0,99; PF2 = 0,98;
PF3 = 0,99
344629,55
348594,35
92,5
IV. Conclusions
In this paper, an automatic measurement system for the performance evaluation of medium-sized and large
photovoltaic plants has been presented. Although it is possible to find commercially available measurment kits
for the PV plants testing, often their performance are not completely satisfactory. The developed system can
perform all the required tests, in full compliance with the international standards, as required by Italian Conto
Energia program; moreover, the measurement system can be configured to measure additional parameters,
because it is software based. The automatic testing system we developed has been adopted to test the PV plant
that ENERGETICA Italy built near Cupello, a town in the central Italy; the PV plant consists of 3828 PV
polycrystalline silicon modules, produced by ENERGETICA installed in 2 sub-plant blocks, with a total rated
power of 842 kWp; the obtained results are satisfactory.
A further improvement of the system could be reached by integrating wireless sensor units, to increase the
number of measured temperatures on the PV modules [18], and introducing smart power system distributed on
the plants [19, 20].
References
[1] G. Bucci, E Fiorucci, F. Ciancetta, D. Gallo, C. Landi, M. Luiso “A Low-Cost Ultrasonic Wind Speed and
Direction Measurement System” Proceedings of IEEE I2MTC, Minneapolis USA, May 6-9 2013
[2] IEC 60364-6:2006-02 “Low voltage electrical installations - Part 6: Verification”
[3] CEI 82-25: 2011: “Guide for design and installation of photovoltaic (PV) systems connected to MV and LV
networks”.
[4] IEC 61724:1998-04: “Photovoltaic system performance monitoring - Guidelines for measurement, data
exchange and analysis”.
[5] IEC 60904-1:2006-09: “ Photovoltaic devices - Part 1: Measurement of photovoltaic current-voltage
characteristics”.
[6] IEC 60904-2:2007-03: “Photovoltaic devices - Part 2: Requirements for reference solar devices”.
[7] IEC 60904-3:2008-04: “Photovoltaic devices - Part 3: Measurement principles for terrestrial photovoltaic
(PV) solar devices with reference spectral irradiance data”.
193
12th IMEKO TC10 Workshop on Technical Diagnostics
New Perspectives in Measurements, Tools and Techniques for Industrial Applications
June 6-7, 2013, Florence, Italy
[8] E. Fiorucci, G. Bucci, “A low-cost contactless transducer for the measurement of DC currents up to 13 kA”,
IEEE Transactions On Instrumentation And Measurement, vol.62, issue 4 Apr. 2013, Page(s): 845-852.
ISSN: 0018-9456
[9] D. Gallo, C. Landi, M. Luiso, “Real Time Digital Compensation of Current Transformers over a Wide
Frequency Range”, IEEE Transactions on Instrumentation and Measurement, Volume: 59 , Issue: 5,
Publication Year: 2010 , Page(s): 1119 – 1126, ISSN: 00189456
[10] D. Gallo, C. Landi, M. Luiso, “Severity Assessment Issues for Short Voltage Dips”, Elsevier Measurement,
Volume 43, Issue 8, October 2010, Pages 1040-1048, ISSN: 02632241
[11] D. Gallo, C. Landi, M. Luiso, “Issues in the Characterization of Power Quality Instruments”, Elsevier
Measurement, Volume 43, Issue 8, October 2010, Pages 1069-1076, ISSN: 02632241
[12] D. Gallo, C. Landi, M. Luiso, “AC and DC Power Quality of Photovoltaic Systems”, Proceedings of IEEE
International Instrumentation and Measurement Technology Conference I2MTC 2012, Graz, Austria, 13-16
May 2012, Digital Object Identifier: 10.1109/I2MTC.2012.6229309, Publication Year: 2012 , Page(s): 576581, ISBN: 978-1-4577-1771-0
[13] D. Gallo, C. Landi, M. Luiso, E. Fiorucci, G. Bucci, F. Ciancetta, "Realization and Characterization of an
Electronic Instrument Transducer for MV Networks with Fiber Optic Insulation", WSEAS Transactions on
POWER SYSTEMS, Issue 1, Volume 8, January 2013 pag. 45-56, ISSN: 1790-5060 E-ISSN: 2224-350X
[14] G.Bucci, E.Fiorucci, C.Landi, "Digital Measurement Station for Power Quality Analysis in Distributed
Environments", IEEE Transactions On Instrumentation And Measurement, vol.52, issue 1 Febr. 2003,
pp.75-84. ISSN: 0018-9456.
[15] G. Bucci, E. Fiorucci, C.Landi "A Digital Instrument for the Light Flicker Effect Evaluation" IEEE
Transactions On Instrumentation And Measurement, vol. 57, issue 1, Page(s): 76-84, Jan. 2008. ISSN:
0018-9456.
[16] IEC 61000-4-7:2002-08: “ Electromagnetic compatibility (EMC) - Part 4-7: Testing and measurement
techniques - General guide on harmonics and interharmonics measurements and instrumentation, for power
supply systems and equipment connected thereto”.
[17] E. Fiorucci, G. Bucci, F. Ciancetta, "Metrological Characterization of Power Quality Measurement Stations:
a Case Study", IJIT International Journal of Instrumentation Technology (IJIT) ISSN (Online): 2043-7862 ISSN (Print): 2043-7854 DOI 10.1504/IJIT.2011.043595.
[18] G. Bucci, E. Fiorucci, C.Landi, G. Ocera, "Architecture of a digital wireless data communication network
for distributed sensor applications", Measurement, Journal of International Measurement Confederation,
Vol. 35, issue 1, pages 33-45.
[19] G. Del Prete, D. Gallo, C. Landi, M. Luiso, “The Use of Real-Time Instruments for Smart Power Systems”,
Proceedings of 2012 IEEE International Energy Conference and Exhibition, ENERGYCON 2012, Florence,
Italy, 09-12 September 2012, Digital Object Identifier: 10.1109/EnergyCon.2012.6348276, Publication
Year: 2012, Page(s): 884-889, ISBN: 978-1-4673-1454-1
[20] D. Gallo, C. Landi, M. Luiso, G. Bucci, E. Fiorucci “Low Cost Smart Power Metering” Proceedings of
IEEE I2MTC, Minneapolis USA, May 6-9 2013
194
© Copyright 2026 Paperzz