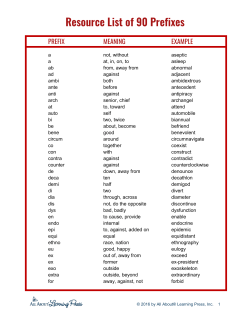
MARKETBEAT
Office Snapshot 2Q 2016
Baltimore
Market Overview
BALTIMORE OFFICE
The Baltimore metropolitan office market finished the
second quarter of 2016 with almost 11.5 million square feet
of vacant space and a 14.6% vacancy rate. Net positive absorption in the second quarter totaled 189,284 square feet,
up from the first quarter of 2016. Total net positive absorption for the year is almost 300,000 square feet. Construction completions dropped off slightly in the second quarter
as only 159,000 square feet of new inventory was delivered, compared to almost 440,000 square feet in the first
quarter of 2016. However, almost one million square feet of
additional new space is expected to deliver in the second
half of 2016, of which approximately 65% has already been
preleased. A total of 2.34 million square feet of new office
space is currently under construction, the highest total in
the metropolitan region since before the recession.
Economic Indicators
2Q 2015
2Q 2016
Baltimore Employment
1.38M
1.41M
Baltimore Unemployment
6.2%
4.3%
U.S. Unemployment
5.4%
4.9%
12-Month
Forecast
Market Indicators (Overall, All Classes)
2Q 2015
2Q 2016
Vacancy
15.4%
14.6%
Net Absorption (sf)
349K
189K
Under Construction (sf)
Average Asking Rent*
2.1M
2.3M
$22.93
$21.56
12-Month
Forecast
*Rental rates reflect gross asking $psf/year
Overall Net Absorption/Overall Asking Rent
4Q TRAILING AVERAGE
500,000
$23
300,000
$23
100,000
-100,000
$22
The Class A sector in Baltimore has a vacancy rate of 11.3%
as slightly more than four million square feet of vacant
space is currently available. Approximately 65,000 square
feet of net positive absorption in the second quarter increased the annual total for Class A space to slightly more
than 255,000 square feet. The Class B sector has a 17.3%
vacancy rate after almost 125,000 square feet of net positive absorption in the second quarter increased the annual
total out of the negative to almost 41,000 square feet.
-300,000
$22
-500,000
$21
-700,000
2010
2011
2012
2013
Net Absorption
2014
2015
2016
Asking Rent, $ PSF
Overall Vacancy
21%
20%
19%
18%
Historical Average = 17.4%
17%
Baltimore City finished the second quarter with a vacancy
rate of 16.7% after approximately 29,000 square feet of net
negative absorption. The Class A sector has a vacancy rate
of 11.8% and the Class B sector has a vacancy rate of 20.2%.
The largest lease announcement of the quarter was the
future move of U.S. Army Corps of Engineers (ACE) to 2
Hopkins Plaza. This move, scheduled for 2018, will aid in the
redevelopment of the office building that has been vacant
since PNC moved in 2012. The majority of the building will
be converted to apartments. Other major lease announcements include the move of both the Baltimore Business
Journal and Bolton Partners to 36 South Charles Street.
Both moves will open up space along Pratt Street, a corridor that currently has only an 11.1% vacancy rate.
16%
15%
14%
2010
2011
2012
2013
2014
2015
2016
The Northern Baltimore-Washington (NBW) Corridor,
comprised of the BWI Airport, Howard County and Greater
Annapolis submarkets, finished the second quarter of 2016
cushmanwakefield.com I 1
MARKETBEAT
Office Snapshot 2Q 2016
Baltimore
with almost 122,000 square feet of net positive absorption,
lowering the office vacancy rate to 12.25%. The Class A
sector has an 8.3% vacancy rate after relatively flat absorption activity in the second quarter. The Class B sector
actually accounted for more than 137,000 square feet of
net positive absorption, lowering its vacancy rate to 15.4%.
This spillover of demand into the Class B is not surprising
considering the tight vacancy rate in the Class A sector.
Pratt Street Corridor
THE MOST EXPENSIVE ADDRESS IN BALTIMORE HAS LITTLE NEW
AVAILABILITY
Four Quarter Trailing Average
150,000
20.00%
100,000
16.00%
50,000
12.00%
0
8.00%
-50,000
4.00%
A TOTAL OF 2.34 MILLION SQUARE FEET OF
NEW OFFICE SPACE IS CURRENTLY UNDER
CONSTRUCTION, THE HIGHEST TOTAL IN THE
-100,000
0.00%
2010
METROPOLITAN REGION SINCE BEFORE THE
2011
2012
2013
2014
Net Absorption
2015
2016
Vacancy Rate
RECESSION
Northern Baltimore-Washington Corridor
The Suburban North and West submarkets combined for
13,290 square feet of net positive absorption in the second
quarter of 2016 and have totaled almost zero net absorption year-to-date in 2016. The Suburban North submarket
remains the stronger of the Baltimore Beltway markets, as
evidenced by the 11.2% overall vacancy rate and the 7.7%
Class A vacancy rate. The I-83 Corridor and Towson primarily contribute to this low vacancy rate, and there is currently
very little new construction to add to the tight supply of
Class A office space. Other than several one-story buildings
being constructed at Baltimore Crossroads in White Marsh,
new construction is limited to the Towson Row mixed-use
development near Towson University.
AVAILABLE OFFICE INVENTORY CONTINUES TO SHRINK, DRIVING
NEW CONSTRUCTION
20%
18%
Historical Average = 15.5%
16%
14%
12%
10%
2010
2011
2012
2013
2014
2015
2016
Under Construction Totals
Outlook
• Rents have not demonstrated sustained growth during
this recovery cycle; flat to limited rent growth could
continue.
• Absorption totals in Downtown Baltimore will increase
dramatically by year-end, particularly as new, preleased
construction is delivered to the market.
• Vacancy rates in Howard County could increase slightly as
new construction delivers to the market; however the new
blocks of space will be very attractive in an otherwise
tight market.
NEW CONSTRUCTION IN THE CBD IS DRIVING THE INCREASE IN
NEW INVENTORY
3,000,000
2,500,000
2,000,000
1,500,000
1,000,000
500,000
0
2005 2006 2007 2008 2009 2010 2011 2012 2013 2014 2015 2016
Suburban
CBD
cushmanwakefield.com I 2
MARKETBEAT
Office Snapshot 2Q 2016
Baltimore
YTD
CURRENT NET
OVERALL
ABSORPTION
NET
(SF) ABSORPTION
(SF)
UNDER
CNSTR
(SF)
OVERALL
AVERAGE
ASKING RENT
(ALL CLASSES)*
OVERALL
AVERAGE
ASKING RENT
(CLASS A)*
136,776
69,040
$22.05
$28.45
-29,024
-92,530
839,836
$21.61
$24.39
6,051
21,874
0
$25.80
$27.50
33.54%
83,082
82,297
26,000
$28.25
$28.25
TOTAL
BLDGS
INVENTORY
(SF)
DIRECT
VACANT
(SF)
OVERALL
VACANCY
RATE
163
11,620,027
1,494,740
12.86%
36,273
Baltimore City
171
20,464,170
3,425,033
16.74%
Greater Annapolis Area
104
4,203,606
770,454
18.33%
42
2,342,499
785,604
SUBMARKET
BWI Airport
Harford County
Howard County
861
17,758,894
1,847,024
10.40%
79,612
140,533
750,412
$24.00
$26.50
Suburban North
240
14,466,305
1,625,139
11.23%
47,995
17,077
362,240
$21.00
$23.25
Suburban West
BALTIMORE TOTALS
152
8,031,243
1,533,577
19.10%
-34,705
-9,956
298,600
$19.10
$21.00
1,733
78,886,744
11,481,571
14.55%
189,284
296,071
2,346,128
$21.56
$24.61
TOTAL
BLDGS
INVENTORY
(SF)
SUBLET
VACANT
(SF)
DIRECT
VACANT
(SF)
330 35,574,709
130,580
3,881,106
11.28%
64,658
1,403 43,312,035
295,758
7,174,127
17.25%
124,626
*Rental rates reflect gross asking $psf/year
SUBMARKET
*Rental
reflect gross asking $psf/year
Class rates
A
Class B
YTD
CURRENT
OVERALL
OVERALL
NET
VACANCY
NET
ABSORPTION
RATE
ABSORPTION
(SF)
(SF)
UNDER
CNSTR
(SF)
DIRECT
AVERAGE
ASKING RENT*
OVERALL
AVERAGE
ASKING RENT*
255,274 1,762,748
$25.05
$24.61
$17.50
$17.35
40,797
582,380
*Rental rates reflect gross asking $psf/year
Key Lease Transactions 2Q 2016
PROPERTY
Hopkins Plaza
SF
143,000
TENANT
TRANSACTION TYPE
SUBMARKET
U.S. Army Corps of Engineers
Lease
Baltimore City
Rivers Corporate Park
57,480
JHU Applied Physics Laboratory
Lease
Howard County
Annapolis Commons
25,000
South Moon Under
Lease
Greater Annapolis
10490 Little Patuxent Parkway
21,916
Harkins Builders
Lease / Relocation
Howard County
Key Sales Transactions 2Q 2016
PROPERTY
SF
SELLER/BUYER
Metro West - 300 North Greene St
899,892
U.S. GSA / Caves Valley Partners
Towson Commons - Lafayette Bldg
52,230
Garrison Investment Group /
Mid-Atlantic Properties
315,350
Hudson Advisors / Northrop Grumman
West Quest Technology Park
PRICE / $PSF
$7,073,740 / $7.86
$3,200,000 / $61.27
$79,000,000 / $250.52
SUBMARKET
Baltimore City
Suburban North
BWI Airport
cushmanwakefield.com I 3
MARKETBEAT
Office Snapshot 2Q 2016
Baltimore
OFFICE SUBMARKETS
BALTIMORE, MD
Forest Hill
Westminster
23
31
27
Sparks
Glencoe
140
88
146
91
Phoenix
Fallston
145
24
1
25
32
Clearview
Airpark Airport
Reisterstown
SUBURBAN
WEST
97
Hunt Valley
Oregon
Ridge Park
140
Cockeysville
Timonium
Woodlawn
99
97
Dayton
83
45
Sandtown-Winchester
70
Baltimore
1
Arbutus
White Marsh
West
Elkridge
Columbia
Weide Ahp
(Aberdeen Proving
Ground)
Essex
702
Canton
Essex Skypark
Airport
95
Dundalk
Cherry Hill
Edgemere
213
151
Curtis Bay
Pumphrey
Elkridge
Hart-Miller Island
State Park
157
695
695
895
100
Edgewood
150
Middle River
895
Riverside
95
40
695
Halethorpe
175
Joppa
151
40
395
Catonsville
Ellicott City
Philips Aaf
159
Rosedale
BelairEdison
144
Dalton
Clarksville
129
40
HOWARD
COUNTY
32
695
Patapsco Valley
State Park
Abingdon
Carney
Glenham-Belford
Waltherson
Hampden
Frankford
Gwynn Oak
40
7
95
DOWNTOWN
40
70
924
542
Reisterstown
Glen
Station
Central Park
Heights
Lochearn
Milford Mill
Aberdeen
95
543
Kingsville
Parkville
Pikesville
Woodbine
695
139
695
Randallstown
40
HARFORD
COUNTY
152
Towson
26
97
Bel Air
South
24
Perry Hall
Garrison
Sykesville
SUBURBAN
NORTH
83
795
North Point
State Park
298
21
445
10
Highland
Brinklow
97
Olney
108
97
North Laurel
200
T. Howard
Duckett
Watershed
1
Laurel
29
200
95
29
Chillum
Bowie
Greenbelt
Hyattsville
Cushman & Wakefield
100 Light Street, Suite 1400
Baltimore, MD 21202
cushmanwakefield.com
Lake Shore
Severna
Park
Bacon Ridge
Natural Area
GREATER
ANNAPOLIS
Crofton
AREA
450
95
424
Lanham-Seabrook
301
50
For more information, contact:
Matthew Myers, Senior Research Analyst
Tel: +1 410 347 7808
[email protected]
445
648
Arnold
Eastern Neck
National
Wildlife Refuge
301
97
Glenn Dale
201
32
3
College
Park
1
Rock Hall
2
Settler’s
View
295
Hollywood
Langley
Park
Ashburn
Bayside
Beach
177
175
Woodbridge
Crossing
495
Forest Glen
177
Pasadena
Patuxent
Research
Refuge
Beltsville
Woodmor
174
South Laurel
1
212
97
BWI AIRPORT
Fort Meade
Odenton
Calverton
Silver
Spring
Severn
295
32
446
20
Five Buoys
10
Cloverly
Fairland
Riviera
Beach
Glen Burnie
32
28
Chevy
Chase
Baltimore-Washington
International Thurgood
Marshall Airport
Fulton
Ashton
289
Ferndale
95
40
Havre De
Grace
7A
40
Owings Mills
32
70
147
129
Eldersburg
Fallston
Airport
Baldwin
45
Liberty
Reservoir
155
165
45
Flinkburg
462
Harford
County Airport
22
Bel Air
83
128
155
Bel Air North
152
50
450
Parole
665
50
18
Annapolis
Bay Bridge
Airport
Chester
50
301
8
About Cushman & Wakefield
Cushman & Wakefield is a leading global real estate services firm that helps clients transform the way people work,
shop, and live. The firm’s 43,000 employees in more than 60 countries provide deep local and global insights that create
significant value for occupiers and investors around the world. Cushman & Wakefield is among the largest commercial
real estate services firms with revenue of $5 billion across core services of agency leasing, asset services, capital markets,
facility services (C&W Services), global occupier services, investment & asset management (DTZ Investors), project &
development services, tenant representation, and valuation & advisory. To learn more, visit www.cushmanwakefield.com
or follow @CushWake on Twitter.
Copyright © 2015 Cushman & Wakefield. All rights reserved. The information contained within this report is gathered from
multiple sources considered to be reliable. The information may contain errors or omissions and is presented without any
warranty or representations as to its accuracy.
cushmanwakefield.com I 4
© Copyright 2026 Paperzz