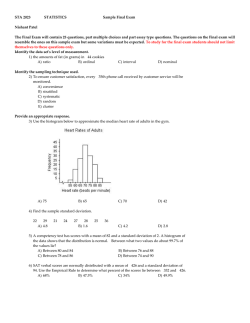
1. Height, in meters, is measured for each person in a sample. After the data are collected, all the height measurements are converted from meters to centimeters by multiplying each measurement by 100. Which of the following statistics will remain the same for both units of measure? (A) The mean of the height measurements (B) The median of the height measurements (C) The standard deviation of the height measurements (D) The maximum of the height measurements (E) The z-scores of the height measurements 2. A school principal wanted to investigate student opinion about the food served in the school cafeteria. The principal selected at random samples of 50 first-year students, 50 second-year students, 50 third-year students, and 50 fourthyear students to complete a questionnaire. Which of the following best describes the principal’s sampling plan? (A) A stratified random sample (B) A simple random sample (C) A cluster sample (D) A convenience sample (E) A systematic sample 3. A candy company produces individually wrapped candies. The quality control manager for the company believes that the weight of the candies is approximately normally distributed with mean 720 milligrams (mg). If the manager’s belief is correct, which of the following intervals of weights will contain the largest proportion of the candies in the distribution of weights? (A) 740 mg to 780 mg (B) 700 mg to 740 mg (C) 680 mg to 720 mg (D) 660 mg to 700 mg (E) 620 mg to 660 mg 4. A company currently uses Brand A lightbulbs, which have a mean life of 1,000 hours. A salesperson marketing Brand B, a new brand of bulb, contacts the company. The company will switch to the new brand of bulb only if there is convincing evidence that the mean life of Brand B is greater than 1,000 hours. Which of the following hypotheses should the company test? (A) H 0 : The mean life of Brand B bulbs is 1,000 hours. H a : The mean life of Brand B bulbs is more than 1,000 hours. (B) H 0 : The mean life of Brand B bulbs is 1,000 hours. H a : The mean life of Brand B bulbs is less than 1,000 hours. (C) H 0 : The mean life of Brand A bulbs is 1,000 hours. H a : The mean life of Brand A bulbs is more than 1,000 hours. (D) H 0 : The mean life of Brand A bulbs is 1,000 hours. H a : The mean life of Brand A bulbs is less than 1,000 hours. (E) H 0 : The mean life of Brand A bulbs is equal to the mean life of Brand B bulbs. H a : The mean life of Brand A bulbs is not equal to the mean life of Brand B bulbs. 5. The amount of time required for each of 100 mice to navigate through a maze was recorded. The histogram below shows the distribution of times, in seconds, for the 100 mice. Which of the following values is closest to the standard deviation of the 100 times? (A) 2.5 seconds (B) 10 seconds (C) 20 seconds (D) 50 seconds (E) 90 seconds 6. A graph (not shown) of the selling prices of homes in a certain city for the month of April reveals that the distribution is skewed to the left. Which of the following statements is the most reasonable conclusion about the selling prices based on the graph? (A) The mean is greater than the median. (B) The median is the average of the first quartile and the third quartile. (C) There are fewer selling prices between the first quartile and the median than there are between the median and the third quartile. (D) There are more selling prices that are less than the mean than selling prices that are greater than the mean. (E) The value of maximum minus third quartile is less than the value of first quartile minus minimum. 7. A survey was conducted in which both men and women were asked a question about a current issue. Possible responses to this question were “in favor of,” “not in favor of,” or “no opinion.” A chi-square test is to be used to determine whether the response to this question is independent of gender. The number of degrees of freedom for the chi-square test in this situation is (A) 6 (B) 5 (C) 3 (D) 2 (E) 1 8. If a probability distribution is symmetric, which of the following statements must be true? (A) The distribution is normal. (B) The distribution is uniform. (C) The distribution is bimodal. (D) The mean of the distribution is equal to the median of the distribution. (E) The interquartile range of the distribution is equal to the standard deviation of the distribution. 9. Let X represent the number on the face that lands up when a fair six-sided number cube is tossed. The expected value of X is 3.5, and the standard deviation of X is approximately 1.708. Two fair six-sided number cubes will be tossed, and the numbers appearing on the faces that land up will be added. Which of the following values is closest to the standard deviation of the resulting sum? (A) 1.708 (B) 1.848 (C) 2.415 (D) 3.416 (E) 5.835 10. Based on previous research, the standard deviation of the distribution of the age at which children begin to walk is estimated to be 1.5 months. A random sample of children will be selected, and the age at which each child begins to walk will be recorded. A 99 percent confidence interval for the average age at which children begin to walk will be constructed using the data obtained from the sample of children. Of the following, which is the smallest sample size that will result in a margin of error of 0.1 month or less for the confidence interval? (A) 400 (B) 900 (C) 1,300 (D) 1,600 (E) 2,100 11. Let X be a random variable that has a skewed distribution with mean пЃ пЂЅ 10 and standard deviation пЃі пЂЅ 10 . Based on random samples of size 400, the sampling distribution of x is (A) highly skewed with mean 10 and standard deviation 10 (B) highly skewed with mean 10 and standard deviation 5 (C) highly skewed with mean 10 and standard deviation 0.5 (D) approximately normal with mean 10 and standard deviation 10 (E) approximately normal with mean 10 and standard deviation 0.5 12. The number of hurricanes reaching the East Coast of the United States was recorded for each of the last ten decades by the National Hurricane Center. Summary measures are shown below. Min = 12 Max = 24 Lower quartile = 15 Upper quartile = 18 Median = 16 n = 10 Which of the following statements is true? (A) The smallest observation is 12 and it is an outlier. No other observations in the data set could be outliers. (B) The largest observation is 24 and it is an outlier. No other observations in the data set could be outliers. (C) Both 12 and 24 are outliers. It is possible that there are also other outliers. (D) 12 is an outlier and it is possible that there are other outliers at the low end of the data set. There are no outliers at the high end of the data set. (E) 24 is an outlier and it is possible that there are other outliers at the high end of the data set. There are no outliers at the low end of the data set. 13. Makers of a new pain-relieving medication claim that it relieves chronic pain faster than the current top-selling pain reliever on the market. A double-blind experiment was conducted in which 10 people who experience chronic pain were randomly selected to take either the new or the current medication. Each of the 10 people recorded the time, in minutes, from taking the medication until pain relief. After an appropriate time period, each of the 10 people took the other medication and recorded the time from taking the medication until pain relief. The medication each person took first was randomly determined, and because both medications look the same, the people in the study did not know which medication was taken first. The table below shows summary statistics for the results. Minutes until Pain Relief Difference New Medication Current Medication (new minus current) Mean 15.600 16.025 -0.425 Standard deviation 4.811 4.833 1.395 Which of the following values is closest to the p-value of the appropriate t-test? (A) 0.1802 (B) 0.3604 (C) 0.4230 (D) 0.5770 (E) 0.8198 14. Which of the following graphs represents a binomial distribution with and n = 20 and p = 0.25? (A) (B) (C) (E) (D) 15. An experiment will be conducted to determine whether children learn their multiplication facts better by practicing with flash cards or by practicing on a computer. Children who volunteer for the experiment will be randomly assigned to one of the two treatments. Because the children’s gender may affect the outcome, there will be blocking by gender. After practice, the children will be given a test on their multiplication facts. Why will it be impossible to conduct a double-blind experiment? (A) The experimenter will know whether the child is a boy or a girl and whether he or she used flash cards or the computer. (B) The child will know whether he or she is a boy or a girl. (C) The child will know whether he or she used flash cards or the computer. (D) The person who grades the tests will know whether the child was a boy or a girl. (E) The person who grades the tests will know whether the child used flash cards or the computer. 16. A police officer is using a radar device to check motorists’ speeds. Prior to beginning the speed check, the officer estimates that 40 percent of motorists will be driving more than 5 miles per hour over the speed limit. Assuming that the police officer’s estimate is correct, what is the probability that among 4 randomly selectedmotorists, the officer will find at least 1 motorist driving more than 5 miles per hour over the speed limit? (A) 0.0256 (B) 0.1296 (C) 0.3456 (D) 0.8704 (E) 0.9744 17. Zucchini weights are approximately normally distributed with mean 0.8 pound and standard deviation 0.25 pound. Which of the following shaded regions best represents the probability that a randomly selected zucchini will weigh between 0.55 pound and 1.3 pounds? (A) (B) (C) (D) (E) 18. In a recent survey, high school students and their parents were asked to rate 60 recently released movies. The ratings were on a scale from 1 to 9, where 1 was “horrible” and 9 was “excellent”. For each movie, the average rating by the students and the average rating by their parents was calculated and the scatterplot below was constructed. The horizontal axis represents the student rating, and the vertical axis represents the parent rating. Thus, an individual data point would represent the rating of a single movie. Which of the following statements is justified by the scatterplot? (A) The movies that the students liked the best also tended to be the movies that the parents liked the best, but the students tended to give lower scores. (B) The movies that the students liked the best also tended to be the movies that the parents liked the best, but the students tended to give higher scores. (C) The movies that the students liked the best also tended to be the movies that the parents liked the best, but each group tended to give the same scores. (D) The movies that the students liked the best tended to be the movies that the parents liked the least, but the students tended to give lower scores. (E) The movies that the students liked the best tended to be the movies that the parents liked the least, but the students tended to give higher scores. 19. Jessica wanted to determine if the proportion of males for a certain species of laboratory animal is less than 0.5. She was given access to appropriate records that contained information on 12,000 live births for the species. To construct a 95 percent confidence interval, she selected a simple random sample of 100 births from the records and found that 31 births were male. Based on the study, which of the following expressions is an approximate 95 percent confidence interval estimate for p, the proportion of males in the 12,000 live births? (A) 0.31 п‚± 1.96 (D) 0.31 п‚± 1.645 пЂЁ 0.31пЂ©пЂЁ 0.69 пЂ© 12,000 пЂЁ 0.5пЂ©пЂЁ 0.5пЂ© 100 (B) 0.31 п‚± 1.645 (E) 0.31 п‚± 1.96 пЂЁ 0.31пЂ©пЂЁ 0.69 пЂ© 12,000 (C) 0.31 п‚± 1.96 пЂЁ 0.5пЂ©пЂЁ 0.5пЂ© 12,000 пЂЁ 0.31пЂ©пЂЁ 0.69 пЂ© 100 20. A town manager is interested in comparing requests for various town-provided services (such as street maintenance and garbage pickup) with nationally published proportions of requests for the same services. Each request in a random sample of 500 service requests from the town was classified into one of 10 different categories. Which of the following tests could be used to determine whether the proportions of service requests classified into the 10 service categories for the town differ from national proportions? (A) A two-sample t-test for a difference of means (B) A matched-pairs t-test for means (C) A chi-square test of association (D) A chi-square goodness-of-fit test (E) A t-test for a correlation of proportions 21. Dan selected a random sample of 100 students from the 1,200 at his school to investigate preferences for making up school days lost due to emergency closings. The results are shown in the table below. Preference Number of Students Extend the school year into the summer 58 Go to school on Saturdays in the spring 42 58 42 Dan incorrectly performed a large sample test of the difference in two proportions using and and calculated 100 100 a p-value of 0.02. Consequently, he concluded that there was a significant difference in preference for the two options. Which of the following best describes his error in the analysis of these data? (A) No statistical test was necessary because 0.58 is clearly larger than 0.42. (B) The results of the test were invalid because less than 10% of the population was sampled. (C) Dan performed a two-tailed test and should have performed a one-tailed test. (D) A one-sample test for a proportion should have been performed because only one sample was used. (E) More options should have been included, and a chi-square test should have been performed. 22. The figure summarizes the heights, in centimeters, of approximately 400 pine seedlings six years after they were planted at a center for environmental study. Approximately half of the trees were fertilized yearly, and the remaining trees were never fertilized. Which of the following statements about the medians and interquartile ranges (IQRs) of the heights of the two groups of trees 6 years after being planted is true? (A) The medians and IQRs are the same for the unfertilized trees and the fertilized trees. (B) The median for the unfertilized trees is greater than the median for the fertilized trees, and the IQR is also greater for the unfertilized trees. (C) The median for the unfertilized trees is the same as the median for the fertilized trees, and the IQR is greater for the unfertilized trees. (D) The median for the unfertilized trees is less than the median for the fertilized trees, and the IQR is greater for the unfertilized trees. (E) The median for the unfertilized trees is less than the median for the fertilized trees, and the IQR is less for the unfertilized trees. 23. In a certain school, 17 percent of the students are enrolled in a psychology course, 28 percent are enrolled in a foreign language course, and 32 percent are enrolled in either a psychology course or a foreign language course or both. What is the probability that a student chosen at random from this school will be enrolled in both a foreign language course and a psychology course? (A) 0.45 (B) 0.32 (C) 0.20 (D) 0.13 (E) 0.05 24. Monthly rent was determined for each apartment in a random sample of 100 apartments. The sample mean was $820 and the sample standard deviation was $25. An approximate 95 percent confidence interval for the true mean monthly rent for the population of apartments from which this sample was selected is ($815, $825). Which of the following statements is a correct interpretation of the 95 percent confidence level? (A) In this population, about 95 percent of all rental prices are between $815 and $825. (B) In this sample, about 95 percent of the 100 rental prices are between $815 and $825. (C) In repeated sampling, the method produces intervals that include the population mean approximately 95 percent of the time. (D) In repeated sampling, the method produces intervals that include the sample mean approximately 95 percent of the time. (E) There is a probability of 0.95 that the true mean is between $815 and $825. 25. Two friends, Andy and Bob, participate in a game of bowling every week. From past experiences, it is known that both friends’ scores are approximately normally distributed, where Andy has a mean score of 150 with a standard deviation of 30, and Bob has a mean score of 165 with a standard deviation of 15. Assuming that their scores are independent, which of the following values is closest to the probability that Andy will have a greater score than Bob in a single game? (A) 0.16 (B) 0.28 (C) 0.31 (D) 0.33 (E) 0.37 26. Scientists have long believed that linear regression could be used to predict the brain weight of nonhuman mammals from the body weight. In one study, body weight, in kilograms, and brain weight, in grams, of 22 nonhuman mammals were measured. A linear regression analysis was performed, yielding the output below. Reg Analysis: Brain Wt vs Body Wt n = 22 Predictor Constant Body Wt P 0.000 0.000 Coef 68.688 1.096 SE Coef T 3.1270 21.966 0.1308 8.379 s = 103.995 R-sq = 77.8% R-sq (adj) = 77.6% Assuming that all conditions for inference are met, which of the following expressions represents a 95 percent confidence interval for the slope of the least squares regression line? (A) 1.096 п‚± 2.086 пЂЁ 0.1308пЂ© (B) 1.096 п‚± 2.086 пЂЁ103.995пЂ© пѓ¦ 0.1308 пѓ¶ (C) 1.096 п‚± 2.086 пѓ§ пѓ· пѓЁ 22 пѓё пѓ¦ 103.995 пѓ¶ (D) 1.096 п‚± 2.086 пѓ§ пѓ· 22 пѓё пѓЁ (E) 68.688 п‚± 2.086 пЂЁ 3.1270 пЂ© 27. A certain motel is roughly 20 miles from the entrance to Yosemite National Park. The motel manager wants to get a better estimate of the distance and asks five people to each measure the distance, to the nearest tenth of a mile, using the odometer in his or her car. The manager will use the median of the five measurements as the estimate of the distance. Which of the following statements is NOT a statistical justification for the manager’s plan? (A) Odometer reading should be considered a variable when used to measure this distance. (B) The median of the five measurements is more likely to be close to the actual distance than is a single measurement. (C) The actual distance should be considered a variable, and taking five measurements allows the manager to estimate the variability in the actual distance. (D) If one or two odometers give inaccurate readings, the estimate still should be fairly close to the actual distance. (E) The manager can get some indication of how far off the estimate might be. 28. A marketing research consultant for a hotel chain hypothesizes that men and women differ in their color preference for guest rooms. The consultant shows pictures of rooms decorated with three different color scheme to each person in a random sample of 110 men and to each person in a random sample of 90 women. The consultant asks each person to choose his or her favorite color scheme. A chi-square test for homogeneity of proportions will be used to test the consultant’s hypothesis. Assuming that the conditions for inference are met, which of the following statements is true for the test? 1 (A) The null hypothesis for the test is that the proportion of each gender who prefer each color scheme is . 3 (B) The sample size is too small to detect a significant difference in a chi-square test for homogeneity of proportions. (C) The test is not valid because the sample sizes are not equal. (D) The more that men and women differ in their color preferences, the larger the chi-square statistic will be. (E) The test would also be appropriate if 90 married couples had been used for the two samples. 29. The distribution of heights of 6-year-old girls is approximately normally distributed with a mean of 46.0 inches and a standard deviation of 2.7 inches. Aliyaah is 6 years old, and her height is 0.96 standard deviation above the mean. Her friend Jayne is also 6 years old and is at the 93rd percentile of the height distribution. At what percentile is Aliyaah’s height, and how does her height compare to Jayne’s height? (A) Aliyaah’s height is at the 17th percentile of the distribution, and she is shorter than Jayne. (B) Aliyaah’s height is at the 67th percentile of the distribution, and she is shorter than Jayne. (C) Aliyaah’s height is at the 67th percentile of the distribution, and she is taller than Jayne. (D) Aliyaah’s height is at the 83rd percentile of the distribution, and she is shorter than Jayne. (E) Aliyaah’s height is at the 83rd percentile of the distribution, and she is taller than Jayne. 30. For the three histograms above, which of the following correctly orders the histograms from the one with the smallest proportion of data above its mean to the one with the largest proportion of data above its mean? (A) J, K, L (B) J, L, K (C) K, L, J (D) L, K, J (E) All three histograms have the same proportion of data above their respective means. 31. A recent study examined 699 car accidents in Toronto over a fourteen-month period. Records of phone-service providers were used to determine whether the driver was using a cell phone during or immediately before the accident. Overall, the researchers found that drivers using cell phones were 4.3 times as likely to have an accident as drivers who were not using cell phones. The result was statistically significant. Which of the following can be concluded from this study? (A) Cell phone use increases the likelihood of a car accident. (B) There is an association between cell phone use and accidents, but not necessarily a causal relationship. (C) There is a correlation between cell phone use and accidents, but not necessarily an association. (D) The association between cell phone use and accidents is negative. (E) Cell phone use causes more accidents in Canada, but not necessarily in the United States. 32. The weight, in pounds, of a full backpack and the corresponding number of books in the backpack were recorded for each of 10 college students. The resulting data were used to create the residual plot and the regression output shown below. Parameter Estimate Std. Err. Alternative DF T-Stat P-Value Intercept 10.53 1.23 в‰ 0 8 8.57 < 0.0001 Slope 0.53 0.46 в‰ 0 8 1.15 0.2825 Which of the following values is closest to the actual weight, in pounds, of the backpack for the student who had 4 books in the backpack? (A) 8 (B) 10 (C) 13 (D) 15 (E) 17 33. A regional transportation authority is interested in estimating the mean number of minutes working adults in the region spend commuting to work on a typical day. A random sample of working adults will be selected from each of three strata: urban, suburban, and rural. Selected individuals will be asked the number of minutes they spend commuting to work on a typical day. Why is stratification used in this situation? (A) To remove bias when estimating the proportion of working adults living in urban, suburban, and rural areas (B) To remove bias when estimating the mean commuting time (C) To reduce bias when estimating the mean commuting time (D) To decrease the variability in estimates of the proportion of working adults living in urban, suburban, and rural areas (E) To decrease the variability in estimates of the mean commuting time 34. A randomized block design will be used in an experiment to compare two lotions that protect people from getting sunburned. Which of the following should guide the formation of the blocks? (A) Participants in the same block should receive the same lotion. (B) Participants should be randomly assigned to the blocks. (C) Participants should be kept blind as to which block they are in. (D) Participants within each block should be as similar as possible with respect to how easily they get sunburned. (E) Participants within each block should be as different as possible with respect to how easily they get sunburned. 35. A group of students wanted to investigate the claim that the average number of text messages sent yesterday by students in their school was greater than 100. They asked each student in a random sample of 50 students how many text messages he or she sent yesterday. An appropriate t-test was conducted and resulted in a p-value of 0.0853. Assuming the conditions for the t-test were met, which of the following is an appropriate conclusion? (A) Because p пЂј 0.10 , at the 10% significance level, it can be concluded that the mean number of text messages sent yesterday by students in the school is less than 100. (B) Because p пЂј 0.10 , at the 10% significance level, it cannot be concluded that the mean number of text messages sent yesterday by students in the school is greater than 100. (C) Because p пЂѕ 0.05 , at the 5% significance level, it can be concluded that the mean number of text messages sent yesterday by students in the school is greater than 100. (D) Because p пЂѕ 0.05 , at the 5% significance level, it can be concluded that the mean number of text messages sent yesterday by students in the school is less than 100. (E) Because p пЂѕ 0.05 , at the 5% significance level, it cannot be concluded that the mean number of text messages sent yesterday by students in the school is greater than 100. 36. Two college roommates have each committed to donating to charity each week for the next year. The roommates’ weekly incomes are independent of each other. Suppose the amount donated in a week by one roommate is approximately normal with mean $30 and standard deviation $10, and the amount donated in a week by the other roommate is approximately normal with mean $60 and standard deviation $20. Which of the following is closest to the expected number of weeks in a 52-week year that their combined donation will exceed $120? (A) 0; the combined donation never exceeds $120 in a week (B) 1 week (C) 3 weeks (D) 5 weeks (E) 8 weeks 37. A university will add fruit juice vending machines to its classroom buildings if the student body president is convinced that more than 20 percent of the students will use them. A random sample of n students will be selected and asked whether or not they would use the vending machines. A large-sample test for proportions at the significance level of пЃЎ пЂЅ 0.05 will be performed. The null hypothesis that the proportion of all students who would use the vending machines is 20 percent will be tested against the alternative that more than 20 percent of all students would use them. For which of the following situations would the power of the test be highest? (A) The sample size is n = 750, and 20 percent of all students use the vending machines. (B) The sample size is n = 750, and 25 percent of all students use the vending machines. (C) The sample size is n = 1,000, and 25 percent of all students use the vending machines. (D) The sample size is n = 500, and 50 percent of all students use the vending machines. (E) The sample size is n = 1,000, and 50 percent of all students use the vending machines. 38. Each of the faces of a fair six-sided number cube is numbered with one of the numbers 1 through 6, with a different number appearing on each face. Two such number cubes will be tossed, and the sum of the numbers appearing on the faces that land up will be recorded. What is the probability that the sum will be 4, given that the sum is less than or equal to 6? 2 3 3 2 4 (A) (B) (C) (D) (E) 36 36 15 9 6 39. A study compared the language skills and mental development of two groups of 24-month-old children. One group consisted of children identified as talkative, and the other group consisted of children identified as quiet. The scores for the two groups on a test that measured language skills are shown in the table below. Talkative 75 70 70 65 85 85 80 90 90 60 Quiet 80 75 65 70 90 90 75 85 75 80 Assuming that it is reasonable to regard the groups as simple random samples and that the other conditions for inference are met, what statistical test should be used to determine if there is a significant difference in the average test score of talkative and quiet children at the age of 24 months? (A) A chi-square goodness-of-fit test (B) A chi-square test of independence (C) A matched-pairs t-test for means (D) A two-sample t-test for means (E) A linear regression t-test 40. An experiment will be conducted to test the effectiveness of a weight-loss supplement. Volunteers will be randomly assigned to take either the supplement or a placebo for 90 days, with 12 volunteers in each group. The subjects will not know which treatment they receive. At the end of the experiment, researchers plan to calculate the mean weight loss for each of the two groups and to construct a two-sample t-confidence interval for the difference of the two treatment means. Which of the following assumptions is necessary for the confidence interval to be valid? (A) The sample size is greater than or equal to 10 percent of the population size. (B) Each of the two groups has at least 5 successes and at least 5 failures. (C) The distributions of weight loss of the two treatments are approximately normally distributed. (D) The volunteers in the supplement group are paired with volunteers in the placebo group. (E) The expected number of people who lose weight in each group is at least 5. 1. An environmental group conducted a study to determine whether crows in a certain region were ingesting food containing unhealthy levels of lead. A biologist classified lead levels greater than 6.0 parts per million (ppm) as unhealthy. The lead levels of a random sample of 23 crows in the region were measured and recorded. The data are shown in the stemplot below. Lead Levels 2 8 3 0 3 588 4 112 5 012234 5 99 6 34 6 68 Key: 2 | 8 = 2.8 ppm (a) What proportion of crows in the sample had lead levels that are classified by the biologist as unhealthy? (b) The mean lead level of the 23 crows in the sample was 4.90 ppm and the standard deviation was 1.12 ppm. Construct and interpret a 95 percent confidence interval for the mean lead level of crows in the region. 2. An administrator at a large university wants to conduct a survey to estimate the proportion of students who are satisfied with the appearance of the university buildings and grounds. The administrator is considering three methods of obtaining a sample of 500 students from the 70,000 students at the university. (a) Because of financial constraints, the first method the administrator is considering consists of taking a convenience sample to keep the expenses low. A very large number of students will attend the first football game of the season, and the first 500 students who enter the football stadium could be used as a sample. Why might such a sampling method be biased in producing an estimate of the proportion of students who are satisfied with the appearance of the buildings and grounds? (b) Because of the large number of students at the university, the second method the administrator is considering consists of using a computer with a random number generator to select a simple random sample of 500 students from a list of 70,000 student names. Describe how to implement such a method. (c) Because stratification can often provide a more precise estimate than a simple random sample, the third method the administrator is considering consists of selecting a stratified random sample of 500 students. The university has two campuses with male and female students at each campus. Under what circumstance(s) would stratification by campus provide a more precise estimate of the proportion of students who are satisfied with the appearance of the university buildings and grounds than stratification by gender? 3. Each full carton of Grade A eggs consists of 1 randomly selected empty cardboard container and 12 randomly selected eggs. The weights of such full cartons are approximately normally distributed with a mean of 840 grams and a standard deviation of 7.9 grams. (a) What is the probability that a randomly selected full carton of Grade A eggs will weigh more than 850 grams? (b) The weights of the empty cardboard containers have a mean of 20 grams and a standard deviation of 1.7 grams. It is reasonable to assume independence between the weights of the empty cardboard containers and the weights of the eggs. It is also reasonable to assume independence among the weights of the 12 eggs that are randomly selected for a full carton. Let the random variable X be the weight of a single randomly selected Grade A egg. i) What is the mean of X? ii) What is the standard deviation of X? 4. The Behavioral Risk Factor Surveillance System is an ongoing health survey system that tracks health conditions and risk behaviors in the United States. In one of their studies, a random sample of 8,866 adults answered the question “Do you consume five or more servings of fruits and vegetables per day?” The data are summarized by response and by age-group in the frequency table below. Age-Group (years) Yes No Total 18–34 231 741 972 35–54 669 2,242 2,911 55 or older 1,291 3,692 4,983 Total 2,191 6,675 8,866 Do the data provide convincing statistical evidence that there is an association between age-group and whether or not a person consumes five or more servings of fruits and vegetables per day for adults in the United States? 5. Psychologists interested in the relationship between meditation and health conducted a study with a random sample of 28 men who live in a large retirement community. Of the men in the sample, 11 reported that they participate in daily meditation and 17 reported that they do not participate in daily meditation. The researchers wanted to perform a hypothesis test of H 0 : pm пЂ pc пЂЅ 0 H a : pm пЂ pc пЂј 0 where pm is the proportion of men with high blood pressure among all the men in the retirement community who participate in daily meditation and pc is the proportion of men with high blood pressure among all the men in the retirement community who do not participate in daily meditation. (a) If the study were to provide significant evidence against H 0 in favor of H a , would it be reasonable for the psychologists to conclude that daily meditation causes a reduction in blood pressure for men in the retirement community? Explain why or why not. The psychologists found that of the 11 men in the study who participate in daily meditation, 0 had high blood pressure. Of the 17 men who do not participate in daily meditation, 8 had high blood pressure. (b) Let Л†pm represent the proportion of men with high blood pressure among those in a random sample of 11 who meditate daily, and let Л†pc represent the proportion of men with high blood pressure among those in a random sample of 17 who do not meditate daily. Why is it not reasonable to use a normal approximation for the sampling distribution of Л†pm пЂ Л†pc ? Although a normal approximation cannot be used, it is possible to simulate the distribution of Л†pm пЂ Л†pc . Under the assumption that the null hypothesis is true, 10,000 values of Л†pm пЂ Л†pc were simulated. The histogram below shows the results of the simulation. (c) Based on the results of the simulation, what can be concluded about the relationship between blood pressure and meditation among men in the retirement community? 6. Tropical storms in the Pacific Ocean with sustained winds that exceed 74 miles per hour are called typhoons. Graph A below displays the number of recorded typhoons in two regions of the Pacific Ocean—the Eastern Pacific and the Western Pacific—for the years from 1997 to 2010. (a) Compare the distributions of yearly frequencies of typhoons for the two regions of the Pacific Ocean for the years from 1997 to 2010. (b) For each region, describe how the yearly frequencies changed over the time period from 1997 to 2010. A moving average for data collected at regular time increments is the average of data values for two or more consecutive increments. The 4-year moving averages for the typhoon data are provided in the table below. For example, the Eastern Pacific 4-year moving average for 2000 is the average of 22, 16, 15, and 21, which is equal to 18.50. Year Number of Eastern Pacific Number of Western Pacific Typhoons in the 4-year moving Typhoons in the 4-year moving Eastern Pacific average Western Pacific average 1997 22 33 1998 16 27 1999 15 36 2000 21 18.50 37 33.25 2001 19 17.75 37 34.25 2002 19 18.50 39 37.25 2003 17 19.00 30 35.75 2004 17 18.00 34 35.00 2005 17 17.50 26 32.25 2006 25 19.00 34 31.00 2007 19 19.50 28 30.50 2008 20 20.25 27 28.75 2009 23 21.75 28 29.25 2010 18 20.00 18 (c) Show how to calculate the 4-year moving average for the year 2010 in the Western Pacific. Write your value in the appropriate place in the table. (d) Graph B below shows both yearly frequencies (connected by dashed lines) and the respective 4-year moving averages (connected by solid lines). Use your answer in part (c) to complete the graph. (e) Consider graph B. i) What information is more apparent from the plots of the 4-year moving averages than from the plots of the yearly frequencies of typhoons? ii) What information is less apparent from the plots of the 4-year moving averages than from the plots of the yearly frequencies of typhoons?
© Copyright 2026 Paperzz