Title
Table of Contents
How to Keep a Lab Notebook
How to Write a Lab Report
How to Write an Abstract
Probability and Mathematical
Formulas in Genetics
Lab One: The Central Dogma
of Molecular Biology
Lab Two: Genetics of Maize
How to Use Chi Square
Analysis
X-linked Traits
Mapping Linked Genes
Three Point Cross
Lab
Three:
Genetic
Experiments with Drosophila
Lab Four: Analysis of Variable
Phenotypes
in
Drosophila
mutants
Lab
Five:
Chromosomal
Structure in Wild Type and
Abnormal Cells
Lab Six: GMO Investigator
Page Pages to read in your text
before coming to lab, fair
game for QUIZ
1
None
2
None
4
None
6
None
7
Chapter 3
12
Chapter 1 & 2
17
21
Chapter 2 & 3
Chapter 3
22
23
27
30
Chapter 2 & 4
Chapter 5
Chapter 5
Chapter 2, 3 & 5
50
Chapter 4 & 7, & Bar Eye
Fly PP in Lab Exercises
Section of BB
Chapter 2 & 8
57
PDF online, Chapter 10 &
11, p554-557
PDFs online, Chapter 6 &
16
PDF online, p 546-548, 559560,
Lab Seven: pGLO Project
Lab
Eight:
Mapping
Restriction
1
How to Keep a Lab Notebook
You are keeping a lab notebook so that you:
1. can refer back to your experiments at a later date, if you want to use the procedure in another
context.
2. will learn to keep detailed, clear written notes that others can understand and use (such as for
a research or medical position) for a career in the future.
Make sure all writing is clear and all objectives, procedures, results and discussion can be
read and understood by someone who is not taking this class.
Table of Contents - Save several pages at the beginning of the notebook for the TOC and update
it weekly with the title of each experiment, a date, and a page number. Number all notebook
pages now.
For Each Lab Experiment:
1. Title of Each Experiment - Be concise but descriptive.
2. Date and Page Number – Number all pages before you begin, include the year.
3. Objectives - In two or three sentences summarize the scientific purpose(s) of the exercise.
Do not copy the objectives stated in your manual.
4. Hypotheses - Concisely state any hypotheses you have before beginning the lab. This is
different and separate from the objectives.
5. Pre-lab Notes - Notes taken in lab about the experiments and any background introduction
about the labs. The section may be optional.
6. Material & Methods - Include here all experimental procedures followed and any
calculations done in reference to the methods.
7. Data/Results - All data generated should be recorded during the lab. Include all tables,
graphs, formulas, calculations, and photographs. Summarize in a short (one or two
sentences) narrative the data obtained.
8. Questions - If there are any associated questions with the lab exercise, they should be
answered in this section.
9. Discussion/Conclusions - What did you do? Why did you do this (e.g. Why did the
instructor think it was so important to do this lab)? What did you learn? How did doing the
lab help you learn this? Describe the next experiment you would do to study this topic?
What questions do you still have about this topic?
2
If an experiment will take several weeks, skip pages in the notebook to keep the experimental
write-up in the notebook together. Your notebook will not be graded down if there are empty
pages in it, but will be graded down for poor organization.
All procedures must be described in detail so that another investigator can follow them at a
later time. Write the notebook in such a way that you could come back in two years and be
able to repeat the experiments and answer the questions again.
It is important that you keep a timely and accurate notebook of your activities in the laboratory.
Use the following guidelines for record keeping:
1. Be honest and concise; keep the record factual; do not editorialize.
2. Before starting an investigation/procedure summarize the scientific purpose of the exercise
and any hypotheses you have in two or three sentences.
3. Before starting an investigation/procedure summarize the protocols to be used and reference
the location of the complete protocol.
4. Enter data as it is collected (do not rely on loose sheets or memory for making entries at a
later time).
5. Date each entry and initial each page as it is completed.
6. Do not erase. If an erroneous entry is made, mark it as such, initial it, and then make the
correct entry.
7. Attach support records (photographs, instrument printouts, etc.).
8. Label all tables and graphs to indicate what they represent.
9. Choose scales for graph axes that are easy to work with (i.e. 1, 2, 3; not 1.2, 2.4, 3.6, etc.).
10. Show all calculations (such as solutions made or chi-square analysis).
11. All data generated should be recorded during the exercise. Include any tables, graphs,
formulas, calculations, and photographs. Summarize in a short (one or two sentences)
narrative the data obtained.
12. At the conclusion of each major part of an investigation (and at the conclusion of the entire
investigation) outline your interpretations and conclusions about the data obtained. Also
make any suggestions for modifications and/or improvements to the process as well as for
resolving any problems that may have arisen during the investigation.
13. In this course, you are not being graded on results. Therefore, an accurate representation of
those results with an intelligent explanation of them is far more important than that you
obtained any specifically desired outcome.
3
How to Write a Lab Report
Communication in the sciences is critical, and the most prevalent way of communicating results
is via the scientific research paper published in a scientific journal. You will follow standard
format outlined below to write your lab reports. Your lab report should be able to be read by
another biology student who has not done the study, and it should be clear to him or her as
to what was done, why it was done, how it was done, and what the results are. They should
be able to take your report and repeat your experiments and your calculations without any
further information.
1. TITLE AND AUTHORS - This includes the title that indicates what the study is about and
the names of all of the report authors.
2. ABSTRACT - The results should be summarized. Background is stated in one or two
sentences. There is a clear statement of the questions addressed. Methods are summarized
(no more than three or four sentences). The major findings are reported briefly. A
concluding statement is made that relates to the statement of the questions asked. It is
written as a single paragraph of no more than 250 words. See next section for more.
3. INTRODUCTION - This includes background leading to experiments and a logical
argument showing how these questions are addressed. All statements of fact and opinion that
are not your own are supported by a reference to the source. The introduction should give
important information that is necessary for a lay scientist to understand your lab report. The
introduction should contain bibliographic references. This is usually two to four pages long.
4. MATERIALS & METHODS - The description (in paragraph form) of the methods contains
a brief, concise narrative of important details and does not contain extraneous, unimportant
details. These are presented in enough detail that another scientist could pick up your
paper and repeat your experimental protocol. The design of the study (or experiment) is
clear and complete. The rationale for each step is self-evident or clearly indicated. Each
factor mentioned is likely to have influenced the outcome of the study (if it does not
influence the outcome do not mention it). All factors that are likely to have influenced the
outcome of the study are mentioned. When the same procedure is used several times, the
procedure need only be summarized one time. Subsequently, just refer to that procedure and
indicate any modifications made to it. Also include a brief description of how the data is
analyzed (calculations made, statistical analyses, etc.). This is one to five pages long.
5. RESULTS - This includes a narrative describing what happened as well as all pertinent
tables, figures, photographs, gels, etc. All general statements are supported with reference to
the data. Major results are explained in the text, with supporting tables, graphs, and/or
figures also included. Implications of the results are not discussed. Data are presented in
either tabular or graphical form but not both. Each figure or table makes an important and
unique contribution to the report. Each figure or table has an informative caption or legend.
Each figure or table is self-sufficient; readers can tell what question is being asked, major
aspects of how the question was addressed, and what the most important results are without
having to refer to the rest of the paper. The sample size and number of samples are clearly
indicated in the graph, table, caption, or legend. All calculations are shown in the text (for
example statistical analysis of the data) and are explained fully. This is usually three to five
pages long.
4
6. DISCUSSION - What does it mean? Are the hypotheses supported? Why did it happen?
What (if any) problems occurred? How were those problems resolved? The data obtained
are clearly related to the expectations raised in the introduction and to the question(s) asked
and/or hypotheses tested. Facts are clearly distinguished from speculation and/or opinion.
Unusual, or unexpected, findings are discussed logically, based on biology rather than
apology. All statements of fact and/or opinion that are not your own are referenced as to the
source. Your own opinions are based on the results and are referenced by an example from
those results. A discussion of future directions, additional questions to be addressed, and
ways in which the study could be modified are included. This section does not include how
you felt about doing the experiment or a personal note to the instructor. This section
may also contain bibliographic references. This is usually two to five pages long.
7. RESULTS/DISCUSSION COMBINED (PREFFERED METHOD FOR GENETICS LAB)Alternatively, you may combine results and discussion. The results description is the same
as 5 and then the discussion in 6 is truncated focusing on each experiment and answering
these questions: What does it mean? Are the hypotheses supported? Why did it happen?
What (if any) problems occurred? How were those problems resolved? The data obtained
are clearly related to the expectations raised in the introduction and to the question(s) asked
and/or hypotheses tested. Then you usually wrap up with a future direction paragraph. This
is usually three to six pages long.
8. LITERATURE CITED - Citations are provided for every reference in the body of the
report. Citations are in the correct format according to the type of reference material. No
references are included that are not cited in the body of the report. This is usually one page
long. When you take a piece of data or an idea from another, you need to give them credit.
This is done by placing a note in the text that you received that information from another and
then you cite the whole reference at the end. When you cite material, you paraphrase what
they said. Do not use their exact words. This is plagiarism. If you are not sure how to cite
references, see your instructor!
More information:
1. TABLES & FIGURES - Each table should have a title and footnotes that explain any
information that is not self-explanatory. Figures should have a legend that clearly identifies
what each part of the figure represents.
2. CALCULATIONS - Each calculation is fully explained as to why it is needed and what the
results mean.
3. INDIVIDUAL ASSIGNMENTS AND HOMEWORK - are to be done by the individual
alone. Thoughts and ideas may be shared between people within groups and among the
class, but all written work will be done individually with no sharing of quotations, sentences,
mathematical problems, or sections of the report.
4. PLAGARISM AND CHEATING - will result in the student or group getting a zero for the
assignment and a failing grade for the class.
Also see the External links in Blackboard.
5
How to Write an Abstract
Generally, the abstract is a brief description of what you did and what you found. Like a paper
(or lab report), an abstract should contain an introduction, methods, results, and conclusion (see
below). You may also include a sentence or two about why you did whatever you did as well, if
you feel it is important. The abstract must not be a summary of your thought processes for
writing the report. Do not write “the experiment was completed, the data was analyzed, and
conclusions were drawn.” Every scientific paper has an abstract at the beginning to let the reader
know what the paper is about and to make an informed decision whether the entire paper is
worth reading. Abstracts also are printed on the internet, such as in PubMed, where the whole
article does not appear, and are used to decide which articles you need to read. A third use of
abstracts is to summarize the work you will be presenting at a meeting, so people will know if
they should come to see your complete presentation. Since a potential reader may have to sift
through a lot of abstracts, the relevance and quality of your work may be judged on the basis of
your abstract alone. Therefore, the abstract must stand on its own.
The abstract of a paper should be written last, after you have drawn all of your conclusions. It
should be clear, concise, and should hold all of your major conclusions as well as the general
methods of your study. Remember, in science, the abstract of a paper is usually all your
colleagues will read.
1. What is the general topic you were investigating and why is it important? One to two
sentences.
2. What are the specific questions you are addressing with this project? The Abstract should not
include your complete methods. Provide a one or two sentence overview.
3. How did you do this experiment? For a single paragraph abstract, one or two sentences are
needed. You are not trying to be complete, just give a general idea of how you did it.
4. What did you observe? One to three sentences should be enough: state only your main
point(s).
5. What were your conclusions? This can be between one to three sentences.
With the method outlined above, you should be able to produce a good abstract in less than an
hour. If you haven't clearly and carefully thought through what you did in the experiment,
writing the abstract should help you do so.
Also see the External links in Blackboard.
6
Probability and Mathematical Formulas in Genetics
(P) Probability = number of times an event occurs
total number of events
OR
P = number of offspring with a given phenotype
total number of offspring
In the cross Tt X Tt
T
t
T
TT
Tt
t
Tt
tt
We expect 1 TT: 2Tt: 1 tt, where T is tall and t is dwarf.
1. What is the probability of a dwarf plant?
P = 1 dwarf/4 total = 1/4 dwarf or 25%
2. What is the probability of a tall plant?
P = 3 tall/4 total = 3/4 or 75%
3. What is the probability of a heterozygous plant?
P = 2 heterozygous/4 total = 1/2 or 50%
The sum rule states to add probabilities when you are looking for two mutually exclusive
events.
1. What is the probability of either a homozygous tall or a heterozygous tall in the above cross?
P = 1/4 + 2/4 = 3/4 or 75% chance of tall
2. What is the probability of either a homozygous tall or a dwarf in the same cross?
P = 1/4 + 1/4 = 1/2 or 50%
3. What is the probability of either a homozygous recessive or a heterozygote in the same
cross?
P = 1/4 + 1/2 = 3/4 or 75%
When looking for the probability of a particular order of events or offspring, use the product
rule, multiplying the probabilities of each individual event.
1. What is the probability that the first three seedlings in the above cross will all be dwarf?
P = 1/4 X 1/4 X 1/4 = 1/64 or 1.6%
2. What is the probability that in the first 4 seedlings we will have a tall then a dwarf than a tall
then a dwarf?
P = 3/4 X 1/4 X 3/4 X 1/4 = 9/256 = 3.5%
7
Use the binomial expansion when looking for the probability of unordered events.
P=
n!
px q n-x
x! (n-x)!
n = the total number of events
x = the number of events in one category
p = the individual probability of x
q = the individual probability of the other category
1. What is the probability that in the above cross in 8 seedlings, we will have 3 dwarf (and 5
tall)?
n=8
x=3
p = 1/4
q = 3/4
P = 1 X 2 X 3 X 4 X 5 X 6 X 7 X 8 (1/4)3 (3/4)8-3 =
(1 X 2 X 3) {(8-3)!}
40320 (1/64) (243/1024)
= 149.50 = 0.208 = 20.8%
6 X (1 X 2 X 3 X 4 X 5)
720
2. What is the probability that in the above cross we would get 4 tall plants out of 5 seedlings?
n=5
x=4
p = 3/4
q = 1/4
P = 1 X 2 X 3 X 4 X 5 (3/4)4 (1/4) 5-4 =
1 X 2 X 3 X 4 X {(5 – 4)!}
120 X (81/256) (1/4) = 9.49 = 0.3955 = 40%
24 X (1!)
24
Use chi-square analysis to test the validity of a genetic hypothesis.
Formulate a hypothesis about your data (linked or unlinked genes, inheritance pattern). Then use
your experimental data to determine if the hypothesis is accepted or rejected.
П‡2 = ОЈ (O - E)2
E
O = observed results
E = expected results based upon your hypothesis
ОЈ means to sum the calculations in each category. If there were four
categories, then the formula would be worked out as:
χ2 = (O1 – E1)2 + (O2 – E2)2 +
E1
E2
(O3 – E3)2 + (O4 – E4)2
E3
E4
Then determine the degrees of freedom, which are n – 1 (n = categories or phenotypes). Here it
would be 3 (4 -1 = 3).
8
1. A true breeding tall plant with white flowers is crossed to a dwarf plant with purple flowers.
All of the F1 were tall with purple flowers. The F1 were selfed and the resulting 1000 F2 progeny
looked like the following:
tall, purple flowers
tall, white flowers
dwarf, purple flowers
dwarf, white flowers
568
187
185
60
In this case we expect a 9:3:3:1 ratio for unlinked genes or 9/16 tall, purple: 3/16 tall, white: 3/16
dwarf, purple: 1/16 dwarf, white. Where did I get this ratio? Our expected numbers are:
tall, purple 563 (9/16 X 1000)
tall, white 188 (3/16 X 1000)
dwarf, purple 187 (3/16 X 1000)
dwarf, white 62 (1/16 X 1000) use whole numbers for all
χ2 = (568 – 563)2 + (187 – 188)2 + (185 - 187)2 + (60 – 62)2 =
563
188
187
62
П‡2 = __25
563
+ 1 + _ 4 + _4 = 0.13
188 187 62
df = 3. P is smaller than the critical value, see p. 19. This is within our expected range and so
we accept our hypothesis that the two genes are unlinked.
2. If we have two Manx cats that are heterozygous (Tt) for the dominant tailless trait, and we
cross them, we get this result. In four litters, we obtained:
tailless
tailed
19
13
Our hypothesis is that this trait follows simple Mendelian inheritance. We expect a 1TT: 2Tt: 1tt
result. Where did I get this ratio?
Our expected numbers are :
tailless
tailed
24
8
χ2 = (19 - 24)2 + (13 – 8)2 = 25 + 25 = 4.166 and df = 1
24
8
24 8
Our chi-square value is larger than the critical value, so we must reject our hypothesis. The
inheritance of this trait does not follow simple Mendelian inheritance. Upon further
characterization of these kitties, it is revealed that the homozygous dominant TT is lethal in the
embryo stage. So, our Punnett Square would give us 2/3 tailless and 1/3 tailed when figuring the
9
embryonic lethality of the TT genotype.
denominator.
So our revised expected numbers are:
Throw out the TT offspring and use 3 as the
tailless
tailed
21
11
χ2 = (19 –21)2 + (13 – 11)2 = 4 + 4 = 0.55 and df =1
21
11
21 11
This chi-square value falls within P = 0.5 and P = 0.2, so we will accept our hypothesis of
homozygous dominant embryonic lethal.
A few points about probability (modified from Laurie Caslake, Ph.D.)
Probability is the number of times an event happens divided by the total number of times it could
have happened. Probability is also explained in your book.
Sum Rule: The combined probability of two (or more) mutually exclusive events occurring is
the sum of their individual probabilities.
�Or’ statements indicate the need to add: the probability of a black or brown colt
= P(black colt) “or” P(brown colt)
= P(black colt) + P(brown colt)
�At Least’ statements indicate the need to add: the probability of at least three out of five
= P(3 out of 5) “or” P(4 out of 5) “or” P(5 out of 5)
= P(3 out of 5) + P(4 out of 5) + P(5 out of 5)
Product Rule: The probability of the order of independent events can be determined using the
product rule.
Statements that indicate the probability of independent events occurring in a certain order
indicate the need to multiply: the probability of first a black colt, then a brown colt, then a
black colt will be born
= P(black colt) then P(brown colt) then P(black colt)
= P(black colt) x P(brown colt) x P(black colt)
Product Rule: The joint probability of both of two independent events occurring is the product
of their individual probabilities.
�And’ statements indicate the need to multiply: the probability of a black, female colt
= P(black colt) “and” P(female colt)
= P(black colt) x P(female colt)
10
Binomial Expansion: The probability of an unordered combination of events can be determined
using binomial expansion.
Statements using wording like “the probability of three out of seven” having one trait
indicate the need to use the binomial expansion: if two heterozygous individuals have eight
children, what is the probability of exactly two being homozygous recessive?
In this case, n = the total number of events = 8
p= the probability of one kind of event (or x) = 0.25 or 1/4 (homozygous recessive)
q= the probability of the alternative = 0.75 or 3/4 (not homozygous recessive)
x= events of the first type (homozygous recessive) = 2
P =
n!
(p)x (q)n-x
x! (n - x)!
Practice Problem:
This problem will not be graded and is not a part of your notebook. It’s for more practice
if you need it. Also perform the problems at the end of the chapters.
You cross a true-breeding pea plant with red flowers to a true-breeding pea plant with white
flowers. All of your offspring have red flowers. Which gene is dominant? Why? What is the
genotype of your offspring?
You then cross the offspring to each other. What ratio do you expect? Why?
You count 1000 plants and look at their flowers. Your results are as follows:
740 red
260 white
Does this follow a simple Mendelian inheritance pattern? Why or why not?
11
Lab One: Central Dogma of Molecular Biology
Objective: You will utilize models to understand the Central Dogma of Molecular Biology,
focusing on the functions of the DNA coding strand, using the codon table, and exploring how
proteins fold. You will also analyze the consequences of DNA mutations on the final gene
product.
Special thanks to Craig Kohn, Waterford, WI for the use of this lab (used with permission),
modified by PAM.
The function of a protein is determined by its shape, and the shape of the protein is determined
by its amino acids. Because proteins are smaller than microscopic, we would have a pretty hard
time doing a hands-on lab on this topic. However, we can explore proteins in an indirect way
through modeling.
Many things in science are explored with models – the scientific method itself is about modeling
complex ideas into simpler formats so that we can better understand them. Scientific models
may also help us to do things that would otherwise be impossible. For example, there is no way
that we could have sequenced the 6 billion bases in the human genome without prior experience
with simpler organisms like nematodes with genomes smaller than our own.
A model is a substitute for the actual thing we are studying, but it is also similar to what it
represents. It tends to follow the same rules as the actual object, and it provides us with a
simpler idea of a more complex process so that we can better understand it.
In this case, you will be using pipe cleaners, beads, and cut up straws to model how proteins fold,
and how mutations affect the shape of proteins. Each group should make at least one normal
and one mutated protein.
There are 3 basic laws of protein folding:
1. Hydrophobicity – hydrophobic (water hating) amino acids will always try to get to the
inside of a protein.
a. Because our bodies are mostly water, hydrophobic amino acids basically try to
�hide’ in this kind of environment; hence proteins generally have a hydrophobic
core with the hydrophobic residues buried in the protein.
b. On the other hand, hydrophilic (water loving) amino acids need to be exposed to
an aequous environment. Hydrophilic amino acids will try to move as far away
from the center of the protein as they can.
2.
Charge – amino acids can have one of three charges – positive, negative, or neutral.
a. Like opposite sides of a magnet, positively and negatively charged amino acids
try to move toward each other,
b. Like the same pole of a magnet, amino acids with similar charges (positive and
positive, or negative and negative) will try to move as far apart from each other as
they can.
c. Neutral amino acids remain largely unaffected.
12
3. Cysteine Bonds Cysteine amino acid pairs will move toward each other and form
disulfide bonds whenever they can.
To model amino acids in a protein, we will use colored beads. Read the hints and tips
below before getting started.
1. Hydrophobicity – yellow beads will represent hydrophobic amino acids; orange beads
will represent hydrophilic amino acids. As such, all yellow beads should be as far inside
the protein as they can, and purple beads should be on the outside whenever possible.
2. Charge – blue beads will be a positive charge and pink beads will be the negatively
charged amino acids (for your model, neutral amino acids will not be used). Red and
blue beads should be near each other (if they can); conversely, blues should be as far
apart as possible (and similarly for reds).
3. Cysteine bonds – we’ll use green to represent the amino acids cysteine; green beads
should form pairs whenever they can.
4. Some amino acids may have multiple beads! For example, Arginine is both positively
charged (blue) and hydrophilic (yellow). As such, you would use both a blue and yellow
bead together to represent this amino acid.
Amino Acid
Alanine
Arginine
Asparagine
Aspartic acid
Cysteine
Glutamine
Glutamic acid
Glycine
Histidine
Isoleucine
Leucine
Lysine
Methionine
Phenylalanine
Proline
Serine
Threonine
Tryptophan
Tyrosine
Valine
Code
Ala
Arg
Asn
Asp
Cys
Glu
Gln
Gly
His
Ile
Leu
Lys
Met
Phe
Pro
Ser
Thr
Trp
Tyr
Val
A
R
N
D
C
Q
E
G
H
I
L
K
M
F
P
S
T
W
Y
V
Charge
Neutral
Positive
Neutral
Negative
Neutral
Positive
Negative
Neutral
Positive
Neutral
Neutral
Positive
Neutral
Neutral
Neutral
Neutral
Neutral
Neutral
Neutral
Neutral
Hydrophobicity
Hydrophobic
Hydrophilic
Hydrophilic
Hydrophilic
Hydrophilic
Hydrophilic
Hydrophilic
Hydrophobic
Hydrophilic
Hydrophobic
Hydrophobic
Hydrophilic
Hydrophobic
Hydrophobic
Hydrophobic
Hydrophilic
Hydrophilic
Hydrophobic
Hydrophobic
Hydrophobic
13
5. Be sure to have a cut up straw in between each amino acid so that you know where one
ends and the next begins! You may need multiple pipe cleaners to fit all of your amino
acids!
6. You will begin by creating the mRNA strand (transcription) corresponding to the gene
shown in the box below. Remember that for every…
a. G in DNA you would add a C in mRNA
b. C in DNA you would add a G in mRNA
c. T in DNA you would add a A in mRNA
d. A in DNA you would add a U in mRNA
e. 5’ in the DNA template strand, you would add a 3’ in mRNA, and vice versa
7. From your mRNA strand, you will need to create codons; remember that a codon is a
group of 3 bases that codes for a specific amino acid. Your codons are read in the 5’ →
3’ direction, and the frame is determined by the start codon.
8. 8. You will then need to use your codons to determine the amino acid sequence (in the
5’ → 3’ direction) of your polypeptide (translation).
9. Once you have your order of amino acids, you will need to find your respective beads
and assemble them onto a pipe cleaner. Again, be sure to separate each bead by a cut up
straw! (TERM (STOP) is not an amino acid but a command; it will not have a bead).
10. Finally, you will need to fold your protein. Start by moving your purple to the outside
and your yellow to the inside. Then connect your opposite charges and cysteine amino
acids (wrap them around each other using the pipe cleaner). Your finished protein should
have an �outer shell’ of hydrophilic and charged amino acids with an inner center of
hydrophobic amino acids.
11. When you are done, you will also have to create a second & third protein from the same
gene after it has been mutated.
DNA Template Strand:
3’TACTTACGATGGTACACGCAATCTATACTCAAATATAGGACCTTGACGTCGAATCT
CCACTGTACCTTGAACCTGACT5’
What is the mRNA strand (written in codons, i.e. 3 X 3)?
5’-AUG-AAU- ???
What is the DNA coding strand sequence? How does it relate to the mRNA sequence and to the
template sequence?
What is the Amino Acid sequence of the polypeptide? Don’t forget NH2 and COOH.
14
Once you have finished your protein, compare yours with other groups’ proteins. They should
look similar. Take a picture of your protein with your phone/tablet/etc. You will need to paste
in a picture (black and white is fine) of your protein into your notebook.
DNA Template Strand:
3’TACTTACGATGGTACACGCAATCTATACTCAAATATAGGACCTTGACGTCGAATCT
CCACTGTACCTTGAACCTGACT5’
Now create a second, mutated version of your gene by either adding or deleting a base. Write
your mutated gene, mRNA, and amino acid sequence below. Then create your mutated protein.
What is the template strand of your mutated DNA?
What is the sequence of your mutated mRNA transcript? What is the coding strand sequence of
your mutated DNA?
What is the amino acid sequence of your mutated protein?
15
Now perform the same translation and folding with the new polypeptide. Take a picture of this
mutated protein and place a copy in the notebook.
Finally, you will change one nucleotide in the sequence and perform the same actions. This
change must result in a missense mutation.
In your notebook you will have template strands, 3 coding strands, 3 mRNA sequences, 3
amino acid sequences, and 3 pictures of folded polypeptides.
Now inspect one other group’s frameshift and missense mutation polypeptides. What were
their amino acid sequences? COMPARE AND CONTRAST your mutants with theirs.
You are encouraged to use images (i.e. pictures) to do this analysis. Why are your
polypeptides similar or different in structure?
Questions to be answered in your notebook:
1. Scientists often refer to a polypeptide or protein as a “gene product”. Why do you think this
is the case?
2. How did each mutation change the structure of your polypeptide? What amino acid/acids
changed and how did the resulting polypeptide change?
3. What are mutations “good” for?
4. How do mutations occur naturally?
5. What is an allele?
6. How do mutations and alleles relate in a genetic sense?
7. How does protein folding affect protein function?
8. How does amino acid sequence affect protein function?
9. How does amino acid sequence (primary sequence) dictate 3D protein structure?
10. Can a single nucleotide change lead to a null (nonfunctional) mutant?
11. How can a single nucleotide change in a coding strand lead to no change in the protein
structure or function?
12. Why are there two methionines in your original polypeptide?
13. What type of bond do cystines form? Draw this bond.
14. What happens when you fry an egg?
16
Lab Two: Genetics of Maize
Objectives:
1. Through this laboratory exercise, you will become comfortable testing genetic questions with
progeny analysis.
2. You will be able to propose hypotheses.
3. You will be able to test your hypotheses with chi-square analysis.
4. You will become familiar with the implications of epistasis.
Genetic experiments typically span several generations of the organism, which, in the case of
maize, would take several years to carry out. In this lab you will be analyzing the results of
crosses designed to study the inheritance of several genes that influence kernel color and
morphology. You will be receiving the progeny ears of crosses that have been ongoing for
several generations.
Methods:
You will have to analyze ears of corn for number and phenotype of progeny.
1. Count the number and type of kernels for each cross. When you count ears of corn, close
your eyes and turn the ear of corn over in your hand, choose a row of kernels with your
thumb, and open your eyes. Count the number of each type of kernels in this row. Now
count the number of seeds of each type in the adjacent four rows (two on each side of the
chosen row) and tabulate the entire five rows. This will ensure enough kernels are counted
for statistical analysis. DO NOT WRITE ON THE EARS OF CORN!
2. Propose a hypothesis based upon the information given in this lab exercise (below and on the
next page). This is a proposed ratio of offspring with genotype and phenotype based upon a
Punnett Square you perform.
3. Use Chi-square analysis to accept or reject your hypothesis.
The phenotype of maize kernels is governed by many different loci. You will be studying the
inheritance of several in this exercise:
R = color in aleurone
rr = no color in aleurone but can see color in endosperm
Su = starchy {smooth looking} (dominant)
susu = sweet {shriveled} (recessive)
C'= color inhibitor (dominant over C) in aleurone
C = required for color production in the aleurone (dominant)
cc = no color production in the aleurone (recessive)
Y = yellow color in endosperm
yy = white endosperm
17
Epistasis is the interaction between two or more genes to control a single phenotype. If two
genes are involved in a specific pathway and functional products from both are required for
expression, then one recessive allele in either allelic pair will give the mutant phenotype. For
example, in plants:
Gene
Precursor
C
Г пѓ Intermediate
P
Г пѓ Anthocyanin (pigment)
If a pure line pea plant with colored flowers (genotype = CCPP) is crossed to pure line,
homozygous recessive pea plant with white flowers, the F1 plant will have colored flowers and a
CcPp genotype. The normal ratio from selfing this dihybrid is 9:3:3:1, but epistatic interactions
of the C and P genes will give a modified 9:7 ratio. The following table describes the
interactions for each genotype and how the ratio occurs. See the part on epistasis in your book.
Genotype
9 C_P_
3 C_pp
3 ccP_
1 ccpp
Flower Color
flowers colored;
anthocyanin produced
flowers white;
no anthocyanin produced
flowers white;
no anthocyanin produced
flowers white;
no anthocyanin produced
Enzyme Activities
functional enzymes from both genes
p enzyme nonfunctional
c enzyme nonfunctional
c and p enzymes nonfunctional
Monohybrid Cross
Box 1&2. A true-breeding colored aleurone (the outer layer of endosperm), in this case purple,
maize line was crossed to a true-breeding yellow aleurone maize line. The resulting ears
contained kernels with only colored aleurone. The gene governing this inheritance pattern has
been named R. R is colored and r is not colored (yellow). The F1 colored kernels were grown
and the plants were crossed to each other. You have been given the results of this cross. What is
your proposed phenotypic and genotypic ratio for the offspring (kernels) of this cross? Perform
a Chi-square to prove or disprove this ratio.
Box 10. A true-breeding colored aleurone (the outer layer of endosperm), in this case purple,
maize line was crossed to a true-breeding yellow aleurone maize line. The resulting ears
contained kernels with only colored aleurone. The gene governing this inheritance pattern has
been named R. R is colored and r is not colored (yellow). The F1 colored kernels were grown
and the plants were test-crossed (crossed to a homozygous recessive plant, which thus has yellow
aleurone). You have been given the results of this cross. What is your proposed phenotypic and
genotypic ratio for the offspring (kernels) of this cross? Perform a Chi-square to prove or
disprove this ratio.
18
Dihybrid Crosses
Box 3&4. Many different genes influence the appearance of the mature dry kernel of maize.
Ears of corn containing plump kernels are controlled by a gene called sugary, Su. The Su gene
codes for an enzyme known as starch debranching enzyme. When this gene is in the
homozygous recessive condition, less sugars are polymerized into starch resulting in sweeter
tasting corn. In addition, this low starch kernel loses more moisture during the drying period and
therefore shrivels more than the high starch kernel produced when a dominant allele of Su is
present. A true-breeding colored aleurone, starchy endosperm maize line was crossed to a truebreeding yellow aleurone, sugary endosperm maize line. The resulting ears contained kernels
with only colored aleurone and starchy endosperm. The F1 kernels were grown and the plants
were crossed to each other. You have been given the results of this cross. What is your proposed
phenotypic and genotypic ratio for the offspring (kernels) of this cross? Perform a Chi-square to
prove or disprove this ratio.
Box 5. A true-breeding colored aleurone, starchy endosperm maize line was crossed to a truebreeding yellow aleurone, sugary endosperm maize line. The resulting ears contained kernels
with only colored aleurone and starchy endosperm. The F1 kernels were grown and the plants
were test-crossed (that is bred to a true-breeding plant with yellow aleurone and sugary
endosperm). You have been given the results of this cross. What is your proposed phenotypic
and genotypic ratio for the offspring (kernels) of this cross? Perform a Chi-square to prove or
disprove this ratio.
Box 6. The C gene comes in multiple alleles. C is colored and allows the aleurone to be colored
in the kernels (if the R allele is in the genotype). The c allele is uncolored and does not allow the
aleurone to have a color (even in the presence of the R allele), so the color of the endosperm
shows through (yellow or white). The C' allele is a color inhibitor that also inhibits the color of
the aleurone (even in the presence of the R allele). C' is dominant over C. C is dominant over c.
A true-breeding strain with the color inhibitor (yellow) and with starchy kernels was crossed to a
true breeding strain colored (purple) strain with sweet kernels. The F1 were yellow and starchy.
They were selfed (crossed to themselves) and you have been given the results of this cross. What
is your proposed phenotypic and genotypic ratio for the offspring (kernels) of this cross?
Perform a Chi-square to prove or disprove this ratio.
Box 7. The endosperm of maize can either be yellow or white. This endosperm color is
governed by a gene with two alleles, Y has yellow endosperm and y has white endosperm.
However, this endosperm color is masked when the aleurone is colored purple. A true-breeding
maize line with the color inhibitor and yellow endosperm (C'C'YY) (so they were yellow) was
crossed to a true-breeding line with purple aleurone (and white endosperm)(CCyy). The F1 were
crossed and you have been given the results of this cross. What is your proposed phenotypic and
genotypic ratio for the offspring (kernels) of this cross? Perform a Chi-square to prove or
disprove this ratio.
19
Box 8. A true-breeding maize line with the color inhibitor gene and the gene for colored
aleurone (C'C'RR), which thus had uncolored aleurone and yellow endosperm, was crossed to a
true-breeding strain with the color gene, which was recessive for the r allele (CCrr) so the
aleurone of this strain was also uncolored allowing the yellow endosperm to show through. The
F1 had yellow kernels as well. These were selfed and you have the results of this cross. What is
your proposed phenotypic and genotypic ratio for the offspring (kernels) of this cross? Perform
a Chi-square to prove or disprove this ratio.
Box 9. A true-breeding maize line with the genotype CCrr, which thus had yellow endosperm,
was crossed to a true-breeding strain with the genotype ccRR, also having yellow kernels. The
F1 had colored kernels. These were selfed and you have the results of this cross. What is your
proposed phenotypic and genotypic ratio for the offspring (kernels) of this cross? Perform a Chisquare to prove or disprove this ratio.
20
How to Use Chi-Square Analysis
With chi-square analysis as applied to genetic problems, the only hypotheses you can test are as
follows:
1. Testing “goodness of fit.”
The ratio of offspring will follow simple Mendelian inheritance rules, such as the results of
the cross Tt X Tt will yield 1 TT: 2 Tt: 1 tt.
2. Testing gene linkage.
If two genes are being studied, then we will always hypothesize that the genes are NOT
linked.
Use the following steps to test your hypothesis:
1. State the hypothesis in detail, specifying the genotypes and phenotypes of the parents and
possible progeny by working out a Punnett Square for the cross.
2. Use the rules of probability to make explicit predictions about the types and proportions of
progeny that should be observed if the genetic hypothesis is true.
3. Convert the proportions to numbers of progeny. You do this by multiplying the proportions
by the total number of progeny.
4. Use the chi-square formula to determine a П‡2 for the data.
5. Determine degrees of freedom for your cross (n - 1).
6. Interpret whether the П‡2 value for the data allows you to accept or reject your hypothesis. If
your Chi square value is more than the table value, reject your hypothesis.
П‡2 TABLE
P=
0.05
df
1
3.841
2
5.991
3
7.815
4
9.488
df = degrees of freedom
P = probability
21
X-Linked Traits (modified from Laurie Caslake, Ph.D.)
For a X-linked (sex-linked) trait, when you do a Punnett Square, you will need to keep track of
the sex chromosome and the allele at the same time. Here’s an example:
A woman with normal vision (but a carrier for color blindness) marries a man with normal
vision. The cross: XBXb x XBY. What is the genotype of the parental generation and the
genotype and phenotype of the F1 generation?
there are three possible genotypes for females
XBXB = normal vision
XBXb = normal vision, carrier for color blindness
XbXb = color blind
F1 phenotype
1/4 female normal vision
1/4 female carrier
1/4 male normal vision
1/4 male color blind
and two for males
XBY = normal vision
XbY = color blind
genotype
XBXB
XBXb
XBY
XbY
Practice Problems:
These problems will not be graded and are not a part of your notebook. They are for more
practice if you need it. Also perform the problems at the end of the chapters.
1. What would the proportions be if a colorblind man had children with a homozygous normal
woman? What would the proportions be if a colorblind woman had children with a normal
man?
2. If a father and a son both have defective color vision, is it likely that the son inherited the
trait from his father? Why or why not?
3. In the mosquito Anopheles culicifacies, golden body (go) is a recessive X-linked mutation,
and brown eyes (bw) is a recessive autosomal mutation. A homozygous XX female with a
golden body (normal eye color) is mated to a homozygous XY male with brown eyes
(normal body color). Predict the phenotypes of their F1 offspring. If the F1 progeny are
intercrossed, what phenotypes and in what proportions will appear in the F2?
4. A golden bodied male (with normal eyes) was crossed to a brown eyed female (with a normal
body color). Predict the phenotypes of their F1 offspring. If the F1 progeny are intercrossed,
what phenotypes and in what proportions will appear in the F2? Are they the same as for the
above cross?
22
Mapping Linked Genes
These practice problems will not be graded and are not a part of your notebook. They are
for more practice if you need it. Also perform the problems at the end of the chapters.
1. If genes are linked on the same chromosome, we can calculate how far apart they are.
In diploid eukaryotes using a test cross
map distance = number of recombinant offspring X 100
total number of offspring
A. To determine the map units apart two genes are on a chromosome, cross two flies, female
heterozygous for aristaless and dumpy wings to a male homozygous for aristaless and dumpy
wings.
al dp x al dp
+
al dp
Why do we use the female as the heterozygous? How do we know this is on an autosome?
Our experimental results are as follows:
aristaless, dumpy wings
normal arista, normal wings
aristaless, normal wings
normal arista, dumpy wings
557
560
84
83
First we propose a hypothesis that these two traits are unlinked. Why do we use unlinked?
Our expected data are as follows: 321 of each phenotype combination. Where did I get this
number?
χ2 = (557 –321)2 + (560 – 321) 2 + (84 – 321) 2 + (83 – 321) 2
321
321
321
321
2
2
2
2
2
П‡ = (236) + (239) + (-237) + (-238) = 702.9
321
321
321
321
So we must reject our hypothesis of unlinked genes.
These genes are therefore linked, and I can find out how far apart they lie on the chromosome.
map distance = number of recombinant offspring X 100 = 84 + 83 X 100 = 13.0 cM
total number of offspring
1284
B. Are the genes bent wings and shaven bristles linked? If so, how far apart are they?
23
Test cross a heterozygous female: bt sv x bt sv
+
bt sv
Our experimental results are as follows:
bent wings, shaven bristles
normal wings, normal bristles
bent wings, normal bristles
normal wings, bent bristles
592
589
9
10
I hypothesize that these two traits are unlinked.
My expected data are: 300 of each phenotype.
χ2 = (592 –300)2 + (589 – 300) 2 + (9 - 300) 2 + (10 – 300) 2 = 1125.2
300
300
300
300
I reject my hypothesis; the genes must be linked. Map units = 19 X 100 = 1.6 cM
1200
Practice problem:
Are the genes black and purple linked? If so how far apart are they?
A homozygous wild type fly is crossed with a homozygous black (black bodies) purple fly
(purple eye color). The F1 females are test crossed to a black, purple fly. The following data were
obtained.
black
purple
black, purple
wild type
32
28
485
512
2. In ordered octads of Neurospora crassa, we can calculate the map distance of a gene
from its centromere.
map distance = 1/2 number of SDS asci X 100
total number of asci
A. We are looking at a proline biosynthesis gene, pro1 in Neurospora. We cross a wild type N.
crassa to a pro1- N. crassa. After meiosis, we get 6 types of asci:
4 pro+: 4 pro12 pro+: 2 pro1-: 2 pro+: 2 pro1
2 pro+: 4 pro1-: 2 pro+
4 pro1-: 4 pro+
2 pro1-: 2 pro+: 2 pro1-: 2 pro+
2 pro1-: 4 pro+: 2 pro1-
Which are first division segregants (FDS or M1) and which are second division segregants
(SDS or M2)?
24
My results from this cross are as follows:
4 pro+: 4 pro1607
2 pro+: 2 pro1-: 2 pro+: 2 pro1
72
2 pro+: 4 pro1-: 2 pro+
74
4 pro1-: 4 pro+
2 pro1-: 2 pro+: 2 pro1-: 2 pro+
2 pro1-: 4 pro+: 2 pro1-
598
76
73
What is the distance of the pro1 gene from the centromere?
map distance = 1/2 (295) X 100 = 9.8 cM
1500
Are genes always linked to a centromere?
Practice Problem:
How far apart is the A gene from its centromere? The cross is A x a.
The results are as follows:
4 A: 4 a
4 a: 4 A
2a: 2A: 2a:2A
2A: 2a: 2A : 2a
2A: 4a: 2A
2a: 4A: 2a
61
55
40
44
42
52
3. In the budding yeast, Saccharomyces cerevisiae, we can map the distance apart on a
chromosome between two genes that are linked. You can tell that the genes are lined
because PD >>> NPD when genes are lined.
map distance = tetratypes + 6NPD
total number of asci
X 0.5 X 100
A. We are interested in the map distance apart of two genes, one that make the yeast blue in
color and one that makes the yeast require adenine. I give you a blue strain (blu-) that can
make adenine and a normal wild type color strain (BLU+ they are white) that can not make
adenine. Each is haploid and of the opposite mating type. You want to determine if these
genes are linked and if so, how far apart are the genes on the chromosome.
Devise your cross: Mata blu- ADE+ x MatО± BLU+ ade-. Isolate diploids and force them to
undergo sporulation.
What is the diploid genotype?
Mata blu- ADE+
MatО± BLU+ ade-
25
You have a bunch of unordered tetrads now. What do you do? Remove the spores from each
asci under a microscope, place them in a row (so you’ll know which asci is which), and then
determine the genotype/phenotype for each.
Your results are as follows (don’t worry about the mating types of these spores):
2BLU+ ade- : 2 blu- ADE+
57
2BLU+ ADE +: 2 blu- ade60
+
+
+
+
1 BLU ADE : 1BLU ade : 1 blu ADE : 1 blu ade
122
Which are the PD, NPD, TT? Are these genes linked? Why or why not?
They are not linked because PD = NPD. When PD >> NPD, that means the genes are linked!
B. What if we were doing this cross: Mata blu- URA+ x MatО± BLU+ ura- (requiring uracil)
What is the genotype of the diploid?
Mata blu- URA+
MatО± BLU+ uraWe get the following genotype ratios for the spores progeny:
2BLU+ ura- : 2 blu- URA+
2BLU+ URA +: 2 blu- ura1 BLU+ URA +: 1BLU+ ura- : 1 blu- URA+: 1 blu- ura-
253
12
180
Which are PD, NPD, and TT? Are these genes linked? Yes, because PD >> NPD.
How far apart are these genes?
map units = 180 + (6 X 12) X 0.5 X 100 = 25.6 cM
253 + 12 + 180
Practice Problem:
Mata ura- THI+ x MatО± URA+ thiWhat is the genotype of the diploid?
2URA+ THI+ :2 ura-thi2 ura- THI+: 2 URA+ thi1 URA+ THI+ :1 ura-thi-: 1 ura- THI+: 1 URA+ thi-
27
157
22
Which are PD, NPD, and TT? Are these genes linked? If so, how far apart are they?
26
Three Point Crosses
You can determine if three genes are linked on the same chromosome. Here is one method for
doing so. Your book has a variation on this. The results will be the same.
1. Cross two flies, true breeding for three different traits.
2. Test cross the F1 females.
3. Group offspring according to phenotypes in the F2. First group in threes, then in twos.
The parental class will be the most frequent.
Then the single crossovers.
The double crossovers will be the least frequent.
4. Use the double crossover to determine the gene in the middle. In the double crossovers, the
least frequent phenotype, only one gene will differ from the parental. This becomes the gene
in the middle. Write out the three possible orders that you could get with the genes.
Determine which order would give you the combination of phenotypes you observe in the
double crossover data. There will only be one possible order of genes that give you that
phenotype.
5. Now write down the gene order you have determined and calculate the distance between
pairs of genes.
6. Draw the map.
Example:
1. I cross a D wild type to a G that has scarlet eyes, ebony body, and spineless bristles.
st+ e+ ss+ x
st e ss
+
+
+
st e ss
st e ss
All of the progeny will be heterozygous for each allele.
2. I cross D heterozygote from the F1 to a G that has scarlet eyes, ebony body, and spineless
bristles.
st+ e+ ss+ x
st e ss
st e ss
st e ss
3. The F2 looked like this:
wild type
ebony
ebony, scarlet
ebony, spineless
ebony, scarlet, spineless
scarlet
scarlet, spineless
spineless
347
68
10
67
368
54
78
8
27
Reassort phenotypes:
Parental: parentals are the parental phenotypes and are the most if the three genes are linked.
red eyes, tan body, normal bristles
347
scarlet eyes, ebony body, spineless bristles
368
Single crossovers: are the second most numerous in three gene linkage.
red eyes, ebony body, normal bristles
68
red eyes, ebony body, spineless bristles
67
scarlet eyes, tan body, spineless bristles
78
scarlet eyes, tan body, normal bristles
54
Double crossovers: will be the least numerous.
red eyes, tan body, spineless bristles
8
scarlet eyes, ebony body, normal bristles
10
Reassort genotypes again:
red tan
347 + 8 = 355
red ebony
68 + 67 = 135
scarlet tan
78 + 54 = 132
scarlet ebony
368 + 10 = 378
Total 1000
red normal bristles
red spineless
scarlet normal
scarlet spineless
347 + 68 = 415
67 + 8 = 75
54 + 10 = 64
368 + 78 = 446
Total 1000
tan normal
tan spineless
ebony normal
ebony spineless
347 + 54 = 401
78 + 8 = 86
68 + 10 = 78
368 + 67 = 435
Total 1000
4. scarlet spineless ebony
spineless ebony scarlet
ebony scarlet spineless
st+ ss+ e+
st ss e
ss+
ss
e+
e
st+
st
e+ st+
e st
ss+
ss
What are the phenotype and genotype of the double crossovers?
red eyes, tan body, spineless bristles AND scarlet eyes, ebony body, normal bristles
What gene is in the middle? Spineless is in the middle. These two double crossovers have two
of the parental phenotypes each and then there is the “odd man out.” This odd man out is the
gene in the middle.
28
So, the gene order is scarlet spineless ebony, and the genotype of the F1 female is
st+ ss+ e+
st ss e
5. The gene order is scarlet spineless ebony.
Map distance between scarlet and spineless is 75 + 64 X 100 = 13.9 cM
1000
Map distance between spineless and ebony is
86 +78 X 100 = 16.4 cM
1000
Map distance between scarlet and ebony is approximately 135 + 132 X 100 = 26.7 cM
1000
6. Map:
st 13.9cM ss 16.4cM
e
|
___ |
___|
st
30.3cM
e
Practice Problem:
This problem will not be graded and is not a part of your notebook. It’s for more practice
if you need it. Also perform the problems at the end of the chapters.
This is the cross: Cc Ss Bb x cc ss bb
Two flies were crossed, one heterozygous for the dominant traits curly wing, short bristles, and
blue body and the other homozygous recessive for straight wings, long bristles, and tan body.
These three genes are linked. The progeny were as follows:
c S B normal, short, and blue
13
c s b normal, long, and tan
473
C S b curly, short, and tan
9
C s B curly, long, and blue
1
C s b curly, long, and tan
15
c s B normal, long, and blue
9
CSB curly, short and blue
479
c S b normal, short, tan
1
Which are the parentals? Which are the single crossovers? Which two are the double
crossovers?
How far apart is wing shape and bristle length?
How far apart is wing shape and body color?
How far apart is bristle length and body color?
Map the three genes in relation to each other.
29
Lab Three: Genetic Experiments with Drosophila
Modified from Carolina Biological Supply Company: Carolina Drosophila Manual
Objectives:
You will be issued three different stocks of Drosophila of “unknown” genetic constitution for the
purpose of making controlled matings to:
1. determine the inheritance of the traits found in the stocks. It will be necessary that you
ascertain the genetic variation for wing type and eye color in the original stocks by
describing the variation found (use drawings if needed).
2. determine the inheritance of the different forms of each trait (dominant or recessive, X-linked
or autosomal).
3. describe the genes responsible for the traits. You will describe linkage relationships between
these genes and/or linkage on the sex chromosomes.
Theoretical Drosophila Assignment
Using information obtained from your book, lecture notes, Mapping Linked Genes, and this lab,
perform the following assignments in your lab notebook before coming to class. This
assignment will help you to get oriented as to what we are doing in lab and why! I helped you
out on the first two.
1. Given two vials of flies, one with all wild type characteristics and one with crimson eyes
(crimson) and no wings (wingless), design a series of experiments to determine:
A. if crimson and/or wingless are dominant alleles.
Answer: cross the flies with crimson eyes and no wings to wild type and look in the F1
generation. What are the phenotypes in the F1? The dominant traits show up in the F1.
B. if crimson and/or wingless are X-linked alleles.
Answer: perform reciprocal crosses (i.e. male wild type crossed to female crimson,
wingless and male crimson, wingless crossed to female wild type) and see if you get the
same results in the F1 in both crosses or if the results are different. If the results are
different, then the gene or genes are X-linked.
C. if crimson and wingless are linked genes or if they assort independently.
D. the map units between crimson and wingless, if crimson and wingless are linked.
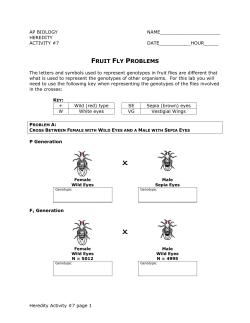
2. Given three vials of flies, one with all wild type characteristics, one with sepia eyes (brown
in color) and vestigial wings (stumpy wings), and one with an ebony body (black in color) and
sepia eyes, design a series of experiments to determine:
A. which are the dominant alleles.
B. if any alleles are X-linked alleles.
C. if any of the genes are linked genes or if they assort independently.
D. the map units between linked genes, if you find any genes are linked.
3. Given three vials of flies, one with sepia eyes, one with wrinkled wings, and one with
apterous (no) wings, design a series of experiments to determine:
A. which are the dominant alleles.
B. if any alleles are X-linked alleles.
C. if any of the genes are linked genes or if they assort independently.
D. the map units between linked genes, if you find any genes are linked.
30
Fly Experiment Timeline/Outline and Goals for Each Step
This lab will take several weeks and it can get confusing as to what we are doing and why. This
is an outline/timeline of each step and the goals for each step. Hopefully this will keep you on
track as well as help you stay organized so that you may easily and effectively write your lab
report.
Ultimate goals:
1. Determine if the mutants genes are
A. dominant or recessive
B. autosomal or X-linked
C. either gene combination is linked
2. If genes are linked, determine how far apart they are.
How do you do this?
We will cross wild type flies with mutant flies, mutant for two phenotypes. This will produce
F1s. The F1s will be analyzed to determine which genes are dominant and which are recessive
and if the genes are autosomal or X-linked. Then the F1s will be allowed to sib-mate (in new
vials) to produce F2s. The F2s will be sorted by phenotype and counted to determine if the genes
are linked.
Fly Experiment Week One
1. Make 2 vials of media (per group).
2. Observe phenotypes and sexes of flies.
2. Place in each vial parental flies for one cross.
Female virgin wild type X male sepia vestigial
Female virgin wild type X male black vestigial
Goals
1. Learn basic fly techniques, like making media, fly manipulation, and fly husbandry.
2. Set up parental crosses to produce heterozygous offspring.
Week Two
1. Anesthetize parents.
2. Double check phenotypes and sexes.
3. Place in morgue.
Goals
1. Ensure flies placed in vials were what you wanted.
2. Remove parents so that they are not mistaken for F1 flies when the F1s emerge, nor will they
mate with the F1s.
Week Three
1. Make 6 vials of new media (per group).
2. Clear all vials of adult flies and anesthetize F1 flies.
3. Check for phenotypes of F1.
4. Transfer F1 flies to a new vial with fresh media. Make one vial for each to ensure you will
have enough F2 flies for counting.
5. Save old vials in case of experimentor error.
31
Goals
1. Determine if mutant genes are dominant or wild type.
2. Determine if genes are autosomal or X-linked.
3. F1s are transferred so that they can lay eggs for you to harvest F2s.
Week Four
1. Remove all flies from the second set of vials.
Goals
1. Remove adult flies so you will not confuse them with the F2s.
Week Five
1. Clear all vials of flies.
2. Anesthetize, sort, and count them, by phenotypes.
3. Analyze data for gene linkage.
Goals
1. Use the data from the F2s to determine gene linkage.
2. If linked, determine how far apart the genes are. Use Z value.
The Drosophila Life Cycle
The fruit fly (Drosophila melanogaster), which you will use for these experiments, is a typical
insect. It goes through four stages in its life cycle: egg, larva, pupa, and adult. The complete
reproductive cycle from egg to hatching adults is short; the average period is about 13 days with
a range of approximately 10 to 20 days depending upon the culture temperature. Pure-breeding
mutant stocks for many traits are available for experimental genetic studies. This fact, combined
with a short reproductive cycle, the ease of handling, and low cost, makes them an excellent
laboratory subject for experimental genetics. The same laws of heredity that are demonstrated in
the fruit fly also apply to larger, more complex organisms.
Drosophila flies are ready for mating within about ten hours after emerging from the pupa case.
So, the male can fertilize a female anytime after she is ten hours old. After a short courtship in
which the male circles the female while vibrating his wings, the female spreads her wings
laterally and insemination takes place. Sperm is received in seminal receptacles within the
female and is used to fertilize eggs laid by the female for her entire life. As sperm from the first
mating is still present at the second mating, it is not possible to cross the same female to different
males and get accurate results.
The eggs are usually fertilized at the time of laying, and early embryonic development takes
place within the egg case. The female will not lay eggs in any quantity until about 24 hours after
a mating. Thereafter, she will lay from 50 to 100 eggs per day. You can sometimes see the eggs
on the surface of the food and especially around the edge where the food joins the vial. The eggs
are usually present within a day after the flies have been placed in the vial. They are only about
0.5 mm long and bear 2 filaments at the anterior end. These prevent eggs from sinking into the
soft food. The eggs must have contact with air and will drown if immersed for long periods.
Within 2 days after the eggs have been laid, very small larvae will hatch out and crawl in the
media. They are so tiny that you may have difficulty seeing them except with a
stereomicroscope. This larva represents the first instar. They will eat almost all the time and
32
double their size about every 24 hours. After its first molt (shedding of its outer skin), the larva
will form the second instar. They will eat, grow, and molt again to form the third instar, which
will be about 5 mm in length if grown on food rich in yeast. The larval stages feed in the media
for about 6 days and then crawl up on a dry spot to pupate.
The third instar will pupate after about 6 or 7 days after hatching under ideal growing conditions.
The larvae crawl up out of the food and adhere to a relatively dry surface, which may be the side
of the vial or a piece of netting inserted into the food. The soft larval skin dries and gradually
develops a brown pigmentation. It is now known as a pupa case, and within this, the
metamorphosis from the larval to the adult form takes place. It is easy to tell when the time for
emergence is near. The pupa case is a rather dark brown and the folded wings can be seen as
two elongated dark areas within. Also, the pigment of the eyes will be developed and can be
seen as two bright red spots (in the case of the wild type flies). Emergence is to be expected
within 24 hours when such characteristics can be seen. The adult emerges by forming its way
through the anterior end of the case. The newly emerged fly will be very long, relatively
unpigmented (light color), and with folded wings (the adult will be able to fly about 2 hours after
hatching). It will darken rapidly, however, the wings soon unfold, and the body becomes more
compact.
Methods:
Records
The success of any experiment depends upon a complete, concise and workable system of
records. All original records should be kept in your notebook. No records are to be kept on
loose sheets of paper. In case of a mistake in the notebook, cross it out; do not erase. This lab
will take several weeks to finish. Skip several pages for this in your notebook in order to keep
all of the fly work together. This makes it easier for you to keep your notebook organized.
It is necessary to make observations only on those characteristics to be studied in your
experiment. In this experiment, three pairs of traits will be followed: eye color, body color, and
wing type. A suggested chart format for these records is included. Be sure that you are certain
of the differences involved in your flies and that you classify all flies completely. Before you
start your experiment, plan a system of records for your experiment and also devise a crossing
procedure.
Each controlled mating that you make should be assigned a mating code. For each mating,
record the dates of mating, transferring and counting in your notebook. The minimum you will
need to do to complete this experiment is:
1. describe the phenotype of the male and female flies of the original stock cultures;
2. make controlled matings between each stock culture and the wild type flies;
3. describe the F1 generation from these matings, tabulated by sex and phenotypes;
4. sib mate F1 generation flies from the same controlled mating;
5. describe the F2 generation from the sib matings, tabulated by sex and phenotypes;
6. determine if any of the genes is linked;
7. and if so map them by using F2 data to calculate a Z value.
33
Preparing Media
You will be given Drosophila vials. We will use an instant culture media. The medium, which
has a white, flaky appearance, is dehydrated and already contains a mold inhibitor and does not
need cooking or sterilization. We will use the media with an additive that turns the medium blue
when dissolved in water; this allows easier observation of some of the developmental stages of
Drosophila.
To prepare a culture, obtain a clean plastic culture vial from the bin labeled food vials. Place 10
- 15 ml fly media in the vial. Add ONLY 3 grains of yeast. Too much will produce carbon
dioxide and kill the flies. Next, add the same amount of water to the culture vial. You may
need to lightly tap or gently swirl the culture vial so the medium becomes rehydrated. The
medium will be quite fluid at first, but within a few minutes it will become more solidified and
will be ready to use. Your media should be the consistency of gooey instant mashed potatoes.
Add a piece of netting and a foam stopper.
Handling Drosophila
As you first look at the tiny Drosophila given to you for study, you may think that handling such
tiny creatures will be very difficult. With a little practice in the proper techniques; however, you
should find it relatively simple. Certainly, you can tell little about them with the naked eye, so
some means of magnification must be used. You will use a stereomicroscope with a built in
light. The flies show best against a white background, so you will use a white card upon which
to place the flies. The microscope lights get hot, and this can kill the flies, so use the lowest light
setting and be very judicious with your use of the microscope light.
1. Anesthetizing Procedure
Anesthetizing is necessary to quiet the flies so they can be studied and transferred. We will use
FlyNapВ®. With relatively short exposure times, the flies remain anesthetized for 30 to 45
minutes. Young flies may remain anesthetized for several hours. Thus, the flies should not
begin to recover while they are being examined, which virtually eliminates the need to
reanesthetize them.
Transfer the flies to an empty culture vial. These are in the bin labeled FlyNap vials. To get
flies in an empty culture vial, invert the culture vial. Since the flies are negatively geotropic,
they tend to crawl up and away from the stopper. Flies that remain near the stopper can be
shaken away by turning the vial upright and tapping the vial down on a soft surface, though not
so hard as to lodge the flies into the medium. When the stopper is removed, the flies can be
easily shaken down into the anesthetizing vial. Immediately plug both vials.
Dip an anesthetic wand into the FlyNapВ® bottle and allow any excess liquid on the wand to drip
back into the bottle. Then place the wand into the vial with the flies you want to anesthetize.
The FlyNapВ® will evaporate into the atmosphere of the vial. Within a few minutes (about one
minutes in an empty vial) the flies will be anesthetized and can be manipulated. Pour the flies
out of the vial onto a white card and place under a microscope. Do not overanesthetize your
flies because they will die!
34
2. Techniques for Microscopic Study
Use a soft brush to brush the flies up into a narrow column across your white card. This card can
be moved back and forth under the microscope to examine the different flies in the column. To
manipulate the flies while viewing them, use the brush. Practice moving the flies about with the
brush. Turn them over and become familiar with every part of the body. Note the color of the
eyes, the wing type, and the body color. If you have any flies in your original stock cultures that
appear to have a much lighter body shade that the other flies, it probably means they are newly
emerged. It requires about 2 hours before they attain their full pigmentation. Also, if you have
one fly that has just emerged its wings may still be folded tightly. You might think that you have
found some strange new mutation, but within a short while the wings will be expanded. If you
see some flies with the wings folded together over the back and the abdomen curved downward,
throw them away, they have been overanesthetized and are dead.
3. Distinguishing Sex
It is very important you learn how to identify the two sexes of Drosophila. If, because of
mistaken identification, you allow a male to go into a vial with a group of virgin females that are
later used in a genetic cross, the results will not be accurate. As you move a male and female
side by side into view, note the distinctions. From the dorsal surface, the most noticeable sex
difference is the pigmentation at the posterior part of the abdomen. The male has heavy
pigmentation on the entire posterior part of the abdomen with two pigmented bands anterior,
while the female has five bands of pigment along the entire abdomen. This characteristic is very
clear-cut and easily distinguished in mature flies, but in newly emerged flies, the amount of
pigmentation is much less and this difference is not so clear-cut. The posterior tip of the
abdomen of the female is somewhat pointed, but is rounded in the male. The male genitalia are
surrounded by heavy dark bristles that are absent in the female. The males also have a pair of
dark, bristle-like sex combs, on the front legs. Males, as a whole, are noticeably smaller than
females raised under similar conditions, but there can be some overlapping of size even in flies
from the same culture.
4. Starting Drosophila Cultures
Make up vials with media as needed. Remove the vial plug and holding the vial on its side, use
the brush to move the flies into it. IMPORTANT - keep the vial on its side after you replug it
until ALL the flies are awake. If you turn it upright, the flies will fall on the sticky surface of the
food and usually cannot escape, so you will lose most, if not all, your flies, if you turn the vial
upright too soon. Once they are awake, however, they can take care of themselves and there is
no problem.
Your cultures will grow very well at room temperature (preferably above 21oC and below 25oC).
Extremes of temperatures should be avoided. If the temperature goes above about 31oC for
several hours, the flies may become sterile and you will get no offspring. You cannot put them
in a refrigerator. At temperatures below about 13oC, the flies become inactive and will begin
dying after several days at these temperatures. Culture vials should NOT be exposed to direct
sunlight and may be kept entirely in the dark. We will keep ours in a controlled environment
chamber.
35
5. Collecting Virgin Females
As a geneticist, it is important to have controlled matings for your experiments, so it is necessary
to obtain females before they have mated with males. Traditionally, we can take advantage of
the fact that flies are not ready for mating until about ten hours after emerging from the pupae
cases. So, if a vial is emptied of all flies, the females that emerge in the next ten hours will be
virgins (i.e. have not been inseminated). They can be separated from their male siblings and
used for controlled genetic crosses. As a margin of safety, it is best to use eight hours as the
maximum time to leave the flies together in the vial. Usually, to collect virgin females for
matings:
1. select a vial where new adults are emerging;
2. remove and discard ALL adult flies from the vial;
3. make note of the time when the flies are discarded;
4. return no more than 8 hours later and remove adults that have emerged;
5. separate those adults into males and virgin females;
6. set up vials for controlled matings.
Females will be ready for mating somewhat earlier than males, so be sure than an older male is
not left in the vial. Females tend to emerge sooner than males raised in the same vial. Hence
more virgin females can be obtained from a vial that has just begun producing adults than from
an older culture. So it is a good idea to use vials that first start producing adults when collecting
virgins. Also, you will find that most of the flies will emerge during the early part of the day.
You will probably get 4 times as many flies from a vial that was emptied at 8 AM and the flies
collected at about 4 PM than you would if the vial was emptied at 10 AM and the collection
made at 6 PM. You may keep the virgins in isolation for several days in prepared vials with food
before mating them.
Flies will die within a few hours in a dry vial. Also, do not be disturbed if you find eggs in a vial
of supposed virgins. Virgin flies, like virgin chickens, will lay eggs, especially after they have
been kept for several days without mating. Should you find small wiggling larvae in a vial of
supposed virgins; however, you have made a mistake and they were not virgins or a male was
not excluded.
***Our wild type flies are of a genetically engineered strain with an apoptosis inducing gene
under a heat shock promoter on the Y chromosome. The supplier heat shocks the vial and then
sends it to us. This kills all XY males and we are left with only virgin XX females and XO
males.
Crosses
1. Making the Original Cross and the Reciprocal Cross
Reciprocal cross analysis is used to determine which alleles are dominant or recessive, if the
genes follow simple Mendelian inheritance, and if the genes are autosomal or X-linked. Select
virgin females from one of your true breeding stocks and place 3virgin females in each of two
newly prepared media vials (laid on their side). In the same vials, place 3-6 males of the other
true breeding stock. Mark the date and type of mating on the bottle. For example - 9/12/99, 3
Females A X 3 Males B, with the female designated on the left and the male on the right. The
flies will mate soon after recovering. We should make the cross in the reciprocal (opposite)
36
direction (i.e. - 9/12/99, 3 Females B X 3 Males A). However, we will not since the strains are
not available. Why do you use virgin females? Why do you use true breeding stocks?
After 7 days, anesthetize the parent flies in the vials, check the parent flies for each vial for
phenotype (just to be sure), and discard them in the fly morgue. By this time, larvae should be
evident in considerable numbers in the media of the vials. If you do not see larva, repeat the
crosses until you have F1 larva.
2. The F1 Generation
About 12 days after the date of the original mating, F1 flies should begin to emerge. Separate
these F1 flies by sex and record the observed phenotypes. If the genes are autosomal what do
you expect? If the genes are X-linked what do you expect? How can you tell which traits
are dominant and which are recessive?
3. Sib Matings
The results from the sib-mate will tell you if the genes are linked to one another or if they are
independently assorting. Place at least 6 pairs of F1 flies from the original cross in one fresh
media vial and at least 6 pairs of F1 flies from the reciprocal cross in one different fresh media
vial. Because the F1 flies are to be sib mated, the flies do not have to be virgins. Mark the vials
with the date, the type of original mating, and the generation. Each of these bottles will produce
about 250 flies for the next generation. Remove the F1 flies after about 7 days. What are your
expected results from this cross if the genes are unlinked?
4. Test Cross
The results from the test cross will also tell you if the genes are linked to one another or if they
are independently assorting. Test crosses are the preferred way to determine map units between
linked genes. A test cross is set up with a virgin female F1 and a homozygous recessive male fly.
We will not perform a test cross as F1 virgin females are hard to come by. What are your
expected results from this cross if the genes are unlinked?
5. F2 Generation
In about 12 days after the F1s were transferred or the test crosses were set up, the F2 generation
will begin to emerge. You need at least 100 flies from each cross, preferably over 200, to do the
calculations you need for this project. Sort and count each fly based upon phenotypes. If you do
not have 100 flies, request data from other groups and add this data to yours. Acknowledge them
in you write up and in your notebook.
Cleanup
You are responsible for cleaning up your mess in the lab room and the area you are
assigned for keeping your flies. Follow your instructor’s directions on clean up.
37
Data analysis
1. Propose your hypothesis (unlinked genes, autosomal, Mendelian inheritance).
2. Perform a Chi square analysis using the F2 data to accept or reject your hypothesis.
3. If your hypothesis is rejected, determine why (i.e. linkage, X-linkage, extensions to
Mendelian inheritance, or nonMendelian inheritance).
4. If your genes are linked, you need to map the genes.
5. To map our genes we will calculate a Z value and use a look up table. This is LESS
ACCURATE than using the test cross data, but it will suffice.
A. Figure out phenotypic numbers for the cross:
a is the number of flies with both dominant phenotypes
b is the number of flies with one homozygous recessive phenotype
c is the number of flies with the other homozygous recessive phenotype
d is the number of flies with both homozygous recessive phenotypes
B. Figure out, do we have a coupling cross or a repulsion cross?
A coupling cross is:
PXP
double dominant true breeding phenotypes x double recessive true breeding phenotypes
A repulsion cross is:
PXP
one recessive true breeding phenotype X the other recessive true breeding phenotype
C. Use this equation for a coupling cross
b*c=Z
a*d
Use this equation for a repulsion cross
a * d = Z value
b*c
6. Then use table on the following page to find the approximate map units for the cross. Look
in the appropriate column and then look over to the left to get the Crossover Value. table
taken from
http://lifesci.rutgers.edu/~mcguire/Toolbox-Demo/F2%20crosses/calculation_of_recombination_fro.htm
7. Multiply the Crossover Value by 100 to get the map units. Ta da. You have mapped your
genes from the F2 data.
38
39
Drosophila Paper Assignment
A detailed paper outlining your research is due according to your syllabus. Consider this
experiment as original work. This is an individual paper and should not be treated as a group
assignment. Get the experimental data first, and then determine whether or not these data fit into
any known genetic hypothesis. In other words, do not assume that you must necessarily get
certain stereotyped results. You are required to reference sources in your paper (at least 4) as
would anyone else handing in original research. You may NOT use this handout as a referenced
source. The paper might follow an outline similar to the following, but does not have to:
I. Title: Short, but informative, include the organism studied and the experiment(s) carried out.
II. Abstract: Short summary of the hypotheses, experiments, results, and conclusions. Each one
of the following should be answered in one to three sentences. The abstract is a mini-paper
and should stand alone as a concise but complete description of the “Why?” “How?” And
“What were the results?” of your experiment.
A. What is Drosophila? Why use Drosophila?
B. What is your hypothesis? How are you going to test it?
C. What SPECIFIC crosses did you do? Describe PXP to F1 reciprocal crosses, F1 sib mate,
test cross, for both sets of phenotypes
D. What SPECIFICALLY were your results?
E. Interpret your results as they relate to your hypothesis. What phenotypes are dominant,
which are recessive? Are the X-linked or autosomal? Are they linked or unlinked? How
do you know?
F. If you genes are linked, indicate the map units between the genes and how you determine
these (i.e. from the test cross or from the F2 data).
III. Introduction: Describe the background necessary to have in order to be able to read the rest
of the paper and describe what the experiment is attempting to discover.
A. Drosophila life cycle, fly genetics
B. Central Dogma of Molecular Biology, what is the ultimate product of a gene?
C. How are genes inherited in simple Mendelian inheritance? In other forms of
inheritance?
D. What are X-linked or autosomal traits? How can you determine if a gene is
autosomal or X-linked? What is Y-linked? How can you tell if a gene is Y-linked?
E. What are dominant or recessive traits? How can you determine if a trait is dominant
or recessive?
F. What are linked or independently inherited genes? How do you determine if a gene is
linked or independently inherited?
G. What are your hypotheses or purpose of the experiment?
H. What experiments are addressing which parts of your hypotheses/purpose?
I. map distance between linked genes (if appropriate)
IV. Materials and Methods: A description of what was done and what materials were used. No
data should be included in this section; include time periods between each step. This section
should never be written in second person!!!
A. preparation of culture vials
B. collection of flies
1. anesthetizing
2. sexing
3. obtaining our virgin wild type females
40
4. classification of P flies
5. types of crosses made
6. removal of parents
7. classification of F1 flies
8. sib matings
9. classification of F2 flies
10. Chi square analysis (when and why you use it and the equation you use)
11. determination of linkage (equation you used)
12. determination of map units (equation you used)
V. Results and Discussion:
A. Describe each cross, and using a Punnett Square, diagram each cross. Discuss a
theoretical explanation of each of the original and reciprocal crosses, F1 and F2
generations.
B. List the data from the F1 and F2 generations for each cross separately and in
consecutive order. List both F1 and F2 generations of any cross together. The data
would be presented in tabular form for the F2 generations, using appropriate table
headings, but could be written in descriptive form for the F1 generations. List each
bottle of any given cross separately and then list the total of F1 and F2 results on all
progeny from a similar cross. Show or describe data from reciprocal crosses
separately. Combine data later if appropriate.
C. Calculate your theoretical results (expected) for the total and arrange them in tabular
form, could be combined with above table, if you wish.
D. Perform a chi-square test on all crosses. Explain the results.
E. Explain all conclusions that can be reached separately. Cite the evidence that
supports each conclusion and discuss how the conclusions were reached.
1. Which alleles are dominant and which are recessive?
2. Which alleles are sex-linked and which are autosomal?
3. Which genes are independent of each other and which are linked?
4. Map the distance between genes if linkage is involved.
a. If using F2 data, indicate a, b, c, and d.
b. Draw gene map showing relative distances between genes.
c. If your data does not match the published map distances, explain why.
F. Discuss your data, difficulties, etc. Explain departures of your data from the results
you expected. If your testcross data and F2 data don’t match (i.e. one says the genes
are linked and one does not by Chi square analysis) explain it here.
G. Add anything else you would like to discuss or found interesting. Not why you hated
this lab. This is not the place to rage against the instructor or lab exercise.
VI. Literature cited: There are several books on reserve in the library. You may also use any
relevant journal articles in the library and/or your textbook. You may use 2 websites. Use 4
or more references.
41
Questions to be answered in your notebook:
Parental crosses:
1. What are the genotypes and phenotypes of these strains?
2. Are these strains true breeding? If so, is this important for the experiment?
3. Why must virgin females be used?
4. Diagram the crosses that you performed.
5. Why were reciprocal crosses performed? What experimental questions(s) will these
reciprocal crosses answer?
6. What results do you expect if the genes are autosomal?
7. What results do you expect if your genes are sex-linked?
F1 Generation (answer test cross questions even if you didn’t do a test cross):
8. What are the genotypes and phenotypes (with sex ratios) of the F1 generations?
9. Are any of these traits X-linked? How do you know? If the genes are autosomal what do
you expect? If the genes are X-linked what do you expect?
10. Which traits are dominant? Which are recessive? How do you know? Does the inheritance
follow simple Mendelian rules? How do you know?
11. What are your hypotheses?
12. What are the expected ratios based upon your hypotheses?
13. What are your chi-square values? What are your degrees of freedom? Do you accept or
reject your hypotheses?
14. Diagram the crosses you made.
15. Why did you perform each cross?
16. For each sib-mate, what are your expected results if your genes are unlinked?
17. For each sib-mate, what are your expected results if your genes are linked?
18. For each test cross, what are your expected results if your genes are unlinked?
19. For each test cross, what are your expected results if your genes are linked?
F2 Generation:
20. What are the genotypes and phenotypes with sex ratios of the F2 generation?
21. What are your hypotheses?
22. What are the expected ratios based upon your hypotheses?
23. What are your chi-square values? What are your degrees of freedom? Do you accept or
reject your hypotheses?
24. Are any of your genes linked? If so, how do you know?
Test Cross:
25. What is a test cross?
26. What is the ratio expected for a test cross if there is no linkage?
27. Why didn’t we do a test cross?
28. What equation do we use to map test cross data?
29. What does this equation tell us?
42
Mapping:
30. If any of your genes are linked, how far apart are they? How did you determine this?
31. If you mapped using the F2 data, why does this work?
32. In a coupling cross, draw the chromosomes from the parents and following them through to
the F2 (if there’s linkage, assume no crossing over).
33. What phenotype combinations should never be present if there is no crossing over in the
coupling cross, if there’s linkage? If that/those phenotype(s) is/are present, what does this
indicate?
34. In a repulsion cross, draw the chromosomes from the parents and following them through to
the F2 (if there’s linkage, assume no crossing over).
35. What phenotype combinations should never be present if there is no crossing over in the
repulsion cross, if there’s linkage? If that/those phenotype(s) is/are present, what does this
indicate?
36. What does the Z value tell you?
37. The higher the Z value, the closer or further apart are the two linked genes?
43
44
45
46
47
48
49
Lab 4: Analysis of Variable Phenotypes in Drosophila Mutants
Objectives:
1. To investigate alleles that demonstrate extensions of Mendelian inheritance, using
Drosophila mutants as our model.
2. To practice scoring traits, including those that are subtle and those that do not conform to the
expected norm of binary phenotypes.
3. To gain more experience manipulating and sexing flies.
As we saw last week, many mutants of Drosophila are easily identifiable. We have also
witnessed this phenomenon in corn two weeks ago. However, many mutant alleles are not so
easily scorable. In some cases, it can be difficult to identify if the organism in question has a
mutant phenotype, or to what degree the mutation is causing a phenotype. In this lab exercise,
we will study some mutant Drosophila with difficult to score phenotypes, while reinforcing the
concepts of five extensions of Mendelian inheritance: variable expressivity, incomplete
penetrance, multiple alleles, dosage compensation, gene dosage, and temperature
sensitivity.
Expressivity is the degree to which a trait is expressed. Some mutant alleles show variable
expressivity, in which the individuals have the same genotype but differ in their phenotype. An
example
in
humans
is
the
dominant
myotonic
dystrophy
(http://www.mda.org.au/specific/mdamyt.html).
Each individual who has the dominant M
phenotype develops the disease, characterized by muscle wasting and other symptoms, such as
hair loss, GI problems, mental retardation, but each individual develops the disease at a different
age and some become more seriously affected than others (they may only have very slight
muscle wasting, for example, or may show all of the above symptoms and more). That variation
in the DEGREE (severity) of the disorder is due to variable expressivity. We will look at two fly
mutants, eyeless and lobe, whose phenotypes demonstrate variable expressivity.
Incomplete penetrance is a phenomenon is which the phenotype does not always match the
genotype. A dominant allele or alleles are present, but the phenotype may still be wild type.
This causes the phenotype to skip a generation even though the dominant allele is present. Lobe
also exhibits incomplete penetrance.
Some genes are found in three or more alleles; these genes thus exist in multiple alleles that
differ from each other in genotype and phenotype. These alleles can exhibit different
relationships of dominance and recessiveness. In this lab today we will look at four X-linked
alleles of a Drosophila eye color gene (white): wild type, eosin, apricot, and white. Wild type is
dominant over all of these alleles. White is totally recessive. Eosin is dominant over white and
recessive to wild type. Apricot is dominant to white and recessive to wild type.
Most of the time, X-linked alleles demonstrate dosage compensation. Dosage compensation
refers to the phenomenon that in males, the protein expression levels from the hemizygous genes
on the X chromosome are the same as those from the XX female. In Drosophila, the expression
of the genes on the one X chromosome of the male is “turbo charged” so that the protein level of
most of the X-linked genes in the male is the same as the XX female. We will look at apricot
50
eye color and wild type eye color that demonstrate dosage compensation-the hemizygous XY
male and the XX female have the same phenotype, even though the male only has one copy of
the X-linked gene.
In a few cases, the gene dosage effect is seen in which the number of copies of a certain Xlinked allele affects the phenotype of the allele-generally the more copies, the more intense the
phenotype (like incomplete dominance but on the X chromosome). This occurs because each
allele will influence the amount of protein made, so zero alleles will have no protein made, one
allele will have 50% protein made, two alleles will have 100% of protein made, etc. In an Xlinked trait, male flies will always have one copy of the gene (hemizygous genes only) and
female flies will always have two. Thus, with genes that demonstrate the gene dosage effect, a
male with the dominant allele (one copy, since it’s X-linked) has a different phenotype than the
female with two copies of the dominant allele. An example of this is the eosin fly eye color, in
which the female fly’s eye color (two eosin alleles) is darker than the male’s eye color (one eosin
allele) or the heterozygous female’s (one eosin allele). We will look at eosin eye color mutant
flies whose phenotype demonstrates gene dosage. We will also look at bar eye fly mutants that
demonstrate gene dosage. Interestingly, the apricot allele also demonstrates gene dosage, as the
heterozygous female (apricot/white heterozygote) has a lighter eye color than the homozygous
female or the hemizygous male. We will also look at the gene dosage effect in the apricot allele.
Conditional alleles only show the mutant (variant) phenotype under certain conditions. For
example, in humans there is a loss of function mutation in the phenylalanine hydroxylase gene
that, in the homozygous form, leads to the inability to breakdown phenylalanine from dietary
protein; this disorder is called PKU or phenylketonuria. A diet high in phenylalanine leads to a
toxic buildup of this amino acid and metabolic breakdown byproducts and subsequent mental
retardation and other detrimental phenotypes. However, a diet low in phenylalanine does not
lead to the buildup and the phenotypes are not seen. Thus, this disorder is conditional; under one
set of conditions (high phenylalanine diet) one phenotype is seen (mental retardation), and under
another set of conditions (low phenylalanine diet), a different phenotype is seen (wild type).
Temperature sensitive alleles are a type of conditional allele. With temperature sensitive
alleles, the phenotype varies based upon the temperature at which the mutants are grown or
incubated.
PHENOTYPES:
Wild type flies:
Wild type flies have bright red eyes with approximately 800 facets per eye. The wild type eye is
a spherical shape, with a smooth surface and smooth edges. The wild type eye color allele is
dominant (dominant wild type white+ gene) over all other eye color alleles we will be observing
in this lab.
At both temperatures we will be testing, wild type flies fly and hop around the vials.
51
Mutants:
Eyeless is a recessive allele in which the eye size and number of facets is reduced, as compared
to wild type. The eye may be only slightly reduced in size or may be less than one half of its
normal size. This is an example of variable expressivity, because all of the true breeding stock
has the same genotype but varies in phenotype. These flies have red eyes, but the eyes vary in
size. Eyeless is an autosomal gene.
Lobe is a dominant autosomal allele that exhibits variable expressivity, in which the eye size
and number of facets is reduced; the eye may also have a nick or nicks in the edge in this mutant.
Lobe also demonstrates incomplete penetrance; in the true breeding strain, the eye may also be
wild type in shape and size. So, the eye may be wild type in size, only slightly reduced in size,
or may be much smaller than wild type. These flies have also red eyes, but the eyes vary in size.
The white eye allele is X-linked and recessive to all eye color alleles we will be looking at in this
lab. We will only be looking at the white eye allele in respect to the eye colors, not the eye
shape. This mutation is the total loss of function allele of the white gene.
The eosin allele causes the eye to appear a pinkish-yellow, darker in color than wild type. Eosin
is dominant to white and recessive to wild type, so it is an example of an allele of a gene with
multiple alleles (the white gene). Eosin is an X-linked eye color mutation in which the gene
dosage effect is best seen. In true breeding females, the eyes are darker in color than the true
breeding males’ eyes. The eosin/white heterozygous female has the same eye color as the male
with eosin eyes.
The apricot allele causes the eyes to appear a peachy color, lighter than wild type. Apricot is
dominant to white and recessive to wild type, so it also is a multiple allele of the white gene.
Apricot is an X-linked eye color mutation in which both dosage compensation and gene dosage
are also seen. For the example of dosage compensation, hemizygous males (one copy on one X
chromosome) and homozygous females (two copies on two X chromosomes) have the same
phenotype. For the example of gene dosage, The apricot/white heterozygous female (one copy
of the apricot allele) has a phenotype that is half as intense as the homozygous apricot female or
the hemizygous male.
Bar is a dominant X-linked gain of function mutation. A gain of function allele is a variant of a
gene in which the mutation has bestowed on the protein a new or enhanced function. The eyes in
these mutants have less facets, corresponding to how many copies of the bar allele each fly has.
Thus, the more copies of the bar allele, the less facets the fly’s eye has. This allele also
demonstrates gene dosage.
Female homozygous bar eyed flies have less facets than
hemizygous males.
52
Shibire is an autosomal conditional (temperature sensitive) allele of the dynamin gene.
Dynamin function is required for synaptic vesicle fusion. At the nonrestrictive temperature (low
temperature, full protein function), the flies are wild type in terms of behavior. Incubation at the
restrictive temperature (high temperature, loss of protein function), the flies are no longer able to
release neurotransmitters, become paralyzed, and can have seizures. The flies will return to the
wild type phenotype if transferred back to the nonrestrictive temperature.
Methods:
1. Each lab group will obtain one vial of flies, available on the side counter. Double check with
your instructor and then use FlynapВ® to anesthetize the flies. CLEARLY LABEL the files
and place under a dissection microscope for observation. Go around to each lab group
station (each will be a different mutant or cross) and observe, as indicated in this lab handout.
2. For the eye mutants, observe and record each phenotype as indicated in this manual. Make
sure you differentiate between the sex of flies in eosin, apricot, and bar eyed flies. White,
apricot, and eosin affect the eye color; and eyeless, lobe, and bar affect the eye shape.
Eyeless and lobe are autosomal. White, apricot, bar, and eosin are X-linked.
VARIABLE EXPRESSIVITY AND INCOMPLETE PENETRANCE
Eyeless
A. For true breeding eyeless, observe the variable expressivity of the trait. You are looking
at the size and shape of the eyes. Count and record how many flies have almost a wild
type eye, how many have a very small eye, and how many are in between, observing at
least 25 total flies. Look at both eyes, not just one, as the phenotype will vary between
individuals but also can vary between eyes on the same individual!
Lobe
B. For true breeding lobe, observe the variable expressivity and penetrance of the trait.
You are looking at the size and shape of the eyes. Count and record how many flies
have a wild type eye, an eye almost wild type (for example, may only have a small nick
in the edge), how many have a very small eye, and how many are in between, observing
at least 25 total flies. Look at both eyes, not just one, as the phenotype will vary between
individuals but also can vary between eyes on the same individual!
MULTIPLE ALLELES
C. Observe and record the eye color of the true breeding strains of wild type (red), eosin,
apricot, and white, looking at both sexes. These are all alleles of the X-linked white
gene.
53
GENE DOSAGE EFFECT
Eosin
D. For the true breeding eosin mutant strain, observe the gene dosage effect in the flies.
Note that the females and males differ in their eye color phenotypes. Record how much
darker the females’ eyes are than the males’. You are looking at the eye color not shape
in eosin flies.
E. Observe the gene dosage effect in flies from the mixed stocks. These are F1 and F2
generation flies from the following cross: eosin eyes crossed to white eye (crossed to
white so that we can see eosin as eosin is dominant to white, but recessive to wild type).
This cross was not performed with virgin females, and males and females of each
phenotype were in the same vial, so the offspring are not all of the same genotype.
Carefully sex, observe, count, and record the differing phenotypes of at least 25 different
flies, noting when the females and males differ in their phenotypes. Compare these to the
true breeding stocks, if necessary. In the mixed eosin stocks, you will be able to find a
heterozygous female. What does the heterozygous female look like? How do you know
this female is heterozygous? Show this heterozygous female to your instructor.
Apricot
F. For the true breeding apricot mutant strain, observe dosage compensation. Note that the
eyes of the females and males are basically the same color, even though females have two
copies of the X-linked allele and the males have only one copy. You are looking at the
eye color not shape in apricot flies.
G. Each lab group will observe the gene dosage effect in flies from the mixed stocks. These
are F1 and F2 generation flies from the following cross: apricot eyes crossed to white eye
(crossed to white so that we can see apricot as apricot is dominant to white, but recessive
to wild type). This cross was not performed with virgin females, and males and females
of each phenotype were in the same vial, so the offspring are not all of the same
genotype. Carefully sex, observe, count, and record the differing phenotypes of at least
25 different flies, noting when the females and males differ in their phenotypes.
Compare these to the true breeding stocks, if necessary. In the mixed apricot stocks, you
will be able to find a heterozygous female. What does the heterozygous female look
like? How do you know this female is heterozygous? Show this heterozygous female to
your instructor.
Bar
H. Observe the gene dosage effect in the true breeding bar eye flies. For the true breeding
bar eye flies, count and record (draw) the difference in facet number and size of the eyes
between females and males, observing at least 25 different flies. You are looking at the
size and shape of the eyes, not the color. Record (draw) how much smaller the female
eye is. If you observe a male fly with eyes the same size as females’, a wild type fly, or a
female with eyes smaller than other females’ eyes, show these to your instructor.
54
CONDITIONAL (TEMPERATURE SENSITIVE) ALLELE
3. Now observe shibire mutant flies and wild type flies. Do not anesthetize the flies!
A. Record the activity pattern of both flies stocks at room temperature.
B. Now we will warm up the wild type flies and the shibire mutants. Carefully time and
record how long it takes for the shibire mutants to fall to the bottom of the vial and
become paralyzed. Compare the shibire mutant activity to wild type.
C. Then we will return the shibire and wild type flies to room temperature. Carefully time
and record how long it takes for the shibire mutants to resume wild type activity.
Questions to be answered in your notebook:
1. Why did the eyeless and lobe true breeding stocks show such variability of phenotype?
2. At the molecular level, what do you think is causing the phenomenon of variable
expressivity? Answer in terms of protein function at a cellular or organ level.
3. At the molecular level, what do you think is causing the phenomenon of incomplete
penetrance? Answer in terms of protein function at a cellular or organ level.
4. What is the gene dosage effect? How does it differ between males and females? At the
molecular level, what is causing the phenomenon of gene dosage?
5. Design a series of crosses in which you can tell a fly with a lobe allele but wild type
phenotype from a true wild type fly.
6. What does hemizygous mean?
7. For the multiple alleles, white is a total loss of function allele and the wild type (red) codes
for a fully functional protein. What do you think is happening at the molecular, cellular, and
organ (eye) level in the apricot and eosin mutants? Describe what you think is occurring as it
relates to protein activity/function.
8. Eosin, apricot, white, and wild type are all alleles of the same gene. You know that wild type
is dominant over all other alleles and white is recessive to all other alleles. Design a cross or
series of crosses that would allow you to determine whether eosin is dominant over apricot
(or vice versa).
9. In the true breeding stocks, why did the female eosin mutants have darker eyes than the eosin
males? Answer in terms of protein levels as they relate to activity/function.
10. Why do the true breeding flies with apricot eyes have the same color eye regardless of sex,
when apricot is X-linked? HINT: Think about dosage compensation in flies. Answer in
terms of protein levels as they relate to activity/function.
11. In the mixed eosin stocks, you will be able to find a heterozygous female. How can you tell
the female is heterozygous? Why does she look that way? What are her protein levels?
How do they compare to the homozygous female and the hemizygous male? How do her
protein levels relate to activity/function/phenotype?
12. In the mixed apricot stocks, you will be able to find a heterozygous female. How can you tell
the female is heterozygous? Why does she look that way? What are her protein levels? How
do they compare to the homozygous female and the hemizygous male? How do her protein
levels relate to activity/function/phenotype?
13. Why were eosin and apricot crossed to white rather than wild type?
14. Why don’t all X-linked genes demonstrate the gene dosage effect? Answer in terms of
protein levels and protein activity/function in Drosophila.
55
15. Bar is a gain of function mutation. What is a gain of function mutant? How do you think the
dominant gain of function bar protein is working in the cell?
16. Why, in the true breeding bar eyed stocks, do females have less facets than males? How do
you think the protein is working? What are the protein levels in the hemizygous male and
the homozygous female?
17. Describe how the bar eye phenotype is governed by the gene dosage effect.
18. It is possible that you could find a wild type fly, a male fly with the female eye phenotype, or
an ultrabar female. Why is this the case? In each of these cases what would the protein
levels be?
19. Which phenotype(s) was/were the hardest to score? Why?
20. In this experiment, we looked at some mixed stocks and some true breeding stocks. Why do
geneticists use true breeding stocks rather than mixed for their experiments?
21. What does restrictive temperature mean? What does nonrestrictive temperature mean?
22. What function does the protein dynamin specifically perform in the cell?
23. What is happening to the dynamin protein in the shibire mutants at the molecular level at the
restrictive and nonrestrictive temperatures? Think in terms of protein structure, function, and
activity.
24. Find and describe one other human conditional allele (not PKU).
Special thanks to Dr. Deutch for the initial idea for this lab.
56
Lab Five: Chromosomal Structure in Wild Type and Abnormal
Cells
Objectives for both parts:
1. be able to read and follow a protocol with minimal supervision from your instructor.
2. be able to manage your time in lab when several activities must be performed in one lab
period.
Part 1: Barr Body Structure
Modified from Carolina Biological Supply Company Cellular Gender Kit В©
Objectives:
You should be able to:
1. perform the procedure for preparing a microscope slide of human squamous epithelial cells
to demonstrate sex chromatin.
2. Identify nuclei with and without sex chromatin present.
3. describe the relationship between the number of X chromosomes present in the nucleus of a
human cell and the number of sex chromatin bodies evident in that nucleus.
In 1949, Murray Barr and Ewart Bertram were studying the structure of cat motor neurons and
noticed that there was a clear structural distinction between the cells of the male and the female
feline. The nerve cells of the female cat, in over 30% of the cases, had a well-developed darkly
staining spot, located next to the nucleolus; while the male cats rarely had such a dark spot.
Indeed, Barr and Bertram were able to determine the sex of nerve cells from samples of which
they had no prior knowledge just by looking for this morphological difference. They also
noticed this darkly staining body in human cells and postulated that it could be related to the
number and type of sex chromosomes in each gender, i.e. males with an X and an Y and females
with two Xs (Barr and Bertram, 1949, Nature 163: 676-677).
This chromatin structure, now referred to as the sex chromatin or Barr body is present in
female cells but is absent in male cells. Females have two X chromosomes and during
embryogenesis one is “inactivated”, or formed into a structure of highly compacted chromatin
that has almost no transcription associated with it. Compacted chromatin is also known as
heterochromatin and is a general mechanism for widespread transcriptional silencing. Once an
X chromosome has been inactivated, the heterochromatin state of that X chromosome is kept
throughout the life of the cell. Heterochromatin is replicated later in the cell cycle than
euchromatin (chromatin that is not highly compacted and is often transcribed) and the
heterochromatin state is passed down during mitosis, so that in all wild type human females,
there is one active and one inactive X chromosome.
Chromosomal differences between males and females causes X inactivation to occur. Males
only have one X chromosome, but females have two. However, both males and females need the
same amount of gene expression from the X chromosome. The X chromosome is inactivated in
female mammals and marsupials to allow for the same amount of gene expression in both males
and females from the one active X chromosome. This is called dosage compensation.
57
Barr Bodies and Nuclear Sex
Chromatin bodies resembling Barr bodies are occasionally observed in tissues from males. The
statistical incidence of what appears to be sex chromatin in male cells normally ranges from 02% in oral smears. In fact, for an accurate determination of nuclear sex, a statistically significant
number of cells must be examined and the percentage of cells having sex chromatin computed.
For oral smears made from females, most investigators find that between 10% and 20% of the
healthy cells demonstrate sex chromatin. Only normal-looking nuclei that stain evenly should be
scored. Nuclei that are folded, have a granular-looking nucleus, or demonstrate any sign of
degeneration cannot be included in a critical study.
Drumsticks and Nuclear Sex
Besides Barr bodies in epithelial cells, another visible difference between male and female cells
can be seen in the white blood cells, specifically the neutrophils. In females, a structure known
as a drumstick can be seen protruding from the multi-lobed nuclei. This drumstick is the
chromosomal material from the X chromosome that has been inactivated. When examining the
typical blood smear, there are relatively few white blood cells. In the white blood cells present,
not all are fixed at an angle allowing the drumstick to be seen. So, although the drumstick is a
definitive marker of a female neutrophil, it may take looking at a number of cells before this
structure can be seen (generally less than 30% of cells exhibit drumsticks).
You will now obtain a cheek smear and observe your sex chromatin profile, as well as study the
structure of the nuclei of neutrophils from male and female humans. You will choose two
staining techniques and compare them.
Materials:
compound microscope
1% methylene blue
pasteur pipettes
70% ethanol spray bottle
demo slides
wooden stick
0.03% methylene blue
microscope slides
di water stray bottle
1% crystal violet stain
2% orcein/45%acetic
stain
glass coverslips
staining trays
acid
Methods:
Obtaining the smear
1. Due to the variable nature of slide preparation, you are STRONGLY encouraged to make
several slides (3-5) simultaneously rather than make one slide and then notice it didn’t work
and have to and have to start over from scratch!
2. You may experience two difficulties in preparing a suitable smear from the oral mucosa. If
the slide is not scrupulously clean, the epithelial cells will be lost in the course of the staining
procedure. Consequently, the slides should be washed in a detergent, rinsed thoroughly in
distilled water, and given a final rinse in 70% ethyl alcohol. Then air dry the slide. From
then on, handle the slide by its edges only.
3. A second problem, which is more difficult to overcome, is that of contamination of the
epithelial cells by oral bacteria. Bacteria are especially troublesome, because they stain
readily and may be confused with Barr bodies if, by chance, they are superimposed on the
nucleus of an epithelial cell. To remedy this problem, cell donors should vigorously rinse
58
their mouths with water from the water fountain to remove loose epithelial cells and bacteria.
This rinsing should be repeated two or three times for best results.
4. The smear is prepared by gently scraping the lining of the cheek with a wooden stick and
smearing the material obtained on your clean slide. Do not scrape so vigorously that you
draw blood. You must be able to see cells on the slide before proceeding. The slide should
be air dried for at least 30 seconds and the processed according to the following directions
Staining and Mounting
5. Place the slide on a staining tray, cover the smear with a stain and allow to stain for 2
minutes.
6. Remove excess stain by rinsing briefly with water from a spray bottle.
7. Blot around the smear with a Kimwipe to remove excess water.
8. Allow cells to dry for 1 minute.
9. Place a coverslip on top of the cells.
Microscopic Analysis
10. Examination of smears prepared in this way should reveal cells with light blue to virtually
colorless cytoplasm and a darker blue nucleus. The Barr bodies are seen most frequently
located adjacent to the nuclear membrane and should be stained a darker color. Locate cells
to be examined with the low-power objective; then check for sex chromatin using the oilimmersion objective. Carefully avoid getting anything on the microscope objective.
Answer the following questions and complete the following exercises in your notebook:
1. Look at the instructor’s example of female epithelium to see what a Barr body should look
like. Then examine 50 squamous epithelial cells from a human female. Look at several
different people’s slides, if possible. Look at all the staining types.
a. How many cells from the 50 you counted exhibit sex chromatin (Barr bodies)?
b. What percentage of these 50 cells reveal sex chromatin?
c. Is this more or less than you expected? Why?
d. Which stain worked the best? Why do you say that?
2. Now examine 50 squamous epithelial cells from a human male. Look at several different
people’s slides, if possible. Look at all the staining types.
a. What is the incidence of Barr bodies among 50 cells obtained from these males?
b. Which stain worked the best? Why do you say that?
3. Did you find any cells of the human female that appear to have more than one sex chromatin
body?
4. Draw an example of a cell from a female (with Barr body evident and identified) and an
example of a cell without a Barr body from a male.
5. Why didn’t you see Barr bodies in each of the female cells you looked at?
6. Why is it possible that you might see a cell with a Barr body from a wild type male?
7. Now look at the example of the drumstick from a female neutrophil on the instructor’s slide
and compare it with the blood smear from the male. Draw a picture of both, indicating the
drumstick in the female.
8. Refer to your textbook in seeking answers to the following questions.
a. Which of the individuals depicted in Table 1 has classical Turner syndrome?
b. Which has classical (the most common form of) Klienfelter syndrome?
c. Which individuals might be regarded as metafemales?
59
9. Describe the other type(s) of epigenetic inheritance and how they affect phenotype and
genotype.
10. The normal human female has a somatic chromosome complement of 46, consisting of 44
autosomes and two X chromosomes; the normal male has 44 autosomes plus an X
chromosome and a Y chromosome. On the basis of this information, copy the table on the
next page into your notebook and complete it, using your book if necessary, indicating the
probable sex chromosome complement and the total number of chromosomes anticipated in
the somatic cells of the individual (assuming the presence of the normal 44 autosomes).
Table 1. Sex Chromatin and Its Relationship to Sex Chromosome Complement and
Chromosome Number
Number of Barr
Bodies Observed in
Somatic Cells
0
0
1
1
2
2
3
3
Phenotypic Sex of
Individual from
Whom Cell Was
Obtained
Male (wild type)
Female (abnormal)
Male (abnormal)
Female (wild type)
Male (abnormal)
Female (abnormal)
Male (abnormal)
Female (abnormal)
Probable Sex
Chromosome
Component
Total Number of
Chromosomes in
Somatic Cells
Part 2: Chromosomal Structural Aberrations in a Cancer Cell Line
adapted from CellServ@FAES/NlH (www.cellservkits.com)
Objectives:
You will learn how to:
1. fix, stain, and visualize human chromosomes mounted on microscope slides.
2. recognize two chromosomal features: sister chromatids and centromeres.
3. recognize size differences among human chromosomes.
4. recognize the three basic human chromosome morphologies based on centromere position:
metacentric, submetacentric, and acrocentric.
Each somatic cell in the human body contains 23 pairs of chromosomes. During the interphase
stage of the cell cycle each of these chromosomes is duplicated and consists of two chromatids
joined by a common centromere (spindle attachment region). During mitosis the chromatids
separate and become independent chromosomes that move to opposite ends of the cell. The
subsequent division of the cytoplasm results in the formation of two new daughter cells each
containing the same diploid number of chromosomes as the parent cell. Cells grown in tissue
culture are used for most human chromosome studies. For this exercise, a human tumor cell line,
HeLa, (which is highly aneuploid), is grown in culture and subsequently treated so as to allow
for the microscopic examination of the chromosomes. Colchicine, a plant alkaloid, has the
unique property of arresting cells in metaphase of the mitotic cycle by interfering with formation
60
of the mitotic spindle that is needed for the movement of chromosome during the metaphase to
anaphase progression. This blockage increases the frequency of metaphase cells. Metaphase
chromosomes are most readily observed with the light microscope and various chromosomal
features such as sister chromatids and centromeres are evident. In summary, the procedure for
chromosome visualization (and karyotyping) entails arresting a fraction of a log phase population
in metaphase, treating the cells with a hypotonic saline solution to swell the cells and increase
their fragility, fixation with acetic acid-methanol, splattering onto slides, and staining. This is
followed by a search for ideal chromosome spreads for the study of chromosome number and
structure.
The 46 chromosomes and mitochondria located in each somatic cell of the human body contain
the entire human genetic complement. Located within the nucleus, these 23 pairs of homologous
chromosomes are comprised of 22 pairs of autosomes (non-sex chromosomes) and 1 pair of sex
chromosomes (XX or XY). The genetic material, or DNA (deoxyribonucleic acid), exists within
the chromosomes and contains the entire genetic blueprint for development of an individual. It
exists in a highly coiled and condensed state, due in part to the action of a class of DNA binding
proteins called histones. All normal human cells contain identical numbers and types of
chromosomes. Aberrations in the chromosomal number and/or structure will most likely result
in some type of genetic defect. The analysis of human chromosomes has allowed researchers to
identify specific genetic diseases and abnormalities that are attributed to this disruption in the
normal complement and structure of the chromosomes. Each chromosome pair contains unique
physical attributes which distinguishes them from all others. The three main criteria used to
distinguish and identify individual chromosomes are:
length of the chromosome
position of the centromere (the primary constriction)
staining (banding pattern of a chromosome when exposed to stains)
Using these criteria, cytogeneticists (individuals who analyze and research chromosome structure
and function) have set up a classification system for chromosomes which labels each
chromosome with a number, or for the sex chromosomes, as X or Y. This system of
standardization allows for accurate communication among scientists.
Many genetic diseases have been associated with a specific change or abnormality within the
chromosomes. These abnormalities can include: an increase or decrease in the amount of
chromosome material or the translocation of one piece of a chromosome to another chromosome.
Several kinds of cancer are associated with chromosomal abnormalities. Some examples of
genetic diseases and their respective chromosomal aberrations are:
1. Down Syndrome - characterized by an extra chromosome #21 (trisomy 21).
2. Cru du Chat - characterized by a deletion of the short arm of chromosome #5.
3. Turner's Syndrome - characterized by the absence of one X chromosome; these
females only have 45 chromosomes.
On the other hand, there are many genetic diseases that result from a defect within a particular
gene. The abnormal genotype may result in an abnormal phenotype. Such defects may be more
subtle and more difficult to analyze. Recent advances in recombinant DNA technology and
61
genetics, however, have allowed researchers to identify specific locations of genes on
chromosomes. This information is useful for researchers from around the world who are
constructing a genetic map of the human genome. Although the human genome sequence has
been “officially completed”, work is ongoing to continue to refine and correct mistakes in the
initial analysis.
In order to analyze an individual's chromosomes, or prepare a karyotype, the chromosomes must
be in a state in which they can be easily observed. This is accomplished by treating the cells
with a chemical called colchicine. The action of colchicine causes the arrest of mitosis in the
metaphase stage of the mitotic cycle. It is during this stage that the chromosomes are in their
most condensed state and the most visible with the light microscope. Once the cells have been
"arrested" in metaphase, the cells are placed in a hypotonic solution. Since the osmotic pressure
is greater inside the cell as compared to the outside, water will enter the cell until a state of
equilibrium between the cell and its environment has been reached. Movement of water into the
cells causes the cells to swell in size. The hypotonic solution is then replaced with a fixative that
preserves the existing cell architecture. The cells are now ready to be "splatted" onto microscope
slides, stained, and observed. When preparing a karyotype, the investigator will take a
photograph of a chromosome spread that shows clear and distinct chromosomes. The
photograph is enlarged and the individual chromosomes are cut out and arranged based on the
physical criteria stated earlier (size, centromere location, and banding patterns). This
representation of an individual's chromosomes is called an idiogram and is pictured in Figure 1.
One practical application of karyotype analysis is in the early detection of genetic defects
through amniocentesis. In this process some of the amniotic fluid surrounding the fetus is
removed by a physician. This fluid contains fetal cells that will propagate under very specific
laboratory conditions. Once the cells have increased in number a karyotype can be performed on
these fetal cells. The results of the karyotype analysis may alert the physician to potential
problems or abnormalities of the fetus. In karyotyping not involving fetuses the cell type most
often used for analysis are lymphocytes. As with fetal cells these cells are grown in culture,
treated with hypotonic solution, and fixed prior to performing a karyotype.
In this exercise, the human tumor cell line, HeLa, is used for karyotyping. The HeLa cell line
originated in the early 1950’s from the cancerous cervical cells of a woman named Henrietta
Lacks. Prior to her death, some of the cancerous (tumor) cells were removed from her body and
grown in culture. The cells were allowed to divide repeatedly in this artificial culture
environment and resulted in formation of what is known as a cell line. These HeLa cells (the
abbreviation coming from Henrietta Lacks) live on today and are used for research on cell and
tumor growth. They are also useful for showing chromosomal structure in the biology lab.
Because the cells are of tumor origin they have continued to divide and multiply over the last 35
years and will continue to do so for an indefinite period of time. Furthermore, since these cells
are of tumor origin, they will not contain the normal diploid number of chromosomes
characteristic of human beings (46). Instead, these cells are considered aneuploid and generally
possess a chromosome number greater than the diploid number, with three, four, five, or more
copies of a particular chromosome being present in some cells. When you make a chromosome
count of your spreads you may find chromosome numbers of 50 to 60 per cell, or more (see
Figure 2 for an example of one cell’s chromosomal components)! You might also see cells with
62
less than the normal diploid number, as sometimes chromosomes will fuse together to form one
very large chromosome.
Figure 1. An idiogram of a human metaphase arrested cell.
HeLa cells, a human tumor cell, shows the typical aneuploid condition common to transformed
cells. Normal human diploid cells will contain 46 chromosomes but it is evident that this cell
shown in Figure 2 below contains more than that number. Note the typical chromosome
structure with the centromere evident in each chromosome. The sister chromatids are also
evident. The position of the centromere is used to classify chromosomes as either: metacentric,
submetacentric, acrocentric. A chromosome of a fourth category, telocentric chromosome, has
the centromere terminally situated. However, there are no NORMAL human telocentric
chromosomes. Close examination will show the presence of all four types in Figure 2.
Figure 2.
Representative HeLa cell
chromosome spread, note
the aneuploidic nature and
the
telocentric
chromosomes.
63
1
2
3
4
1. Metacentric Chromosome:
centromere is centrally situated.
2. Submetacentric: centromere
is moderately off center.
3. Acrocentric: centromere is
grossly off-center.
4. Telocentric: centromere is
terminally situated.
Figure 3. Centromere location.
Materials:
microscope slides
Pasteur pipettes
Stain #1
Stain #2
glass coverslips
compound microscope
Karyotype slides from wild type humans
tube of cells
Permount (mounting medium)
forceps
Methods, One Slide Made per Lab Group:
1. Due to the variable nature of slide preparation, you are STRONGLY encouraged to make
several slides (3-5) simultaneously rather than make one slide and then notice it didn’t work
and have to and have to start over from scratch!
2. Wash your slide with soap and water and then dry thoroughly.
3. Place the slide vertically at a 45o angle.
4. With a pipette, gently resuspend the cells in the tube provided. Remove a small sample of
cell suspension with a pipette and hold the pipette at least 2 feet above the slide. Allow one
drop of cell suspension to "splat" onto the slide about 3/4 inch from the upper end and tumble
down the slide. Carefully apply 6 - 8 more drops from various heights, one drop at a time,
onto the same region of the slide. It is important to release the cell suspension ONE DROP
AT A TIME. Do not expel all of your cell suspension in one squirt, or you will obtain poor
results. Gently blow across the slide for 2 - 3 seconds. The drying will help "spread" the
chromosomes. Mark on which side of the slide you have dropped the cells.
5. Allow the cells to AIR DRY COMPLETELY.
6. Dip (using forceps) the slide into the tube containing STAIN #1 for 1 SECOND ONLY.
Remove the slide and dip into STAIN #1 again for 1 SECOND ONLY. Remove the slide
and dip into STAIN #1 again for 1 SECOND ONLY.
7. Drain off stain and dip the slide into tube containing STAIN #2 for 1 SECOND ONLY.
Remove the slide and dip into STAIN #2 again for 1 SECOND ONLY. Remove the slide
and dip into STAIN #2 again for 1 SECOND ONLY. Caution should be taken to avoid
carryover of stains (wipe the bottom of slide with a paper towel before transferring).
8. Remove slide from stain and thoroughly rinse with distilled water.
9. Add a coverslip and begin to view your slide.
10. Under low power, scan your spread for cells that appear to have ruptured and released their
chromosomes. Shift to 400X to examine your spread more carefully. An ideal chromosome
spread will contain chromosomes which appear distinct, do not overlap with adjacent
chromosomes, and whose sister chromatids are separate and distinct (see Figure 1). This
exercise requires careful observation so take your time when viewing.
11. Once you have found what appears to be a clear and distinct set of chromosomes, place a
64
small drop of immersion oil on the coverslip over that area and switch to 1000X. You will
need to find TEN total ruptured cells for analysis in the questions section.
12. After you have completed answering questions 1-4 in your notebook, look at one of the
demonstration slides of wild type human chromosomes (male or female, your choice), and
then answer questions 5 and 6. You will need to find THREE representative well spread
nuclei to answer questions 5 and 6.
Questions to answer and exercises to do in your notebook:
1. Count the number of chromosomes present in TEN different cells on the slide and try to
identify and locate the characteristic chromosomes based on the location of the centromere.
Remember that this cell line is aneuploid and each cell should contain a different number of
chromosomes, each different than the diploid number (46). Fill out the following table in
your notebook for each of the TEN cells:
Total number
of
Chromosomes
per cell
Number of
Metacentric
Chromosomes
Number of
Submetacentric
Chromosomes
Number of
Acrocentric
Chromosomes
Number of
Telocentric
Chromosomes
Cell one
Cell two
etc
2. When you have completed the table in question one, calculate the average number of
chromosomes per cell. Then calculate the average of each of the chromosome types. Fill out
the following table in your notebook:
Average number
of Chromosomes
per Ten Cells
Average Number
of Metacentric
Chromosomes
Average Number
of
Submetacentric
Chromosomes
Average Number
of Acrocentric
Chromosomes
Average Number
of Telocentric
Chromosomes
3. Draw THREE representative cells from the HeLa sample with well spread chromosomes.
4. Document and label the number of chromosome types in one representative cell DRAWN IN
QUESTION NUMBER THREE.
5. From one wild type human slide, look at THREE representative cells and count the
chromosomes from the three cells and fill out the following table in your notebook:
Total number
of
Chromosomes
per cell
Number of
Metacentric
Chromosomes
Number of
submetacentric
Chromosomes
Number of
Acrocentric
Chromosomes
Number of
Telocentric
Chromosomes
Cell one
Cell two
Cell three
6. Draw ONE representative cell from the wild type slide.
7. In the wild type cells, did you see 46 chromosomes, or a different number? If you saw a
different number that 46, why do you think you saw a different number (remember these are
wild type cells)?
65
8. Specify the location and function of the centromere.
9. Why is it necessary to expose the cells to a hypotonic solution when preparing cells for
karyotyping?
10. Define the role of histones in the chromosomes.
11. Explain the difference between an aneuploid cell, a haploid cell, and a diploid cell.
12. During which stage of mitosis are the chromosomes in their most condensed state and thus
best suited for karyotyping? Why is this so?
13. Name the three types of chromosomes found in NORMAL human cells based on the location
of the centromere.
14. State and describe an example of a genetic disease (not mentioned in this exercise) that is
caused by an abnormal chromosomal condition.
15. How do you think the HeLa cells acquired telocentric chromosomes?
16. How do you think the HeLa cells became aneuploid?
References:
1. Celis, J.E., editor. Cell Biology: A Laboratory Handbook, Volumes 1-3, 1994. Academic
Press, New York.
2. Freshney, R.I. Culture of Animal Cells. Third Edition, 1994. Wiley-Liss, New York.
3. Freshney, R.I. Culture of Specialized Cells. series editor. Wiley-Liss, New York. The
series includes Culture of Epithelial Cells, Culture of Hematopoietic Cells, and Culture of
Immortalized Cells.
4. Goldberg, A. and J. Frazier, “Alternatives to Animals in Toxicity Testing.” Scientific
American, August 1990, pages 24 - 30.
5. Holbrook, N.J., G.R. Maring, and R.A. Lockshin, editors. Cellular Aging and Cell Death.
1996. Wiley-Liss, New York.
6. Jones, G.E., editor. Human Cell Culture Protocols. 1996. Humana Press, Totowa, New
Jersey.
7. Liddel, J.E. and A. Cryer, Practical Guide to Monoclonal Antibodies. 1991. John Wiley &
Sons, Chichester.
8. Nardone, R.M. “Cell Culture Methodology From Donor to Cell Lines.” 1987.
BioTechniques 6:122-127.
9. Pollard, J. and J. Walker, editors. Animal Cell Culture. 1990. Humana Press, Clifton, New
Jersey.
10. Rothblat, G. and V. Cristofalo, editors. “Toxicity testing in vitro.” Nardone, R.M. 1977. In
Growth, Nutrition, and Metabolism of Cells in Culture. pages 471-495. Academic Press,
New York.
11. Schaeffer, W. “Usage of Vertebrate Cell, Tissue and Organ Culture Terminology.” 1979. In
Vitro 15:649-653.
12. Thompson, J. and M. Thompson, Genetics in Medicine, 3rd Edition. 1980. W.B. Saunders
Company, Toronto.
13. U.S. Congress, Office of Technology Assessment, “Alternatives to Animal Use in Research,
Testing and Education.” Washington, D.C., U.S. Government Printing Office, OTA-BA273, February, 1986.
14. Williams, G., V. Dunkel, V. Ray, editors. Cellular Systems for Toxicity Testing. 1983.
Annals of the New York Academy of the Sciences, Volume 407.
66
© Copyright 2026 Paperzz