Genealogical Discontinuities among Etruscan, Medieval, and Contemporary
Tuscans
Silvia Guimaraes,* Silvia Ghirotto, Andrea Benazzo, Lucio Milani,* Martina Lari,* Elena Pilli,*
Elena Pecchioli,à Francesco Mallegni,§ Barbara Lippi,§ Francesca Bertoldi,k Sauro Gelichi,k
Antonella Casoli,{ Elise M.S. Belle, David Caramelli,* and Guido Barbujani *Dipartimento di Biologia Evoluzionistica, Laboratorio di Antropologia, Università di Firenze, Firenze, Italy; Dipartimento di
Biologia ed Evoluzione, Università di Ferrara, Ferrara, Italy; àCEA, Centro di Ecologia Alpina, Fondazione Edmund Mach, Trento,
Italy; §Dipartimento di Biologia, Università di Pisa, Pisa, Italy; kDipartimento di Scienze dell’Antichità e del Vicino Oriente,
Università di Venezia, Venezia, Italy; and {Dipartimento di Chimica Generale e Inorganica, Chimica Analitica, Chimica Fisica,
Università di Parma, Parma, Italy
The available mitochondrial DNA (mtDNA) data do not point to clear genetic relationships between current Tuscans and
the Bronze-Age inhabitants of Tuscany, the Etruscans. To understand how and when such a genetic discontinuity may
have arisen, we extracted and typed the mtDNAs of 27 medieval Tuscans from an initial sample of 61, spanning a period
between the 10th and 15th century AD. We then tested by serial coalescent simulation various models describing the
genealogical relationships among past and current inhabitants of Tuscany, the latter including three samples (from Murlo,
Volterra, and Casentino) that were recently claimed to be of Etruscan descent. Etruscans and medieval Tuscans share
three mitochondrial haplotypes but fall in distinct branches of the mitochondrial genealogy in the only model that proved
compatible with the data. Under that model, contemporary people of Tuscany show clear genetic relationships with
Medieval people, but not with the Etruscans, along the female lines. No evidence of excess mutation was found in the
Etruscan DNAs by a Bayesian test, and so there is no reason to suspect that these results are biased by systematic
contamination of the ancient sequences or laboratory artefacts. Extensive demographic changes before AD 1000 are thus
the simplest explanation for the differences between the contemporary and the Bronze-Age mtDNAs of Tuscany.
Accordingly, genealogical continuity between ancient and modern populations of the same area does not seem a safe
general assumption, but rather a hypothesis that, when possible, should be tested using ancient DNA analysis.
Introduction
The Etruscan culture is documented in Etruria, now
Central Italy, from the eighth century BC. When, in the first
century BC, the Etruscans obtained Roman citizenship,
their language and culture vanished from the archaeological
record. Although they never formed a political unit, the
Etruscan communities shared a non-Indoeuropean language and a religion, and exerted a crucial cultural and political influence in the Mediterranean area. According to
ancient historians, the Etruscans did not resemble anybody
else in their language, lifestyle or customs (Barker and
Rasmussen 1998), and their evolutionary relationships
with other Bronze-Age people are unclear. Dyonisius of
Halicarnassos, a Greek historian, regarded them as an
autochthonous population; conversely, Herodotus and the
Roman historian Livy thought that they immigrated in
Etruria but disagreed on their provenance; from Lydia
(in Anatolia, now a part of Turkey) according to Herodotus,
from across the Alps according to Livy. No modern archaeologist would accept the view that the Etruscan population immigrated en masse from far away (Barker and
Rasmussen 1998). However, Herodotus’ and Livy’s stories
may reflect, albeit overemphasizing it, a process of population contact that might have involved gene flow and
admixture and therefore might have left a genetic trace.
In 2004, we published the first genetic analysis of the
Etruscans (Vernesi et al. 2004), namely, 27 mitochondrial
DNA (mtDNA) sequences from an initial sample of 80,
Key words: ancient DNA, mitochondrial DNA, coalescent simulations, genealogies.
E-mail: [email protected].
Mol. Biol. Evol. 26(9):2157–2166. 2009
doi:10.1093/molbev/msp126
Advance Access publication July 1, 2009
Ó The Author 2009. Published by Oxford University Press on behalf of
the Society for Molecular Biology and Evolution. All rights reserved.
For permissions, please e-mail: [email protected]
after specimens not complying with the strictest standards
for ancient DNA analysis (Cooper and Poinar 2000) were
eliminated. The contemporary population most closely related with the Etruscans were the inhabitants of the same
area, the Tuscans. However, only two haplotypes were
shared between them, and these haplotypes are actually common all over Europe. Genetic similarities between the Etruscans and the current population of Turkey, but not with Italian
populations other than Tuscans, were also evident (Vernesi
et al. 2004). Later, we showed by computer simulations based
on the coalescent theory that these data do not support a direct
genealogical continuity between the Etruscans and two
Tuscan samples (or the samples from Turkey) (Belle et al.
2006). In short, the questions of the Etruscans’ origins and
evolutionary relationships remained open, and new questions
emerged concerning their fate after the first century BC.
Genealogical discontinuity may result from a number
of phenomena, ranging from the Etruscans’ extinction to
a deep dilution of their genetic features due to extensive input of immigrants or mass emigration after the Roman assimilation. However, a third, and simpler, explanation was
proposed by Achilli et al. (2007), who observed similarities
between the contemporary mtDNAs of Turks and three samples of Tuscans. They interpreted this finding as evidence of
a common descent of these populations from Etruscan ancestors. To account for the low haplotype sharing between
contemporary people and the Etruscans, Achilli et al. (2007)
invoked unspecified technical errors in the ancient sequences, concluding that the Etruscans’ DNA may be misleading
if one is to understand the Etruscans’ origins.
Recently, the Etruscan data set was reexamined using
a new Bayesian approach designed to identify excess mutation in ancient DNA data, likely resulting from laboratory
errors or postmortem DNA degradation. No evidence was
found that the available sequences might be biased (Mateiu
2158 Guimaraes et al.
Table 1
Samples Analyzed by Locality and Sample Size Variation at the Various Stages of the Validation Procedure
Age (AD)
Initial numbera
Amino acid racemizationb
Amplificationb
Cloningb
Sequencingb
Final numberc
Haplotype coded
a
b
c
d
Firenze, Piazza
Signoria
Pisa,
Vicopisano
Livorno, Castello
Donoratico
Massa Carrara,
Fivizzano
Siena, Santa Maria
della Scala
Grosseto,
San Quirico
1,100–1,300
22
0
12
0
0
10
F1–F10
900–1,100
13
0
5
2
0
6
P1–P6
1,200–1,400
7
0
3
0
1
3
L1–L3
1,300
8
0
4
0
1
3
M1–M3
1,200–1,300
9
0
3
0
2
4
S1–S4
1,200–1,400
2
0
1
0
0
1
G1
Initial sample size by archeological site.
Number of samples that did not pass the relevant biochemical test, and therefore were excluded from the successive steps of the analysis.
Final number of samples for which a mtDNA sequence could be obtained.
Individual code by which the haplotypes will be referred to in the text.
and Rannala 2008). Therefore, to better understand what
might have happened to the Etruscans’ genetic heritage, in
this study, we collected biological samples in medieval Tuscan cemeteries, to investigate the period between the disappearance of the Etruscan culture and the present. We took
particular care of all possible sources of DNA contamination
due to modern handling of the specimens. We then compared
the mtDNA sequences thus obtained with Etruscan and contemporary sequences by serial coalescent simulations.
Materials and Methods
Ancient Samples
The analyses were conducted on the bone remains
of 61 individuals from 6 localities (Florence, Pisa, Massa
Carrara, Livorno, Grosseto, and Siena), dated between
the 10th and 15th centuries (table 1). All samples were retrieved recently, except those from Florence, excavated and
initially processed 3 years ago; their powdered bone was
kept at 20 °C until experiments were completed. All
bones appeared well preserved and were not washed or manipulated in any way; for each locality, only one archaeologist had any contacts with the bones, packed them in
sterile-sealed plastic bags at the excavation site and sent
them to our laboratory. In contrast with most previous ancient DNA studies, we have complete information on the
handling history of each specimen. The mtDNA sequences
of all the archaeologists and the geneticists who had any
contacts with the samples were typed, so that possible sources of modern contamination can be traced down.
Ancient DNA Analysis: An Overview
DNA extraction, polymerase chain reaction (PCR)
amplification, and analysis of the PCR products were performed in separate laboratory rooms of the Florence laboratory. Specimens were handled using disposable mask,
gloves, and sterile laboratory coats in areas where no contemporary DNA had ever been studied. The DNA extraction and the setting up of PCR reactions of ancient DNA
templates were carried out in two different rooms under
two different hoods, daily irradiated with UV rays (254
nm). All sterile tubes, filtered tips, sterile reagents, and sol-
utions were disposable or exclusively dedicated to ancient
DNA. Different sets of pipettes were used for DNA extraction, PCR amplification and analysis of the PCR products.
Negative controls were included in each set of extractions
and amplifications, PCR products were cloned and an average of 20 clones were sequenced for each individual. In
order to identify sporadic nucleotide substitutions due to
postmortem DNA damage, extracted DNA was treated with
UNG before PCR amplification (see below). The CEA
(Centre for Alpine Ecology, Trento) ancient DNA laboratory independently replicated the entire analysis on some
fragments of selected samples. The sequences obtained
were aligned and compared across clones. The consensus sequences were finally compared with a database of
European mitochondrial sequences to test whether the ancient sequences obtained make phylogenetic sense.
DNA Extraction
After brushing and irradiating each bone surface (1 h
under ultraviolet light), all fragments were manually powdered in a mortar and abundantly washed with bleach and
ethanol. DNA was extracted from the powdered bone by
means of a silica-based protocol (modified from Caramelli
et al. 2007). For each individual, we performed two independent extractions from different bones, usually a rib and
a fragment of a long bone. A negative control was included
for each extraction.
Amino Acid Racemization
About 5 mg of bone powder for each fragment was
used to estimate the degree of amino acid racemization,
an indirect measure of the state of preservation of the sample’s macromolecules, following the procedures recommended by Poinar et al. (1996). The stereoisomers of
aspartic acid, glutamic acid, and alanine were determined
by high performance liquid chromatography.
Uracil-N-Glycosylase (UNG) Treatment
Postmortem hydrolytic deamination of cytosine residues causes the occurrence of uracil in the sequence,
Genealogical Links between Etruscan and Modern Tuscans 2159
resulting in apparent C / T/G / A mutations. UNG excises the uracil, allowing detection of apparent nucleotide
substitutions resulting from postmortem DNA modifications (Dinner et al. 2001; Hofreiter et al. 2001). We treated
10 ll of DNA extracted from both samples with 1 U of
UNG for 30 min at 37 °C. According to the manufacturer’s
instruction, the reaction was performed in standard PCR
buffer (with a 1 composition of 10 mM Tris–HCl, 50
mM KCl, and 1.5 mM MgCl2). After inactivation of the
enzyme for 10 min at 94 °C, the extract was subjected
to the same PCR, cloning, and sequencing conditions as
described below.
Amplification of mtDNA
Two microliters of DNA extracted from the bone was
amplified as follows: 94 °C for 10 min (Taq-polymerase activation), followed by 50 cycles of PCR (denaturation, 94 °C
for 45 s; annealing, 53 °C for 1 min; and extension, 72 °C for
1 min) and final step at 72 °C for 10 min. The 50-ml reaction
mix contained 2 U of AmpliTaq Gold (Applied Biosystems), 200 mM of each deoxynucleotide triphosphate
(dNTP), and 1 mM of each primer. Each extract was amplified at least twice. The 360-bp-long HVR-I was subdivided
into three overlapping fragments using the following primer
pairs: L15995/H16132; L16107/H16261; and L16247/
H16402. Each extract was amplified at least twice.
Cloning and Sequencing
PCR products were cloned using the TOPO TA Cloning Kit (Invitrogen) according to the manufacturer’s instructions. Screening of white recombinant colonies was
accomplished by PCR, transferring the colonies into
a 30-ll reaction mix (67 mM Tris–HCl [pH 8.8], 2 mM
MgCl2, 1 lM of each primer, 0.125 mM of each dNTP,
and 0.75 units of Taq Polymerase) containing M13 forward
and reverse universal primers. After 5 min at 92 °C, 30
cycles of PCR (30 s at 90 °C, 1 min at 50 °C, and
1 min at 72 °C) were carried out and clones with inserts
of the expected size were identified by agarose gel electrophoresis. After purification of these PCR products with Microcon PCR devices (Amicon), a volume of 1.5 ml was
cycle sequenced following the BigDye Terminator kit (Applied Biosystems) supplier’s instructions. The sequence
was determined using an Applied BioSystems 3100
DNA sequencer.
Additional Data
The medieval sequences generated for this study
(hereafter: M data set) were compared with three data sets
of HVR1 DNA sequences, all spanning 360 bp from nucleotide positions 16024–16383. Two data sets, which we treated independently at all stages of the analysis, represent
contemporary Tuscans, and include, respectively, 332 individuals (C1 data set) from Murlo, Volterra, and the Casentino Valley (Achilli et al. 2007) and 49 individuals (C2
data set) from 22 localities (Francalacci et al. 1996). The
authors of both studies stated they planned the collection
of samples so as to select individuals whom they would regard as likely descendants of the Etruscans. The third data
set (E data set) comprises a subsample of Vernesi et al.’s
(2004) Etruscans, namely, 11 individuals from the Tuscan
necropoleis of Volterra, Castelluccio di Pienza, Castelfranco
di Sotto, and Magliano/Marsiliana, dated between first and
seventh century BC (Vernesi et al. 2004).
We excluded from the analysis the nucleotides occupying positions 16180–16188 and 16190–16193, because
they contain two stretches of As and Cs known to result
in apparent length polymorphisms of the mtDNA sequence
(Bendall and Sykes 1995; Bandelt and Kivisild 2005).
Therefore, all summary statistics were inferred from 347
nt, and not 360 nt, positions.
Summary Statistics of Genetic Diversity
Three measures of internal diversity were estimated
for each population using Arlequin v.2.000 (Schneider
et al. 2000), namely, the number of different haplotypes,
the haplotype diversity (or heterozygosity) and the average
pairwise difference for each sample. Matrices of pairwise
Fst distances and haplotype sharing (namely, the number
of haplotypes of the older data set also present in the other
data set, divided by the number of haplotypes in the older
data set) were estimated. These statistics, here referred to as
‘‘observed’’ values, were compared with the ‘‘simulated’’
statistics, generated under various explicit demographic
models.
The Simulations
We generated gene genealogies from which we estimated simulated statistics using a serial coalescence
algorithm, Serial Simcoal (Anderson et al. 2005). All simulations started at generation 0 by reconstructing the genealogy of a sample of 332 or 49 individuals, representing the
contemporary C1 or C2 samples, respectively. The genealogy was then extended backwards in time until it reached
the most recent common ancestor (MRCA) of the female
lineage through a series of coalescence events. The average
generation time was 25 years (Fagundes et al. 2007), and so
27 individuals were added to the genealogy 36 generations
ago (representing the M sample), and 11 individuals were
added 100 generations ago (E sample). Previous work
showed that when the data are temporally clustered, as
in this case, it makes little difference to consider the exact
age of each individual, rather than the sample average
(Belle et al. 2006). Once the MRCA of the whole genealogy
was reached, we assigned an arbitrary 360-bp sequence to
the MRCA and then randomly distributed mutations onto
the tree, under a finite site model with two potential allelic
states at each site. In this way, the simulated sequences
(in fact, strings of 0s and 1s) were arbitrary, but their differences were not, and reflected the effects of the simulated
demographic and evolutionary factors, namely, population
structure, population size and mutation rate. We repeated
the experiment 10,000 times for each demographic model
tested.
2160 Guimaraes et al.
Parameters of the Simulations
Globally, we ran 2 parallel sets of simulation experiments, testing 10 models in which the E and M samples
were compared either with the C1 or the C2 samples.
For models 1–5, we chose a mutation rate of 0.05 per nucleotide per million year, as estimated from phylogenies
(Pakendorf and Stoneking 2005), for models 6–10, we increased the mutation rate to 0.5 per nucleotide per million
year, as estimated from pedigrees (Howell et al. 2003). In
both cases, the transition bias was 0.9375 and the rate heterogeneity parameter 0.26 (Meyer et al. 1999).
The probability of coalescence (i.e., of two sequences
having the same ancestor at the previous generation) is inversely proportional to population sizes. The 2001 census
reports about 3,500,000 individuals living in Tuscany. For
the Etruscans, based on Rasmussen’s (2004) estimate of at
least 300,000 individuals in sixth century Etruria, we calculated a population size for Tuscany around 120,000 individuals. There is no precise estimate of the Medieval
Tuscan population size, but around 5–6 million individuals
lived in Italy in the Middle Age (Giovannini 2001). Assuming that the Tuscan proportion of the whole Italian population was the same as is now, we obtained a figure close to
340,000 individuals. Because we were considering the mitochondrial population size, that is, one-fourth of the autosomal population size, and because about only a third of the
population is effectively reproducing, we divided by 12
those census size figures to obtain the maximum effective
mitochondrial population sizes. We then tried a range of
population sizes, never exceeding the available empirical
estimates. Whenever applicable, we modeled population
growth or decline as exponential. The effect of the plague
epidemics, the so-called black death, which killed an estimated one-third of the Europeans between 1347 and 1352
(Biraben 1979) was incorporated in models 8–10 by simulating a bottleneck at generation 26, followed by exponential population increase.
Evaluating the Goodness of Fit
We estimated the posterior probability of each summary statistic s in a set of simulations, P(s), given the parameters of the simulation, as the two-tailed percentile of
the distribution of simulated values corresponding to the
observed value (Belle et al. 2006). In this way, if the observed value coincided with the median simulated value,
we had P(s) 5 1, and if it fell outside the range of simulated
values we had P(s) 5 0. Because the 12 statistics are not
independent, it was improper to combine them in a synthetic
index of goodness of fit. Therefore, initially, we just
counted how many observed statistics fell into the 95% empirical confidence interval about the median of their simulated counterparts (Belle et al. 2008) and used that number,
n95, for a quick assessment of the plausibility of the model.
To actually test the global fit of each model, we combined the probabilities of the single statistics into a global
P value, by a method that takes into consideration nonindependence of the data (Voight et al. 2005). This was
achieved in five stages, namely 1) We estimated summary
statistics for the 10,000 simulations run under each model;
2) Each summary statistic was then compared with the other
9,999 values, and thus associated with a two-tailed P value;
3) For each model, a new statistic C, combining the P values of the individual statistcs (pi) was calculated as
X
C5 2
lnðpi Þ;
where summation is over the 12 P values; this step was repeated 10,000 times, so as to obtain a null distribution of C;
4) By repeating the same procedure with the observed statistics, we calculated for each model an observed C value,
CO; 5) by comparing CO with the C distribution, we had an
empirical estimate of the posterior probability of the model.
Results
Mitochondrial Variation in Medieval Tuscany
The ratio of D versus L Asp enantiomers was between
0.0082 and 0.0031, all values well below the proposed limit
of 0.10 (Poinar et al. 1996; Serre et al. 2004) and hence
compatible with excellent DNA preservation. Despite this
promising result, only 33 samples, barely more than half of
the total, yielded sufficient amplifiable DNA.
Sequence comparison among clones from different
PCR did not show any consistent C / T/G / A substitutions (supplementary table 1, Supplementary Material online). This is evidence that the UNG treatment was efficient.
Consequently, we can attribute C / T substitutions observed in single clones to replication errors in later cycles
of PCR or in subsequent cloning (Hofreiter et al. 2001).
Conversely, C / T substitutions present in all or in the
vast majority of the clones derived from two or more independent PCRs can be considered with confidence as effective substitutions, not due to DNA damage in the original
template.
At the end of the different stages of the validation procedures, namely, amplification, cloning, and sequencing,
we obtained 360-bp sequences of 31 samples (details in
table 1). In comparing sequences across clones, we attributed to the Taq-polymerase errors nucleotide substitutions
observed in one clone only. Conversely, in two samples,
both from Siena, the repeated occurrence of the same substitution in several (but not all) clones made it impossible to
infer a consensus sequence without ambiguity (Handt et al.
1996) and so we decided to discard them. Similarly, two
samples (from Livorno and Massa Carrara) presented the
same sequence as one of us (SG), raising the possibility
of contamination; also these samples were discarded. In this
way, we introduced a possible bias in the ancient DNA
database. However, SG sequence is rare (it contains one
transversion with respect to the CRS), and hence we believe
that our choice to discard those sequences is conservative.
The remaining 27 medieval sequences (table 2) differ from
those of all personnel who had had any contacts with the
specimens. At least 89.6% of the clones show the consensus
nucleotide at each position, and the estimated rate of Taq
misincorporation is 0.48 substitutions every 1,000 bp within
the first hypervariable region of mtDNA (HVRI). Neither
observation suggests that the templates were damaged.
Thirteen of the 27 haplotypes occurred once in the total sample, 2 occurred twice (samples F4 and L1, and
Genealogical Links between Etruscan and Modern Tuscans 2161
Table 2
Consensus Sequences of the 27 Medieval Tuscans
CRS
F1
F2
F3
M1
P1
P2
P3
S1
S2
S3
F4
L1
F5
P4
F6
F7
F8
F9
F10
G1
L2
L3
M2
M3
P5
P6
S4
1111111111111111
6666666666666666
1111112222223333
1278892267990115
4643933414464185
C T CA T CC T CGCC T T AC
. . . . . . . . . . . . . . . .
. . . . . . . . . . . . . . . .
. . . . . . . . . . . . . . . .
. . . . . . . . . . . . . . . .
. . . . . . . . . . . . . . . .
. . . . . . . . . . . . . . . .
. . . . . . . . . . . . . . . .
. . . . . . . . . . . . . . . .
. . . . . . . . . . . . . . . .
. . . . . . . . . . . . . . . .
. . . . . . . . . . . . .C. .
. . . . . . . . . . . . .C. .
. . . . . . . . . . TTC . . .
. . . . . . . . . . TTC . . .
. . . . . . .C. . . . .C.T
. . . . . . . . .A. . . . . .
. C . . . T . . . . TTC . . .
.C. . .T. . . . . . . . . .
A. . . . . . . . . . . . . . .
. .T. . . . . . . . . . . . .
. . . . . . . . . . . .C. . .
. . . . . . . . . . . . . .T.
. C . . . . . . . . TTC . . .
. . . . . .T. . . . . . . . .
. . . .C. . . . . . . . . . .
. . . . . . . .T. . . . . . .
.C. . . . . . . . . . . . . .
CRS is the Cambridge Reference Sequence.
samples F5 and P4), and one, the Cambridge Reference sequence, was observed 10 times. This frequency (0.37) is
higher than the modern European average, 0.13, but close
to that observed in another ancient population from Italy,
the Nuragic Sardinians, 0.39 (Caramelli et al. 2007). Therefore, although we cannot rule out that three identical sequences in three sites (F1–F3, P1–P3, and S1–S3) come
from maternally related individuals, we decided not to discard any of these sequences in further analyses.
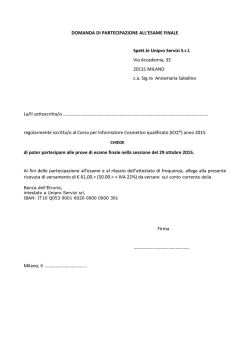
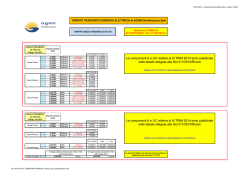
Etruscans have three and two haplotypes in common
with the contemporary Tuscans of the C1 and C2 data sets,
representing 30% and 20%, respectively, of the Etruscan
haplotype pool (fig. 1). Comparable figures are 30% between Etruscans and medieval Tuscans (three haplotypes
in common), 57.1% between medieval Tuscans and C1
and 21.4% between medieval Tuscans and C2 (the denominator of all these figures is the number of different haplotypes in the older sample). The Fst values (table 3) show that
the M sample is not genetically intermediate between the E
and the C samples.
Analysis of Genealogical Relationships by Serial
Coalescent Simulations
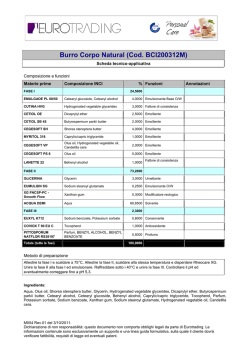
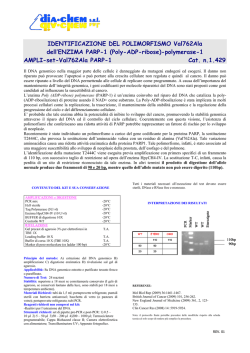
The models tested are summarized in figure 2 and table 4.
The statistics measuring the goodness of fit of each model
(table 5; details in supplementary tables 2 and 3, Supplementary Material online), and the global P values for each
model (table 6) show that in most cases it did not really
matter which contemporary sample was considered,
FIG. 1.—A network summarizing the relationships among the ancient sequences of this study. The size of the circles is proportional to the number
of individuals showing the same haplotype. Black: Medieval Tuscans; Gray: Etruscans. The letters C, M, and V indicate that the same haplotype has
been described in contemporary samples of people from Casentino, Murlo, and Volterra, respectively (Achilli et al. 2007), the figures indicate the
mutated site in the Cambridge reference sequence, minus 16,000.
2162 Guimaraes et al.
Table 3
Observed Summary Statistics in the Etruscan (E), Medieval (M), and Contemporary (C1, C2) Data Sets
Sample size
Haplotype number
Haplotype diversity
Nucleotide diversity
Average pairwise difference
(mismatch)
Pairwise Fst
E
M
C1
C2
Haplotype sharing
E
M
C1
C2
E
M
C1
C2
11
10
0.982 ± 0.046
0.009 ± 0.006
3.345 ± 1.857
27
14
0.86 ± 0.061
0.006 ± 0.004
1.971 ± 1.15
322
154
0.978 ± 0.006
0.012 ± 0.006
4.069 ± 2.035
49
40
0.968 ± 0.019
0.014 ± 0.007
4.757 ± 2.366
0
0.086
0
0.027
0.003
0
0.015
0.009
0
0
1
0.3
1
0.3
0.571
1
0.2
0.214
0.058
1
whether C1 or C2. For both, the differences between observed and simulated data were substantial for the oversimplified model with small populations of constant size
(model 1), and did not decrease when population sizes were
constant and large across the simulation (model 2). Adding
an initial founder effect and a population expansion after the
Middle age (models 3 and 4) did not improve the fit of the
models, so much so that n95, the number of observed statistics falling within the 95% interval about the simulated
median, was lowest for these models.
Conversely, an improvement was observed when the
founder effect was removed while keeping the population
expansion (model 5), and especially by increasing 10 times
the mutation rate (model 6). Under this model, 9 of the 12
simulated statistics became compatible with the observed
statistics when the C2 (but not the C1) sequences were considered. However, in all these cases, the global P value was
still 0, showing that the simulations failed to generate patterns of diversity consistent with those observed in the data.
Using the higher mutation rate estimated from pedigree
studies, in the analysis of the C2 data sets, there was an
improvement of the fit when we added a strong founder effect and a reduced E population (model 7), and even more
so when a bottleneck corresponding to the plague epidemics was added (model 8). However, under models in which
all samples belong to a single genealogy, large departures
from the observed statistics were observed, and for none of
these models was the posterior probability .0.02.
When two distinct genealogies were simulated, separating the contemporary sample from either ancient sample
(Models 9 and 10), the analyses of the two data sets yielded
different results. Indeed, under Model 9, n95 is highest for
both contemporary populations (10), but the global P value
remained 0 for C1, and still significant, although increased,
for the C2 sample. Conversely, despite three simulated statistics differing significantly from the observed data, Model
10 proved globally compatible with the data when C2 (but
not C1) was considered in the comparison. Therefore, the
only way we could reproduce accurately the data is under
Model 10, in which the M sample belongs to the same genealogical branch as the C2 sample, to the exclusion of the
Etruscans.
When the contemporary sample was C1, no set of statistics, generated under any model, proved globally compatible with the observed statistics. A constant problem was
our inability to reproduce the high haplotype number in
FIG. 2.—Graphic outline of the simulated models. Past is at the top, present at the bottom. E 5 Etruscans, M 5 Medieval Tuscans, and C 5
Contemporary Tuscans. Dotted circles represent populations for which there is no available genetic information.
Genealogical Links between Etruscan and Modern Tuscans 2163
Table 4
Summary of the Simulated Demographic Models
Model
1
2
3
4
5
6
7
8
9
10
Parameters
Synthetic Description
NE 5 NM 5 NC 5 30,000, l 5 0.00045
NE 5 NM 5 NC 5 300,000, l 5 0.00045
NE 5 NM 5 NC 5 30,000, l 5 0.00045,
with N 5 1,000 at generation 300
NE 5 NM 5 30,000, NC 5 300,000, l 5 0.00045,
with N 5 1,000 at generation 300
NE 5 NM 5 30,000, NC 5 300,000, l 5 0.00045
Small constant population
Large constant population
Founder effect, small constant population
Founder effect, small constant population between E and M,
expansion between M and C
Small constant population between E and M, expansion between
M and C
5 Model 4, high l
NE 5 NM 5 30,000, NC 5 300,000, l 5 0.0045,
with N 5 1,000 at generation 300
NE 5 10,000, NM 5 30,000, NC 5 300,000, l 5 0.0045,
with N 5 100 at generation 300
NE 5 10,000, NM 5 30,000, NC 5 300,000, l 5 0.0045,
with N 5 100 at generation 300, N 5 10,000 at generation 26
Two genealogies, E and M versus C: NE 5 10,000, NM 5 30,000;
NC 5 300,000, l 5 0.0045, with N 5 100 at generation 300,
N 5 10,000 at generation 26, migration rate 5 0
Two genealogies, E versus M and C: NE 5 10,000,
NM 5 30,000; NC 5 300,000, l 5 0.0045, with
N 5 100 at generation 300, N 5 10,000 at
generation 26, migration rate 5 0
5 Model 6, stronger founder effect, reduced E population
size, high l
5 Model 7, bottleneck at the plague epidemics, high l
Two genealogies, one for E and M, one for C, bottleneck at the
plague epidemics, no migration, high l
Two genealogies, one for E, one for M and C, bottleneck at the
plague epidemics, no migration, high l
E: Etruscans (Vernesi et al. 2004); M: Middle Age Tuscans (this study); C: Contemporary Tuscans; C1 from Murlo, Volterra, and Casentino (Achilli et al. 2007), C2
from 22 localities (Francalacci et al. 1996). In all models tested, the E, M, and C populations were placed, respectively, at generations 100, 36, and 0.
C1 (table 5); even under model 10, the difference between
the observed (154) and the simulated (median 76) haplotype numbers was highly significant. A multiple origin
of the C1 individuals is the simplest way to account for this
observation, and because the C1 sample represents three
different sampling sites (Achilli et al. 2007), this speculation seems plausible. However, previous work (Belle et al.
2006) showed that it is impossible to fit in the same genealogy with the Etruscans even the subset of the C1 sample
for which genetic continuity seemed most likely, Murlo
(Belle et al. 2006). Further analyses of the potential effects
of gene flow are problematic in the absence of detailed, and
currently unavailable, information on the possible sources
of immigrants.
Table 5
Empirical Posterior Probabilities for Each Summary Statistica
Model
1
Analyses with Sample C1
hap_numb (C1)
0.0000
pair_diff (C1)
0.0079
hap_div (C1)
0.0325
hap_numb (M)
0.0254
pair_diff (M)
0.0034
hap_div (M)
0.0000
hap_numb (E)
0.2768
pair_diff (E)
0.0130
hap_div (E)
0.2833
hapShar C-M(M)
0.0004
hapShar C-E(E)
0.0000
hapShar M-E(E)
0.1473
Analyses with sample C2
hap_numb (C2)
0.0001
pair_diff (C2)
0.0116
hap_div (C2)
0.3734
Hap_numb (M)
0.0175
pair_diff (M)
0.0035
hap_div (M)
0.0000
hap_numb (E)
0.2814
pair_diff (E)
0.0118
hap_div (E)
0.2880
hapShar C-M(M)
0.0003
hapShar C-E(E)
0.0050
hapShar M-E(E)
0.1498
2
3
4
5
6
7
8
9
10
0.0000
0.0000
0.0000
0.0000
0.0000
0.0000
0.0411
0.0000
0.0544
0.3922
0.0629
0.0078
0.0000
0.0000
0.0098
0.0000
0.0943
0.0594
0.0000
0.0009
0.0259
0.0508
0.0000
0.0075
0.0000
0.0000
0.0096
0.0000
0.0891
0.0610
0.0000
0.0007
0.0263
0.0079
0.0000
0.0070
0.0000
0.0081
0.0364
0.0384
0.0040
0.0000
0.2754
0.0126
0.2797
0.0000
0.0000
0.1548
0.0015
0.0556
0.4708
0.0014
0.0176
0.0000
0.2749
0.0784
0.2886
0.0485
0.0084
0.3817
0.0000
0.0562
0.0749
0.3119
0.2317
0.3244
0.0226
0.0830
0.1244
0.0115
0.0012
0.1179
0.0000
0.0684
0.0768
0.2176
0.2083
0.2703
0.0251
0.0902
0.1241
0.4157
0.0040
0.1169
0.0000
0.2500
0.0773
0.0680
0.1201
0.0972
0.0591
0.3284
0.1559
0.0000
0.1595
0.1963
0.0000
0.2416
0.0772
0.2367
0.1656
0.2433
0.0477
0.2882
0.1454
0.3409
0.2446
0.0845
0.0038
0.0000
0.0000
0.0000
0.0000
0.0000
0.0364
0.0000
0.0497
0.1645
0.3115
0.0065
0.0000
0.0000
0.0148
0.0000
0.0905
0.0607
0.0000
0.0007
0.0265
0.0088
0.0005
0.0085
0.0000
0.0000
0.0145
0.0000
0.0874
0.0595
0.0000
0.0007
0.0265
0.0086
0.0005
0.0094
0.0001
0.0115
0.3864
0.0177
0.0034
0.0000
0.2769
0.0123
0.2819
0.0003
0.0053
0.1479
0.3085
0.0841
0.0769
0.0002
0.0161
0.0000
0.3105
0.0762
0.3091
0.1610
0.0915
0.4457
0.0029
0.0097
0.1866
0.1883
0.2088
0.2686
0.0256
0.0810
0.1221
0.0553
0.0181
0.1280
0.0027
0.0107
0.1899
0.1789
0.1996
0.2512
0.0287
0.0886
0.1270
0.0554
0.0200
0.1318
0.0033
0.1055
0.2013
0.0690
0.1194
0.1031
0.0630
0.3283
0.1531
0.0029
0.3235
0.1962
0.0021
0.1017
0.2008
0.1770
0.1564
0.2086
0.0452
0.2869
0.1430
0.0419
0.3623
0.0822
a
To better capture the results, values showing no significant different between observed and simulated data with P . 0.05 are in bold type. Hap_numb 5 haplotype
number; pair_diff 5 pairwise sequence difference; hap_div 5 haplotype diversity; and HapShar 5 Haplotype sharing.
2164 Guimaraes et al.
Table 6
Summary of the Goodness of Fit of the Simulated Models
E, M, C1 (Achilli
et al. 2007)
Model
1
2
3
4
5
6
7
8
9
10
E, M, C2 (Francalacci
et al. 1996)
n95a
P Value
n95a
P Value
3
3
4
2
3
6
8
9
10
10
0.0000
0.0000
0.0000
0.0000
0.0000
0.0000
0.0000
0.0000
0.0000
0.0000
4
2
2
2
4
9
8
8
10
9
0.0000
0.0000
0.0000
0.0000
0.0000
0.0000
0.0178
0.0189
0.0400
0.1065
a
Number of statistics for which observed data fell into the 0.95 empirical
interval about the median of the simulated data.
In principle, there is no limit to the number of models
one may want to try. Of course, a model with the E, M, and
C sequences in three distinct branches of the tree would receive good, but trivial, support from the analysis. This possibility should have been considered only if no simpler
model could be shown to fit the data, which was not the
case here. Similarly, models with contemporary people descending from the Etruscans, and Medieval individuals in
a distinct tree branch, were not tested because we had previously rejected with a high degree of confidence a direct
descent of current Tuscans from Etruscan ancestors (Belle
et al. 2006).
Discussion
This study shows that genealogical links can be detected between people who inhabited Tuscany at different
time periods, but so far not between the Bronze Age and
more recent inhabitants of the region.
Ancient DNA sequences may doubtless contain errors,
that is, apparent nucleotide substitutions due to laboratory
errors or postmortem changes of the DNA strand. Bandelt
(2004) argued that because several Etruscan sequences do
not occur in modern mtDNA databases, some of their substitutions must be experimental artifacts. We discussed
these criticisms elsewhere (Barbujani et al. 2004), but
recently the data passed a stringent quality test. A new
Bayesian method designed to detect sequence artifacts
combines current and ancient sequences in a Maximum
Likelihood tree (Mateiu and Rannala 2008). For that purpose, two mutation matrices are estimated, one describing
the substitution process in the unbiased data, the other describing the probability of additional, ‘‘phantom’’ (Bandelt
et al. 2002) mutations affecting only the ancient sequences.
In 20 replicate tests, the posterior probability of additional
mutations in the Etruscan data set never exceeded 0.02, and
generally was close, or equal, to 0 (Mateiu and Rannala
2008). This does not rule out for good occasional errors
in the Etruscan sequences (as well as in other DNA data
sets) because there is simply no way to positively prove
‘‘any’’ scientific result. However, Mateiu and Rannala’s test
demonstrates that there is no statistical support for the claim
that poor quality of the biological material or of the laboratory procedures made the Etruscan sequences unreliable.
If the Etruscan data do not contain large systematic
errors, the impossibility to fit a model of genealogical continuity between them and contemporary Tuscans (Belle
et al. 2006; this study) can only have two explanations. Either the ancestors of most contemporary Tuscans were not
the Etruscans, or they were, but then no genetic evidence for
their relationship has emerged yet because the available
contemporary samples are not representative of the Etruscans’ descendents.
The second explanation is at odds with the fact that the
current Tuscan samples were collected in relatively isolated
communities, so as to maximize, according to the Authors,
the probability to recognize the Etruscans’ genetic legacy, if
any (Francalacci et al. 1996; Achilli et al. 2007). The present study supports the view that a major demographic shift
affected the Tuscany population structure. Because a model
of direct descent of contemporary Tuscans from local medieval (but not Bronze Age) ancestors fits the data, that shift
likely occurred in the first millennium BC.
This interpretation does not necessarily imply that the
Etruscans became extinct. Rather, it emphasizes a genetic
discontinuity in Tuscany, in a period that we can bracket only
roughly between 2000 and 1000 years ago. The results of this
study are fully accounted for if in that period immigration, or
possibly forced emigration, diluted the Etruscans’ genetic
legacy, to the point of making it difficult to recognize.
Analyses of mtDNA diversity in the British Isles (Töpf
et al. 2007), and Iceland (Helgason et al. 2009), also
showed sharp differences between historical and current
populations. In addition, a large fraction (up to 80%, depending on the region considered) of the Dutch surnames
were displaced from the areas in which their frequency was
highest three centuries ago (Manni et al. 2005). Nobody can
tell whether the Netherlands represent an exception or the
rule, until similar studies are carried out elsewhere, and
there is no comparable information on previous centuries.
However, the point here is that a genetic discontinuity between present and past populations seems rather common in
the few European countries studied so far. Deep demographic changes in the last two millennia are both suggested
by the analysis of ancient DNA in Tuscany, Iceland, and
Britain, and empirically demonstrated in the Netherlands.
Our failure to reproduce by simulation the observed haplotype number of the contemporary Tuscan samples may
mean that such changes involved multiple immigration processes, too complex to model at present.
An obvious question arising from this study concerns
the mutation rate suitable for interpreting patterns of
mtDNA diversity. Mitochondrial substitution rates vary
widely across species (Nabholz et al. 2008), but in the human HVRI, the rates inferred from pedigrees (Howell et al.
2003) are 10-fold as high as those estimated by comparing
humans and chimpanzees (Pakendorf and Stoneking 2005;
Bandelt et al. 2006). Intuitively, the higher rate might better
represent processes occurring on a short timescale, whereas
multiple hits at the same site might have reduced the apparent mutation rate over long periods. However, it is not clear
whether that is sufficient to fully explain the discrepancy,
and historical population bottlenecks may have played an
Genealogical Links between Etruscan and Modern Tuscans 2165
important role too (Henn et al. 2008). In the future, we plan
to estimate the mutation rate from the data of this study,
using a Bayesian approach. Our goal here was to compare
evolutionary models, and hence we can only say that the
higher mutation rate resulted in a better fit, as already observed in previous work on the same timescale (Belle et al.
2006), but not in analyses of genetic variation across the last
50,000 years (Belle et al. 2008).
So far, the study of mtDNA has not substantially contributed to addressing the most debated question concerning
the Etruscans, their origin. Reasons include, but are not limited to, the low degree of mitochondrial differentiation
among European populations (Simoni et al. 2000). Indeed
the Etruscans, along with a few populations of the Caucasus
and of the South-Eastern Mediterranean shores, appear as
outliers with respect to a tight cluster of contemporary populations among which differences are minimal (Vernesi
et al. 2004). The observation that Tuscan and Anatolian
people are genetically related (Achilli et al. 2007) is interesting per se, but would be relevant to our understanding of
the Etruscan population history only if a genetic continuity
could be demonstrated between Etruscans and contemporary Tuscans, which is clearly not the case so far. The
mtDNA similarity between current Tuscans and Anatolians
calls for an explanation and may be suggestive of historical gene flow. However, common features with Anatolian
and Near Eastern populations have been described in
the mtDNA of other contemporary Europeans, such as
the Ladin-speaking community of Northern Italy (Vernesi
et al. 2002).
At present, the Etruscans’ biological origins are, and
will remain, difficult to define, until more information becomes available about the genes of other ancient Mediterranean populations. Technical progress allowing the study
of nuclear polymorphisms in ancient samples would greatly
increase the possibility of evolutionary inference. The recent development of a genetically engineered polymerase
that can use as a template and amplify even damaged
DNA (Shapiro 2008) may open new, exciting possibilities.
Only a handful of populations of preclassical Europe
have been studied genetically, all of them only for mtDNA,
and hence generalizations on their relationships with their
current counterparts appear premature. Therefore, it is not
clear yet whether these data may eventually force us to
reconsider the results of studies inferring demographic history under the assumption that genetic diversity in current
populations is a good proxy for the (unknown) diversity in
past populations of the same region. At this stage, one can
only emphasize that cases of both genetic continuity and
discontinuity have been observed. Therefore, the notion
that the modern inhabitants of a region are descended from
its ancient residents does not seem a robust general assumption, but rather a hypothesis that whenever possible should
be tested empirically using ancient DNA.
Supplementary Material
Supplementary tables S1– S3 are available at Molecular Biology and Evolution online (http://www.mbe.
oxfordjournals.org/).
Acknowledgments
The sequences generated in this study have been submitted to GenBank, accession numbers FJ946288–
FJ946314. This study was supported by a grant of the
Italian Ministry of Universities (PRIN 2006) to G.B. and
D.C., and by funds from Ente Cassa di Risparmio di Firenze
to D.C. We thank Roscoe Stanyon for critical reading of the
manuscript, Naruya Saitou, and three anonymous reviewers
for several comments and suggestions.
Literature Cited
Achilli A, Olivieri A, Pala M, et al. (22 co-authors). 2007.
Mitochondrial variation of modern Tuscans supports the Near
Eastern origin of Etruscans. Am J Hum Gen. 80:759–768.
Anderson CNK, Ramakrishnan U, Chan YL, Hadly EA. 2005.
Serial SimCoal: a population genetics model for data from
multiple populations and points in time. Bioinformatics.
21:1733–1734.
Bandelt H-J. 2004. Etruscans artifacts. Am J Hum Genet.
75:919–920.
Bandelt H-J, Kivisild T. 2005. Quality assessment of DNA
sequence data: autopsy of a mis-sequenced mtDNA population sample. Ann Hum Genet. 70:314–326.
Bandelt H-J, Kong QP, Richards M, Macaulay V. 2006.
Estimation of mutation rates and coalescence times: some
caveats. In: Bandelt HJ, Macaulay V, Richards M, editors.
Human mitochondrial DNA and the evolution of Homo
sapiens. Berlin (Germany): Springer. p. 47–90.
Bandelt H-J, Quintana-Murci LL, Salas A, Macaulay V. 2002.
The fingerprint of phantom mutations in mitochondrial DNA
data. Am J Hum Gen. 71:1150–1160.
Barbujani G, Vernesi C, Caramelli D, Castrı̀ L, Lalueza-Fox C,
Bertorelle G. 2004. Etruscan artifacts: much ado about
nothing. Am J Hum Genet. 75:923–927.
Barker G, Rasmussen T. 1998. The Etruscans. Malden (MA):
Blackwell.
Belle EMS, Benazzo A, Ghirotto S, Colonna V, Barbujani G.
2008. Comparing models on the genealogical relationships
among Neandertal, Cro-Magnoid and modern Europeans by
serial coalescent simulations. Heredity. 102:218–225.
Belle EMS, Ramakrishnan U, Mountain J, Barbujani G. 2006.
Serial coalescent simulations suggest weak genealogical
relationships between Etruscans and modern Tuscans. Proc
Natl Acad Sci USA. 103:8012–8017.
Bendall KE, Sykes BC. 1995. Length heteroplasmy in the first
hypervariable segment of the human mtDNA control region.
Am J Hum Genet. 57:248–256.
Biraben J-N. 1979. Essai sur l’evolution du nombre des hommes.
Population (French ed). 34:13–25.
Caramelli D, Vernesi C, Sanna S, et al. (15 co-authors). 2007. Genetic
variation in prehistoric Sardinia. Hum Genet. 122:327–336 .
Cooper A, Poinar HN. 2000. Ancient DNA: do it right or not at
all. Science. 289:1139.
Dinner A, Blackburn G, Karplus M. 2001. Uracil–DNA glycosylase acts by substrate autocatalysis. Nature. 413:752–755.
Fagundes NJ, Ray N, Beaumont M, Neuenschwander S,
Salzano FM, Bonatto SL, Excoffier L. 2007. Statistical
evaluation of alternative models of human evolution. Proc
Natl Acad Sci USA. 104:17614–17619.
Francalacci P, Bertranpetit J, Calafell F, Underhill PA. 1996.
Sequence diversity in the control region of mitochondrial
DNA in Tuscany and its implications for the peopling of
Europe. Am J Phys Anthropol. 100:443–460.
2166 Guimaraes et al.
Giovannini F. 2001. Natalità, mortalità e demografia dell’Italia
medievale sulla base dei dati archeologici. Oxford: Hadrian
Books.British Archaeological Reports, International Series
S950.
Handt O, Krings M, Ward RH, Pääbo S. 1996. The retrieval of
ancient human DNA sequences. Am J Hum Genet. 59:368–376.
Helgason A, Lalueza-Fox C, Ghosh S, et al. (11 authors). 2009.
Sequences from first settlers reveal rapid evolution in
Icelandic mtDNA pool. PLoS Genet. 5:e1000343.
Henn BM, Gignoux CR, Feldman MW, Mountain JL. 2008.
Characterizing the time-dependency of human mitochondrial
DNA Mutation rate estimates. Mol Biol Evol. 26:217–230.
Hofreiter M, Serre D, Poinar HN, Kuch M, Pääbo S. 2001.
Ancient DNA. Nat Rev Genet. 2:353–359.
Howell N, Smejkal CB, Mackey DA, Chinnery PF,
Turnbull DM, Herrnstadt C. 2003. The pedigree rate of
sequence divergence in the human mitochondrial genome:
there is a difference between phylogenetic and pedigree rates.
Am J Hum Genet. 72:659–670.
Manni F, Toupance B, Sabbagh A, Heyer E. 2005. New method
for surname studies of ancient patrilineal population structures, and possible application to improvement of Ychromosome sampling. Am J Phys Anthropol. 126:214–228.
Mateiu LM, Rannala B. 2008. Bayesian inference of errors in
ancient DNA caused by post mortem degradation. Mol Biol
Evol. 25:1503–1511.
Meyer S, Weiss G, von Haeseler A. 1999. Pattern of nucleotide
substitution and rate heterogeneity in the hypervariable
regions I and II of human mtDNA. Genetics. 152:
1103–1110.
Nabholz B, Glémin S, Galtier N. 2008. Strong variations of
mitochondrial mutation rate across mammals—the longevity
hypothesis. Mol Biol Evol. 25:120–130.
Pakendorf B, Stoneking M. 2005. Mitochondrial DNA and
human evolution. Annu Rev Genomics Hum Genet. 6:
165–183.
Poinar HN, Hoss M, Bada JL, Pääbo S. 1996. Amino acid
racemization and the preservation of ancient DNA. Science.
272:864–866.
Rasmussen T. 2004. Urbanisation in Etruria. In: Osborne R,
editor. Mediterranean urbanisation, 800–600 B.C. Oxford:
Oxford University Press.
Schneider S, Roessli D, Excoffier L. 2000. Arlequin: a software
for population genetics data analysis. Geneva (Switzerland):
University of Geneva.Version 2.0
Serre D, Langaney A, Chech M, Teschler-Nicola M,
Paunovic M, Mennecier P, Hofreiter M. 2004. No evidence
of Neandertal mtDNA contribution to early modern humans.
PLoS Biol. 2:E57.
Shapiro B. 2008. Engineered polymerases amplify the potential
of ancient DNA. Trends Biotechnol. 26:285–287.
Simoni L, Calafell F, Pettener D, Bertranpetit J, Barbujani G.
2000. Geographic patterns of mtDNA diversity in Europe.
Am J Hum Genet. 66:262–278.
Töpf AL, Gilbert MT, Fleischer RC, Hoelzel AR. 2007. Ancient
human mtDNA genotypes from England reveal lost variation
over the last millennium. Biol Lett. 3:550–553.
Vernesi C, Caramelli D, Dupanloup I, et al. (13 authors). 2004.
The Etruscans: a population genetics study. Am J Hum Genet.
74:694–704.
Vernesi C, Fuselli S, Castrı̀ L, Bertorelle G, Barbujani G. 2002.
Mitochondrial diversity in linguistic isolates of the Alps:
a reappraisal. Hum Biol. 74:725–730.
Voight BF, Adams AM, Frisse LA, Qian Y, Hudson RR, Di
Rienzo A. 2005. Interrogating multiple aspects of variation in
a full resequencing data set to infer human population size
changes. Proc Natl Acad Sci USA. 102:18508–18513.
Naruya Saitou, Associate Editor
Accepted June 10, 2009
© Copyright 2026 Paperzz