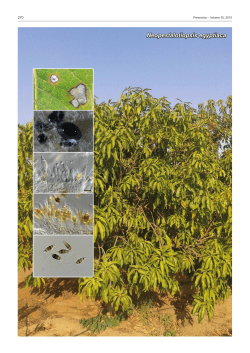
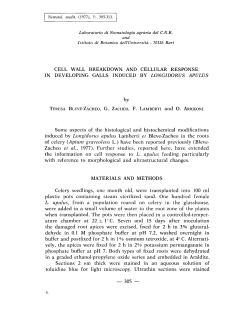
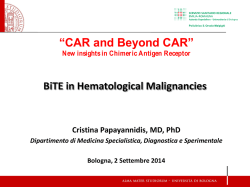
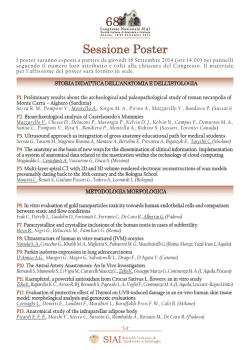
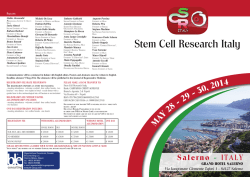
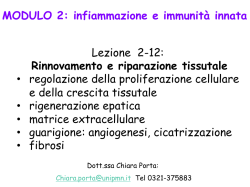
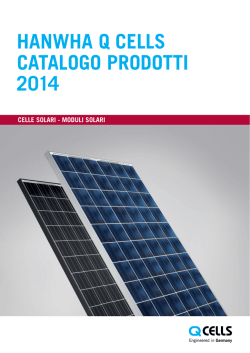
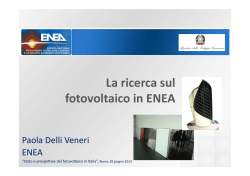
(CANCER
RESEARCH
37, 200-205,
January
1977]
The Effect of Adriamycin on Cell Cycle Progression and DNA
Replication in Chinese Hamster Ovary Cells1
Judith M. Clarkson and Ronald M. Humphrey
Departmentof Physics,TheUniversityof TexasSystemCancerCenter,M. D. AndersonHospitaland TumorInstitute,Houston,Texas77030
not directly responsible for lethality resulting from ADA
SUMMARY
treatment. In fact, at the concentrations
used here, treat
Chinese hamster ovary cells were treated with adniamycin
ment prior to G2in the previous cell cycle was necessaryin
(ADA) at various stages of the cell cycle in order to deter
order to demonstrate a reduction in the rate of DNA replica
tion. This also resulted in delayed entry into mitosis and is
consistent with a preferential inhibition of nucleolan RNA
synthesis in late S phase, as demonstrated for DM treat
mine the effect on cell cycle progression and subsequent
DNA replication. Concentrations of ADA up to 5 pg/mI for
15 mm produced no progression delay in cells treated 1 hr
prior to mitosis, and concentrations of 2 pg/mI or lower had
no effect on the progression to mitosis of G, or late S-phase
cells. However, cells treated in mid-S phase showed a sig
nificant, dose-dependent delay at concentrations as low as
0.5 @g/rñl@
This cell cycle effect on progression was also
reflected in the rates of DNA replication in the subsequent S
phase. DNA replication was not inhibited by 5 p@g/mlfor 30
mm when applied in either the G1, M, or G, phase. In
contrast, wltep ADAwas applied in the S or G1phasesof the
previous cell cycle, a marked depression in the rate of
replication of DNA was observed. This was found to be the
case for DNA synthesized both before and after the ADA
treatment.
INTRODUCTION
ADA2 is an antitumor antibiotic isolated from Strepto
myces peucetius van. caesius (5) and , like its structural
analog DM, it kills cells and inhibits growth, causing a
decrease in the mitotic index and affecting nucleic acid
metabolism (1, 11, 16, 21). DM has been extensively studied
and it has been shown that, in a cell-free system, DNA
synthesis and DNA-dependent RNA synthesis are inhibited
(8), probably due to the binding of DM to the DNAtemplate
(3). However, inhibition of DNA synthesis does not appear to
be the primary cause of cell death, since much lower con
centrations of DM inhibit RNA synthesis (8). In particular, Di
Marco et al. (6) and Silvestrini et a!. (16) showed that, in rat
fibroblast cultures, DM (0.5 pg/mI) reduces nucleolar ANA
synthesis considerably more than extranucleolar RNA syn
thesis.
In this paper, CHO cells have been treated with ADA at
different stages of the cell cycle. By following the progres
ment.
MATERIALSAND METHODS
Cell Culture Technique. CHOcells were used throughout
and were maintained as monolayer cultures in McCoy's
Medium 5A (Gland Island Biological Co., Grand Island, N.
V.) with 20%fetal calf serum (Grand Island Biological Co.),
by the procedure described by Humphrey et al. (10). Under
these conditions, the average cell generation time was
found to be 14 hr, of which the pre-DNAsynthesis period
(G1) was 4 hr, DNA synthesis (5) was 8 hn, and the post-DNA
synthesis period (G,), including mitosis (M) was 2 hr. Cells
were routinely monitored for the presence of pleunopneu
monia-like organisms and found to be negative.
Drug Treatment and Determination of Division Delay.
ADA (manufacturedby Famitalia, Milan, Italy; distributed by
Adria Laboratories) was dissolved in 0.9% NaCI solution
immediately before use, and a 10-fold concentrated solu
tion was added to the growth medium. The resulting divi
sion delay was estimated by plating 10@cells in 6-cm Petni
dishes and, 12 hr later, adding the ADAto a final concentra
tion of 0, 0.5, 2, or 5 pg/mI for 15 mm (at 37°).
The plates
were then washed twice in fresh medium and 2 of each
concentration were fixed immediately with 95% alcohol.
The remaining plateswere returned to the incubator in fresh
medium and sampleswere fixed every 30 mm. The number
of cells penclone was then determined for 100 clones.
MitoticSelectionof ADR-treatedCells. In orderto moni
ton the progression of G2and S cells into mitosis following
ADA treatment, 1.5 x 10@cells were seeded into 32-oz pre
scniption bottles and incubated overnight. [3H]TdA(specific
activity, 17 Ci/mmole; Schwarz/Mann, Orangebung, N. V.)
and the
sion of cells into mitosis and the subsequent rate of DNA was added to give a final concentration of 5 @Ci/ml
replication, it is evident that inhibition of DNA synthesis is cells were incubated for 15 mm. They were then washed
with fresh warm medium containing TdA, 10 pg/mI.
Warm medium containing ADA at a concentration of 0,
0.5, 2, or 5 pg/mI was added to the cells, and incubation
04484 and Contract NOl CN 61156.
a The abbreviations used are: ADA, adriamycin; DM, daunomycin; CHO,
was continued for an additional 15 mm. At this time the
I This
work
was
supported
in
part
by
National
Cancer
Institute
Grant
CA
Chinese hamster ovary; (‘H]TdR,
tritiated thymidine; TdR, thymidine; HU.
hydroxyurea; BUdR, bromodeoxyuridine.
Received March 12, 1976; accepted October 12, 1976
200
bottles were shaken vigorously to remove unattached cells
and the cultures were washed twice. Ten ml of warm fresh
CANCER RESEARCH VOL. 37
Downloaded from cancerres.aacrjournals.org on June 16, 2017. © 1977 American Association for Cancer Research.
@
S
Effects of ADA on CHO Cells
was present at a concentration of 0, 0.5, 2, or 5 pg/mI. The
cells were washed free of ADA and HU, and medium con
medium were added and incubation at 37°was continued.
Every 15 mm, the bottles were removed from the incubator,
shaken gently to remove the mitotic cells (18), and the me
dium was collected. The cultures were again incubated in
10 ml of fresh medium. The yield of mitotic cells in the sam
pIes was estimated with the use of a Coulter electronic
particle counter (Coulter Electronics, Inc., Hialeah, Fla.).
The cells were centrifuged at 1000 x g and the cell pellet
taming [3HJTdA,0.5 @Ci/ml(specific activity, 1.9 Ci/mmole)
was added for 7 hr. Mitotic cells were shaken from the
cultures as before and incubated in HU medium for 9 hr.
After the HU medium was washed from the plates, fresh
warm medium containing BUdA was added so that the rate
of DNA replication could be estimated.
was fixed in 50%acetic acid. The cells were resuspendedin
DNA Replication.
DNA was unfommly labeled with 14C
2% acetooncein stain, and slides were prepared for auto
radiography (4). It was evident from these slides that the
mitotic index of the samples exceeded 90%.
prior to synchrony by incubating cells in [14C]TdR, 0.1 @Ci/
ml, (50 mCi/mmole; Schwarz/Mann) for 18 hr at 37°.Aepli
cation was estimated as rate of uptake of BUdR and conse
Cell SynchronyTechniques.The 2 followingprotocols quent increase in buoyant density in CsCI gradients (13).
are outlined in Chart 1. In order to enhance the yield of Following mitotic selection and incubation in HU medium,
mitotic cells, 10@cells were seeded into prescription bottles,
the cells were washed twice and resuspended in medium
incubated overnight, and 7.5 mM TdR was added to the containing BUdA (50 pg/mI) and fluorodeoxyunidine (0.1
cultures for 9 hr. Following removal of the TdR block, the p@g/ml).After appropriate incubation times (up to 10 hn),
cells progressed through the cell cycle, and 5 to 6 hr later, a cells were harvested, lysed with sancosyl, and prepared for
wave of mitotic cells could be shaken from the bottles as equilibrium centrifugation. CsCl solution was added to the
described above. The resulting population had a greater
cell lysate to give a 4.7-mI sample with a density of 1.74 g/
than 90% mitotic index. As in the previous section, cells ml. The sample was centrifuged in a Beckman 50.1 rotor at
could be treated with ADA 5 hr or 1 hr prior to their entry into 33,000 rpm for 45 hr at 20°.The percentage of DNA repli
mitosis such that they had been damaged in S or G, phase. cated was determined from the proportion of radioactivity
banding in the hybrid density region of the gradient.
In some experiments, mitotic cells were treated immediately
upon collection and before plating. Mitotic cells were then
Progression of Cells into S Phase. Cells were synchro
plated in 2 mM HU for 9 hn, and this allowed progression to nized using excess TdR, incubated in ADR for 30 mm, and
the G1-S boundary (13). After the cultures were washed and allowed to progress to mitosis. Mitotic cells (10k) were
fresh medium was added, the cells progressed immediately
plated in 6-cm Petmidishes and HU medium was added as
into S phase. For the experiment in Chart 6, cells were before for 8 to 10 hr. To one set of plates, [3H]TdA (specific
activity, 2 Ci/mmole) was added to give a concentration of
prelabeled overnight with [‘4C]TdR,
0.05 MCi/mI, (Schwarz/
Mann), and 7.5 mM TdR was added for 9 hr more. They were 0.5 MCi/mI for the last hr of incubation. The remaining
then washed and fresh medium was added for 9 hr to allow
samples were washed free of HU and [3H]TdR medium was
progression through S phase. Two mM HU was then added
added for 1, 2, 4, or 6 hr. The cells were washed with 0.9%
for 6 hr more. For the last 0.5 hr of incubation in HU, ADA NaCI solution, fixed in 95% alcohol, and subbed with 1%
A
@
@
@
,
@
@
Mitotic
Shake-off
Fresh
TdR Medium
block
9 hr
-—-
BUdR
Medium
Protocol
,
I
marked
in
hours.
Timescale
I@ ,
L
I
::
,J ,
I
,
:@
:
—-+I -
::
I
HUMedium
8 —
10 hr
c2: 1:
I@
____L_L___?
V
VV
S
G2
I
Approximate
G1
V
Treatment
times.
M
late
Cl
B
TdR
block
9 hr
Fresh
Medium
9hr
HUMedium
6hr
±AM
[3HJrdR
Medium
Mitotic
1hr
Cl
G2+M
BUdA
9 hr
medium
Protocol
Shake-off
I-I
S
HUMedium
II
S
C1
S
Approximate
cellstage.
G2+M
Chart 1. The protocols used to synchronize cells for determinations of the rate of DNA replication following ADA (AM) treatment at various stages of the
cell cycle. In A, cells were treated in 5, 6,, M, or late G, and the subsequent rate of DNA replication is shown in Chart 5. In B, ADR was present for 30 mm in late
G,, andthe cellsweretransferredto mediumcontaining[‘HJTdA.
Followingmitotic shake-oft,the rateof DNAreplicationwasmonitoredin the subsequentS
phase (Chart 6).
JANUARY 1977
Downloaded from cancerres.aacrjournals.org on June 16, 2017. © 1977 American Association for Cancer Research.
201
J. M. Clarkson and A. M. Humphrey
bovine serum albumen. Autoradiographs
were made with
the use of Ilford liquid emulsion K5 and were exposed for 5
days. The plates were then stained with Giemsa and the
percentage of labeled cells was determined by counting 100
total cells.
division is shown in Chart 3, right. An asynchronous popu
lation of cells was treated with ADR 12 hr after plating. The
number of cells per clone following ADRtreatment was then
determined. At the time of treatment, most of the clones
contained 2 cells, and 10% had 3 to 4 cells. After a delay of
1.5 hr due to handling, the control cells divided at a con
stant rate such that, 4 hr later, 23%of the clones had more
RESULTS
than 2 cells. After a similar lag, cells treated with 0.5 @g/ml
divide at approximately 75% of this rate. After 2 or 5 @g/ml,
the lag increased to 3 hr. As in the previous experiment,
Charts 2 to 4 show the progression of cells to mitosis
following ADA treatment. Cells were labeledfor 15 mm with despite the longer lag, the rate of division following 2 @g/ml
[3HITdRand then transferred to ADR, as described in “Maapproaches that following 0.5 @g/ml.
The rate following 5
terials and Methods.―Mitotic cells were collected and pg/mI is again slower, and less than 50% of the control rate.
counted every 15 mm over a period of 6 hr. The yield of
Autonadiographs were prepared from the mitotic cells
mitotic cells is shown in Chart 2 and is representativeof 4 collected at each shake. The percentage of unlabeled,
different experiments. The data are expressedas a percent lightly labeled, and heavily labeled cells was then deter
age of the control number at each time point. It is evident mined for 100 cells/sample. Cells with less than 50 grains
that the yield of cells over the 1st hr (4 shakes) is affected
little by ADR treatment at all of the concentrations used.
During the 2nd hr, the cell count drops to its lowest point:
80% of the control value following 0.5 pg/mI, 50% following
2 pg/mI, and 15%following 5 @g/ml.
The rate of recovery is
then dose dependent and becomes more evident when we
consider the data in Chart 3.
Chart 3, left, shows data from Chart 2 expressed as total
number of mitotic cells accumulated from the time of ADA
treatment. The control cells progressthrough the cell cycle
at a constant rate, yielding 1.7 x 10@
mitotic cells per shake.
Forthe 1st 2.5 hrfollowing 0.5 pg/mI, a similar rate of entry
into mitosis occurs. However, at this point there is a slight
reduction in the rate of entry, and this new rate persists for
the remainder of the collection time. Two pg/mI results in a
marked reduction in yield beginning 1 hr after treatment.
The delay is greatest between 2 and 3 hr after treatment,
and then the rate of division increasesto that following 0.5
@g/mlof ADA. A similar, more marked effect results from
ADA, 5 @g/ml.
Between 1.5 and 3.5 hr after ADA treatment,
very few mitotic cells were collected. The rate then parti
cally recovered to one-third of the control rate.
That these data are true reflections of the rate of cell
were defined as lightly labeled, and those with more than 50
grains, heavily labeled. From the number of mitotic cells
collected, the yield of unlabeled, lightly labeled, and heavily
labeled cells at each shake could be determined (Chart 4).
Chart 4A shows the progression of unlabeled G2cells. The
rate of progression of these cells is unaffected by concen
trations of ADA of 2 pg/mI or less, and within 3 hn, most of
these G2cells havedivided. G2cells treated with ADA (5 @g/
ml) initially divide at the control rate. However, after 3 hr,
only 50% of the cells have divided, and progression of these
cells then ceases.
In Chart 4B, the nate of division of the lightly labeled cells
is shown. These lightly labeled cells are considered to be
cells in late S phase, since Terasima and Tolmach (19)
showed that the rate of DNAsynthesiswas greatest in mid-S
phase and then declined as the cells progressed. The divi
sion of these lightly labeled cells commences at the start of
the collection period (45 mm from the addition of the
[3H]TdA)and for concentrations of ADA of 2 @g/ml
or less,
continues at a constant rate for 4 hr and is completed within
5 hr. Following a 5-@g/ml dose of ADA, the rate of progres
sion of these cells resemblesthat of the control cells for the
20
5,
@0
‘1:,
.@
0
.@ (0
.@
£
0
£
0
aO5jiq/in/
E
0
,@‘
pg/mi
V
5 pg/mi
23456
Time(hours)
Chart 2. The progression of cells to mitosis following ADR treatment. The
cells were labeled for 15 mm with [3H)TdR and then transferred to medium
containing ADA for 15 mm. Mitotic cells were collected every 15 mm for 6 hr,
and the yield at each shake was determined. The data are expressed as a
percentage of the control yield at each shake.
202
0
a'
6
0 ) 23456
1/me(Hours)
Chart 3. The rate of cell division following ADA treatment. Lefthand panel,
data from Chart 2 expressed as total number of mitotic cells accumulated
from the time of ADA treatment; righthand panel, number of cells per clone
over a 6-hr period following ADA treatment of an asynchronous population
of cells.
CANCER RESEARCHVOL. 37
Downloaded from cancerres.aacrjournals.org on June 16, 2017. © 1977 American Association for Cancer Research.
Effects of ADA on CHO Cells
1st 2 hr and then proceeds at approximately one-quarter of
this rate. The heavily labeled cells, presumably cells in mid
S at the time of labeling, are shown in Chart 4C. At each
concentration , division of these cells begins 1.5 hr after the
start of the collection period (2.25 hr after addition of the
label), but the rate of division of the cells is inversely pro
portional to the concentration of ADR.
Table 1 shows the total number of mitotic cells accumu
lated in each group at the end of the 6-hr collection period.
As in Chart 4, it is evident that the distribution of unlabeled
and lightly labeled cells following doses of 0.5 or 2 pg/mI
resembles that in the control samples. The reduction in
yield of mitotic cells is predominantly due to loss or delay of
the more heavily labeled S-phase cells. After 5 pg/mI, there
is a loss of cells from each of the categories; however, the
greatest deficiency is again in the S-phasecells. Six hr after
treatment with ADA, the total number of mitotic cells col
lected is reduced by 10% following 0.5 @g/mlor by 20%
following 2 p.g/ml. This reduction is primarily due to a
deficiency in heavily labeled cells. Following treatment with
5 @g/ml,there is a 60% reduction in the yield of cells,
resulting from a loss of 50% of the unlabeled, 33% of the
lightly labeled, and 75% of the heavily labeled cells.
Chart 5 shows the effect on DNA replication of ADA treat
ment at various stages of the cell cycle. Cells were prela
beled with [‘4C]TdR
and synchronized with excess TdR as
described in “Materials
and Methods―and Chart 1. One hr
aftertransfer
to freshmedium, 1 culturewas treatedwith
ADR (5 pg/mI) for 30 mm (S-phase cells) and, 5 hr later, a
2nd was treated (G2-phase cells). Six hr after release from
TdR, the mitotic cells were collected and a 3rd sample was
treated with ADA at this time (M-phase cells). Collection of
thecells
was completedwithina 1-hrperiodso as toreduce
the dispersion in cell stage at the time of treatment with
ADA. Collected M-cells were plated into medium containing
2 mM HU and incubated for 9 hr to allow the cells to
progress to the G1-Sboundary. For the last 30 mm of this
incubation, ADA was present in a previously untreated set
of plates (late G1-phase cells). The HU medium (±ADA)was
SD
b
(00
Control
Lote
C,
M,/os,s
0
C.-)
A
CS
S
75
(-)
0
0
25
0
I
2
34
56
)
23456
2
Time(hours)
4
6
8
(0
Hours Post HU Release
Chart 4. The rate of cell division following ADA treatment of unlabeled,
lightly labeled, and heavily labeled cells. The cells were labeled for 15 mm
with [3H]TdR and then incubated for 15 mm in ADA. The yield of mitotic cells
was then determined at 15-mm intervals and is shown in Charts 2 and 3.
Autoradiographs of these samples were made so that the rate of progression
of each type of cell could be determined. As in Chart 3, the data are
expressed as the total number of mitotic cells collected.
1The
Chart 5. The effect on DNA replication of ADR treatment at various stages
of the cell cycle. Cells were prelabeled in [‘4C]TdR
and synchronized by
excess TdR, mitotic selection, and incubation in HU medium (see Chart 1A).
The cells were then transferred to BUdR medium for various lengths of time.
ADA (5 @g/ml)was present for 30 mm either 1 hr following release from TdR
(S),5 hr following release(Ge),immediatelyfollowing shake-oft(M),or one
half hr prior to release from HU (late G,).
Table
total number of mitotic cells (M) collected in the 6 hr following ADA treatment,
4Concentration
of
ADA
10')Control
(@g/ml)
0.5
2
(25)a 5
Numbers
in
calculated from the data in Chart
Total M colUnlabeledM Lightly labeled Heavilylabeled
lected (x 1OC)
(x 10)
M (x 10')
M (x
3.89
1.28
0.52
2.09
3.55 (91)°
1.27 (99)
0.56 (109)
1.71 (82)
3.06 (79)
1 .13 (88)
0.51 (99)
1 .41 (68)
1.53 (39)
0.66 (52)
0.34 (66)
0.53
parentheses,
cell
number
as
percentage
of
control
value.
JANUARY 1977
Downloaded from cancerres.aacrjournals.org on June 16, 2017. © 1977 American Association for Cancer Research.
203
J. M. Clarkson and A. M. Humphrey
then replaced by medium containing
BUdA, and Chart 5
shows the percentage of DNAthat has replicated, as mea
sured by the increase in buoyant density of the DNA in CsCl
gradients. It is evident from these data, as in other studies
(13), that DNA replication in untreated controls is 90% com
pleted within 9 hr after release from HU. The cells treated
with ADA while in G2,M, or late G1show a slightly reduced
rate of replication and by 10 hr have replicated between 75
and 85% of their DNA. However, cells treated in the previous
S phase have a very reduced rate of replication which is only
50% completed at 9 hr. The data in Table 2 show that this
reduced amount of replication is not the result of cells being
delayed in G1 and consequently blocked from entering S
phase. Within 1 hr following release from HU, 95% of the
cells in each sample are in S phase.
The experiment in Chart 6 shows the replication of DNA
from cells treated during the late G1 period of the previous
cell cycle. Cells were prelabeled with [14CITdA and synchno
nized with excess TdR followed by HU (see “Materials
and
Methods―and Chart 1). The G1 cells were treated with
various concentrations of ADA during the last 30 mm of the
HU block and then were released into medium containing
[3H]TdA. Following mitotic selection and a 2nd incubation
in HU, the rate of replication of DNA synthesized prior to the
2The
Table
progression ofcellsADAduring
into Sphasefollowing treatmentwith
SCells
the previous
themitotic
were treated with ADA following a TdR block and
hr.[3H]TdR
cells were collected
and incubated
in HU medium
for 10
autoradiographswere
wasaddedfor various lengthsof time and
made. The results are expressed as percentage of cells Ia
beled.Time
pg/mI1
in [3HJTdRmedium
Control
2 @g/ml 5
00-1
hrpriortoHUrelease
0
960-2
hr post-HUrelease
940-4
hr post-HUrelease
970-6
hr post-HUrelease
hr post-HUrelease
95
94
99
100
treatment (14C-labeled)and post-ADA treatment (3H-labeled)
is shown. In the control cells, data for both the ‘4Cand the
3H-Iabeled DNA resemble those in Chart 5. The same pattern
is also seen for cells treated with 0.5 @g/ml.For cells
treated with ADA (2 @g/ml),the rate of replication in the 2nd
S phase is considerably reduced and appears to terminate
at 70% completion 7 hr after release from HU. After 5 @g/ml,
the rate of replication is greatly reduced and, in 9 hr, only 20
to 30% of both the “Cand 3H-Iabeled DNA has replicated.
DISCUSSION
Previous studies on ADA and DM have shown that the 2
agents have very similar modes of action. In particular, cell
division and DNA synthesis are inhibited, and we have con
firmed this for ADA. There has, however, been no previous
attempt to determine the critical process in the cell cycle
that is inhibited by ADR. Survival studies show that cells in S
phase may be the most sensitive (1, 11, 12) to ADA treat
ment. However, both RNA and DNA synthesis are inhibited
by ADA (11, 17, 21), and since the inhibition of RNA synthe
sis appears to be the more significant result of DM treat
ment (2, 14, 16), a direct effect on DNA synthesis may not be
the cause of lethality from ADR.
Charts 2 to 4 show that ADA treatment of CHO cells
results in a dose-dependent inhibition of cell division. By
labeling the cells immediately prior to ADA treatment, it was
also possible to follow the progression of cells treated in S
or G2 phase. Progression delay was shown by Barranco et
a!. (1) to occur at all stages of the cell cycle. However, Tobey
(20) and Knishan and Frei (12) showed that the greatest
progression delay occurred in late S and G2. In addition,
Hittleman and Aao (9) demonstrated that the closer the cells
0
were to mitosis, the less was the G2delay. Our data are
98
96
100
97
consistent with this and show that delayed progression into
mitosis does not occur in cells treated in the last hr prior to
mitosis. In fact, concentrations of 2 pg/mI or lower of ADA
have little effect on the progression of cells treated in G2or
late S. At these concentrations, the reduction in yield of
mitotic cells commencing 1 hr after ADA treatment is pni
manly due to a deficiency in heavily labeled cells.
The results in Charts 5 and 6 show that inhibition of DNA
synthesis is a secondary effect and that the failure of S cells
to reach mitosis following ADA treatment is not due to their
inability to complete DNA replication. Cells incubated with
98
ADA (5 pg/mI) in late G1,immediatelybefore S phase, show
8
CO
0
2
Hours Post//I/Release
Chart 6. The rate of replication of DNA synthesized before and after ADR
treatment in the previous cell cycle. Cells were prelabeled with [“C]TdR
and
synchronized with excess TdR followed by HU (see “Materials
and Methods―
and Chart 18). The cells were treated with ADA for the last 30 mm of the HU
block and then were released into medium containing [3H]TdR. Mitotic cells
were collected, incubated in HU medium, and the percentage of DNA that
replicates in the subsequent S phase wasestimated by incubation in medium
containing BUdR.
204
very little reduction in the rate of DNA replication. This is
also true for treatments in mitosis and G2. However, cells
treated in the previous S not only show a delay in reaching
mitosis, but are unable to complete the following S phase
on schedule. Additional evidence that is probably not a
direct effect on DNA is shown in Chart 6. The 14C-labeled
DNA was synthesized prior to ADA treatment and the 3Hlabeled DNA was synthesized following ADA treatment in
late G1. In the 2nd S following treatment, both strands of the
DNA were equally affected in their ability to act as a tem
plate for DNA replication. Gniffiths and Tolmach (7) recently
showed that the magnitude of the X-ray-induceddepression
of DNA synthesis in HeLa S3 cells depended on the stage in
the previous cell cycle at which irradiation occurred. As
CANCERRESEARCHVOL. 37
Downloaded from cancerres.aacrjournals.org on June 16, 2017. © 1977 American Association for Cancer Research.
Effects of ADA on CHO Cells
with ADA, doses that produced no reduction when adminis
tered during G1 of the same cell cycle reduced the rate of
DNA synthesis when applied prior to the point in G2at which
progression of the cells was blocked. However, Schneider
man et a!. (15) showed that the mean action time for division
delay of X-irradiated CHO cells was 49 mm. Since this time
is considerably shorter than that for ADR (between 1 and 1.5
hr in Chart 2), it suggests that the 2 agents have different
modes of inhibition.
From the data presented here, we suggest that the critical
time in the cell cycle at which ADR acts is sometime in late S
phase. It has been shown by Silvestrini et a!. (16) that rRNA
synthesis in the nucleolus is enhanced at this stage (1 to 2
hr before mitosis), and this appears to be particularly sensi
tive to DM action (2, 6, 16). Our data for ADA are consistent
with this and suggest that the 2 agents have a similar mode
of action.
ACKNOWLEDGMENTS
We acknowledge the technical assistance of V. Willingham and J. Win
ston.
REFERENCES
1. Barranco, S. C., Gerner, E. W., Burk, K. H., and Humphrey, A. M.
Survival and Cell Kinetics Effects of Adriamycin on Mammalian Cells.
Cancer Res., 33: 11-16, 1973.
2. Brsmerskov, V., and Linnemann, A. Some Effects of Daunomycin on the
Nucleic Acid Synthesis in Synchronized L-Cells. European J. Cancer, 5:
317-330, 1969.
3. Calendi, E., Di Marco, A., Reggiani, M., Scarpinato, B., and Valentini, L.
Physio Chemical Interactions between Daunomycin and Nucleic Acids.
Biochim. Biophys. Acta, 103: 25-49, 1965.
4. Dewey,W.C., and Humphrey,R.M. RelativeRadiosensitivityof Different
Phases in the Life Cycle of L-P59 Mouse Fibroblasts and Ascites Tumour
Cells. Radiation Ass., 16: 503-530, 1962.
5. Di Marco, A., Gaetani, M., and Scarpinato, B. Adriamycin (NSC-123127)
A New Antibiotic with Anti-Tumor Activity. Cancer Chemotherapy Aept.,
53: 33-37, 1969.
6. Di Marco, A., Silvestrini, A., Di Marco, S., and Dasdia, T. Inhibiting Effect
of the New Cytotoxic Antibiotic Daunomycin on Nucleic Acids and Mi
totic Activity of HoLe Cells. J. Cell Biol., 27: 545-550, 1965.
7. Griffith, T. D., and Tolmach, L. J. Age-dependence of the x-ray lnduced
Deficiency in DNA Synthesis in HeLa 53 Cells during Generation 1.
Radiation Ass., 63: 501-520, 1975.
8. Hartmann, G., Goller, H., Koschel, K., Kersten, W., and Kersten, H.
Hemmung der DNA abhangigen ANA and DNA Synthese Durch Antibi
otica. Biochem. Z., 341: 126, 1964.
9. Hittelman, W. N., and Aao, P N. The Nature of Adriamycin-induced
Cytoxicity in Chinese Hamster Cells as Revealed by Premature Chromo
some Condensation. Cancer Ass., 35: 3027-3035, 1975.
10. Humphrey, A. M., Steward, D. L., and Sedita, B. A. DNA-Strand Scission
and Rejoining in Mammalian Cells. In: Genetic Concepts and Neoplasia,
The University of Texas M. D. Anderson Hospital and Tumor Institute at
Houston, pp. 570-592. Baltimore: The Williams & Wilkins Co., 1970.
11. Kim, S. H., and Kim, J. H. Lethal Effect of Adriamycin on the Division
Cycle of HeLa Cells. Cancer Ass., 32: 323-325, 1972.
12. Krishan, A., and Frei, E., Ill. Effect of Adriamycin on the Cell Cycle
Traverse and Kinetics of Cultured Human Lymphoblasts. Cancer Ass.,
36: 143-150,1976.
13. Meyn, R. E., Hewitt, A. R., and Humphrey, A. M. Evaluation of S Phase
Synchronization by Analysis of DNA Replication in 5-Bromodeoxyuri
dine. Exptl. Cell Ass., 82: 137-142, 1973.
14. Rusconi, A., and Calendi, E. Azione della Daunomicina sulla Sintesi:
Nucleica in Cellule di Epatoma. Tumori, 50: 261-266, 1964.
15. Schneiderman, M. H., Dewey, W. C., Leaper, D. B., and Nagasawa, H.
Use of the Mitotic Selection Procedure for Cell Cycle Analysis. Exptl. Cell
Ass., 74: 430-438, 1972.
16. Silvestrini, A., Di Marco, A., and Dasdia, T. Interference of Daunomycin
with Metabolic Events of the Cell Cycle in Synchronized Cultures of Rat
Fibroblasts. Cancer Ass., 30: 966-973, 1970.
17. Silvestrini, A., Gambarucci, C., and Dasdia, T. Attivita Biologica dell
Adriamicina in vitro. Tumori, 56: 137-148, 1970.
18. Terasima, T., and Tolmach, L. J. Changes in X-Ray Sensitivity of HeLa
Cells during the Division Cycle. Nature, 190: 1210—121
1, 1961.
19. Terasima, T., and Tolmach, L. J. Growth and Nucleic Acid Synthesis in
Synchronously Dividing Populations of HeLa Cells. Exptl. Cell Res., 30:
344—362,
1963.
20. Tobey, R. A. Effects of Cytosine Arabinoside, Daunomycin, Mithramycin,
Azacytidine, Adriamycin, and Camptothecin on Mammalian Cell Cycle
Traverse. Cancer Ass., 32: 2720-2725, 1972.
21. Wang, J. J., Chervinsky, D. S., and Rosen, J. M. Comparative Biochemi
cal Studies of Adriamycin and Daunomycin in Leukemic Cells. Cancer
Ass.,32:511-515,1972.
JANUARY 1977
Downloaded from cancerres.aacrjournals.org on June 16, 2017. © 1977 American Association for Cancer Research.
205
The Effect of Adriamycin on Cell Cycle Progression and DNA
Replication in Chinese Hamster Ovary Cells
Judith M. Clarkson and Ronald M. Humphrey
Cancer Res 1977;37:200-205.
Updated version
E-mail alerts
Reprints and
Subscriptions
Permissions
Access the most recent version of this article at:
http://cancerres.aacrjournals.org/content/37/1/200
Sign up to receive free email-alerts related to this article or journal.
To order reprints of this article or to subscribe to the journal, contact the AACR Publications
Department at [email protected].
To request permission to re-use all or part of this article, contact the AACR Publications
Department at [email protected].
Downloaded from cancerres.aacrjournals.org on June 16, 2017. © 1977 American Association for Cancer Research.
© Copyright 2026 Paperzz