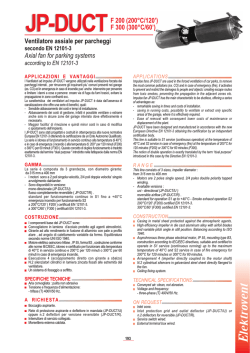
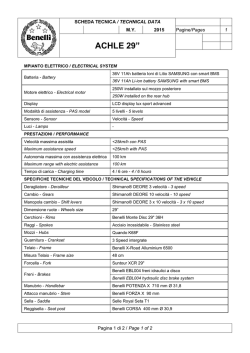
ATP/ATC subsystem testing and validation
using a HIL test rig
F. Addeo1, B. Allotta1, M. Malvezzi1, L. Pugi1, A. Tarasconi1
& M. Violani2
1
2
Department of Energetics “Sergio Stecco”, University of Florence, Italy
UTMR Trenitalia S.p.A, Italy
Abstract
Automatic Train Protection (ATP) systems ensure that trains comply with speed
restrictions and prevents them passing red signals. They are designed in order to
automatically act to slow or stop the train where trains exceed speed limits or
pass signals at danger. Their safety and reliability is then crucial for the safety
and efficiency of the whole railway system. A correct estimation of distance to
target and actual velocity is fundamental to evaluate residual braking resources,
in terms of available deceleration, in order to reach the targets at the required
speeds. The so-called odometry algorithm is the ATP subsystem devoted to train
speed and travelled distance evaluation: it is composed by a series of sensors and
a software procedure that acquires and manages the information from the
sensors. Odometry estimation accuracy has a great influence on the whole ATP
system behavior and then has to be carefully designed and verified. The
validation of such devices could be performed with test runs, but this procedure
has some disadvantages, for example, it is expensive and presents management
difficulties (since these test activities have to be integrated with the normal rail
traffic), testing conditions are not completely controllable etc. In order to
overcome all these problems, Trenitalia S.p.A. and the Energetics Department of
Florence University has designed and realized a HIL (Hardware In the Loop) test
rig for the type approval of odometry devices. In this work the main features of
the odometry device developed for the Italian ATP system (named SCMT) will
be shown, the criteria used to design the tests will be resumed, then the
architecture of the test rig will be presented. The final part of the work will
summarize the results obtained from the testing activities and an estimation of
the odometry subsystem performance (in terms of speed and travelled distance
accuracy).
Keywords: odometry, HIL simulation.
Computers in Railways IX, J. Allan, C. A. Brebbia, R. J. Hill, G. Sciutto & S. Sone (Editors)
© 2004 WIT Press, www.witpress.com, ISBN 1-85312-715-9
412 Computers in Railways IX
1
Introduction
An Automatic Train Control system provides a high level of train safety by
automatically guarding against the consequences of driver errors. Automatic
Train Protection is a part of the so-called Automatic Train Control (ATC), a
more complex system that includes ATP, ATO (Automatic Train Operation) and
ATS (Automatic Train Supervision). This term is adopted to describe the
architecture of the automatically operated railway. Typically an ATP system
includes three components:
• the wayside equipment, which generates codes to be transmitted to the
train;
• the track-to-train transmission system, which transmits information
from the wayside equipment to the train;
• the train on board equipment, which elaborates the information received
from the track and from sensors mounted on the train and decides the
actions to be performed.
The track subsystem gives to the train a series of information, for instance:
• the current position;
• the distance to targets (point in correspondence of which speed
restrictions have to be achieved);
• the target speed (i.e. the speed that has not to be exceeded when the
train passes through a target point).
This information is communicated to the train with the aid of fixed balises or
another kind of absolute information. Between two succeeding information
acquisitions from the ground subsystem, the on-board subsystem continuously
calculates the following data:
• the minimum distance that allows to respect the speed restrictions at the
next objective points: this value depends on the actual train speed, on
the braking parameters and on the objective speed;
• the distance to the next information points.
If the difference between the distance to one or more of the next objective
points and the distance that allows to respect the speed restriction is smaller than
a fixed value, the on-board subsystem intervenes, for instance by activating the
emergency braking.
A correct estimate of distance to target and actual velocity is crucial to
evaluate residual braking resources, in terms of available deceleration, in order to
reach the targets at the required speeds.
In order to perform this estimate, the ERTMS (European Railways Traffic
Management System, the system under development for the European railways)
will probably use a set of sensors including: two encoders positioned on two
independent wheels, a radar sensor positioned on the first vehicle case, and a
longitudinal accelerometer.
Odometry techniques based on sensors located on one or more axles of the
train may be used for dead reckoning between two subsequent exact position
assessments. In this case the current speed is obtained from the measure of the
Computers in Railways IX, J. Allan, C. A. Brebbia, R. J. Hill, G. Sciutto & S. Sone (Editors)
© 2004 WIT Press, www.witpress.com, ISBN 1-85312-715-9
Computers in Railways IX
413
angular speeds of train wheels, while the distance estimation is calculated by
integration of speed information.
Dead reckoning by means of odometry may fail if degraded adhesion in the
wheel-rail interaction occurs, due to rain, fog, ice, leaves, and so on, and the train
is accelerating or braking, i.e. when pure rolling conditions between the wheel
and the rail do not hold anymore, and macroscopic sliding occurs on one or more
of the axles equipped with odometry sensors.
The SCMT (Sistema di Controllo della Marcia dei Treni) is an ATP system
that is being realized for the Italian railways. In this system the track subsystem,
named SST, communicates its information to the train by means of fixed balises.
In the SCMT system, the evaluation of the actual train speed and of the
distance to the next objective points is obtained by elaborating the measures of
two incremental encoders positioned on two independent axles. The SCMT
system contains a module that estimates train speed and position from the data
measured by the sensors. This module is named odometry system and includes a
procedure (named “Odometry Algorithm”), that elaborates data from the track
and from the sensors mounted on the train in order to estimate the current train
speed and position, either when poor adhesion conditions between the wheel and
the rail occur. The odometry system performance, in terms of accuracy of speed
and distance estimation, may affect the whole ATP system performance, in
particular:
• if the odometry system tends to under-estimate the speed and the
current position, the safety of the ATP system may be affected, since the
train “thinks” to have a speed lower than the real one and/or to be at a
distance from the objective greater than the real one, then a possible
intervention of the control system could be delayed and the objective
(for example stopping at a red signal) could be not respected;
• on the other hand, if the odometry system tends to over-estimate the
speed and the current position, the efficiency of the ATP system may be
affected, in this case the train “thinks” to have a speed greater than the
real one and/or to be at a distance from the objective shorter than the
real one, then a possible intervention of the control system or could be
not necessary or anticipated.
For these reasons a particular care have to be put in the design and testing of
such devices. The test of the odometry subsystems could be performed by a
series of test runs, but this way is practically difficult for these reasons:
• a great number of tests are necessary in order to properly validate
device performances;
• some testing conditions cannot be obtained during a run on the rail;
• testing conditions are difficultly controllable and repeatable;
• the testing activities have to be integrated with the normal rail traffic.
Another testing strategy that effectively can overcome all these problems is
represented by a proper HIL test rig [1].
In this paper, the testing activities conducted by means of the odometry test
rig realized by Trenitalia S.p.A. [2] will be described. The main criteria used to
Computers in Railways IX, J. Allan, C. A. Brebbia, R. J. Hill, G. Sciutto & S. Sone (Editors)
© 2004 WIT Press, www.witpress.com, ISBN 1-85312-715-9
414 Computers in Railways IX
design the tests that will be performed on the rig will then be resumed and some
results will be shown in the final part of the paper.
2
Odometry HIL test rig description
Figure 1:
Block diagram of the test rig.
Generally speaking, an HIL simulation consists of the reconstruction, around the
component to be tested, of a hardware/software simulator able to reproduce the
conditions that the component would meet in the real operative conditions.
The HIL test rig developed for the validation of odometry devices has a
software “core”: a numerical model that reproduces the longitudinal dynamics of
a generic train. The model runs in real-time conditions and the operator can, by
means of a graphic interface, interacts with the rig like the train driver, by
accelerating and braking according to the test being simulated. The numerical
model contains the traction and braking systems, including the model of antiskid and anti-slip devices, a wheel/rail contact model, the stiffness and damping
properties of suspensions and so on. The model, from a series of input data (line
properties, type of operation etc.) integrates dynamical equations of the system
and calculates the velocities that the wheels should have in such operational
conditions. These values are the reference inputs for the servo-motors that move
the velocity sensors used by the odometric system.
A hardware simulator of the relative motion between the locomotive body
and the line was realized by means of a conveyor belt rig, which is also managed
Computers in Railways IX, J. Allan, C. A. Brebbia, R. J. Hill, G. Sciutto & S. Sone (Editors)
© 2004 WIT Press, www.witpress.com, ISBN 1-85312-715-9
Computers in Railways IX
415
by brushless servo-motors. The sensor that detects the vehicle translation,
generally consisting of a Doppler-radar, can be installed on the conveyor belt rig.
The odometry system subject to the testing activities acquires the measures
from the sensor and, from them, calculates speed and current position estimation.
The obtained values are then analysed in order to check:
• the correspondence between the specification requirements and the
system response;
• the precision of the odometric estimation in terms of error on speed and
position estimation.
Figure 1 shows the block diagram of the test rig, while figure 2 shows two
photos of the servo-actuators used to move the speed sensors.
a)
Figure 2:
3
b)
The test rig: a) simulator of wheel dynamics, b) simulator of
relative motion between line and locomotive.
Criteria for the design of tests performed on the rig
The tests used to validate the odometry system have to represent all the operative
conditions that the system could meet during its activity. In order to define a
proper set of test cases, an analysis of parameters that mainly influence
odometric estimation performance is necessary.
A first qualitative sensitivity analysis of odometry algorithm showed that the
main parameters that affect system performances are:
• train type and composition,
• brake mode,
• train length,
Computers in Railways IX, J. Allan, C. A. Brebbia, R. J. Hill, G. Sciutto & S. Sone (Editors)
© 2004 WIT Press, www.witpress.com, ISBN 1-85312-715-9
416 Computers in Railways IX
• line gradient,
• adhesion conditions.
The coefficient used to specify the adhesion conditions is the static friction
coefficient, imposed at the beginning of the test. During the test this coefficient
can change, due to the time-history of the wheel slidings.
Table 1:
Parameters used to design the tests.
Train type and composition
Locomotive, empty freight train
Locomotive, loaded freight train
Locomotive, passenger train
Coach, passenger train, traction applied to the end of the train
Train length
Minimum value (on the basis of braked weight percentage)
Maximum value
Intermediate value between the preceding ones
Line gradient
0
±9‰
± 21 ‰
± 35 ‰
Adhesion between the wheel and the rail µ
0.09
0.07
0.05
0.03
Type of operation
A: Acceleration from 0 km/h up to 100 km/h with the maximum traction
torque available (that depends on the adhesion value), three minutes at constant
speed and emergency braking
B: Emergency braking from a speed included in the range between the
maximum speed and 20 km/h
C: Maximum service braking from a speed included in the range between the
maximum speed and 20 km/h
D: Minimum service braking from a speed included in the range between the
maximum speed and 20 km/h
E: Acceleration from 0 up to the maximum speed with the 25, 50, and 75% of
the available traction torque
F: Maximum/minimum service braking from the maximum allowed speed up
to 50% of the maximum speed, followed by an acceleration with the 25, 50, 75,
100 % of the available traction torque
G: Acceleration with the 25, 50, 75, 100 % of the available traction torque
followed by an emergency braking
Computers in Railways IX, J. Allan, C. A. Brebbia, R. J. Hill, G. Sciutto & S. Sone (Editors)
© 2004 WIT Press, www.witpress.com, ISBN 1-85312-715-9
Computers in Railways IX
417
For each parameter the main significative categories were identified, they are
resumed in Table 1. By a combination of all these cases the set of tests necessary
to completely analyse the algorithm behavior were defined.
Once the tests have been realized, the results can be analysed in order to
better understand which parameters have an effective influence on system
performance and how these parameters affect the precision of the estimation.
4
Elaboration of test results
From the experimental tests performed on the rig the following information will
be available:
• actual train speed (calculated by the software simulator);
• actual train position;
• wheel velocities;
• speed and travelled distance evaluated by the odometry system.
From these data the performance of odometry estimation can be evaluated in
terms of precision in the speed and distance estimation.
In particular, the error on speed estimation can be calculated, for each calculus
sample, as follows:
(1)
ε v (i ) = v(i ) − vˆ(i ) ,
where v (i ) represents actual train speed measured at the time sample identified
by the index i, vˆ(i ) is the corresponding speed calculated by the odometry
system, and
ε v (i )
is the error on speed estimation.
The error on the travelled distance can be evaluated as the difference between the
real position and the estimated one, as follows:
(2)
ε s (k ) = s (k ) − sˆ(k ) ,
where s (k ) represents actual train position measured at the in correspondence
of the reference point identified by the index k, sˆ( k ) is the corresponding
position calculated by the odometry system (for example by a numerical
integration of the speed estimation) and ε s (k ) is the error on position
estimation. In this case the evaluation of odometry error is not performed for
each calculus sample, but in correspondence of fixed values of travelled distance
(200, 500, and 1000 m). The results obtained from all the tests are then
elaborated, in order to obtain the statistical distribution of odometry
performance.
Furthermore, the obtained results can be elaborated in order to better
understand the behavior of the odometry system and to identify the main
parameters that influence its performance.
5
Results
In this section some results obtained from the tests will be briefly shown. The
tests performed for the case A and B of type operation were available for this
Computers in Railways IX, J. Allan, C. A. Brebbia, R. J. Hill, G. Sciutto & S. Sone (Editors)
© 2004 WIT Press, www.witpress.com, ISBN 1-85312-715-9
418 Computers in Railways IX
analysis. The data set of available tests used in this analysis was composed by
7170 cases. The first set of results, resumed in Figure 3, shows the dependence
of odometry algorithm on the type of operation.
Base distance 200 m
2500
2000
1500
1000
500
0
-250
-200
-150
-100
-50
0
Error [m]
50
100
150
200
a)
Base distance 200 m, case A
1400
Base distance 200 m: case B
1200
1200
1000
1000
800
800
600
600
400
400
200
200
0
-250
-200
-150
b)
Figure 3:
-100
Error [m]
-50
0
50
0
-100
-50
0
50
100
150
200
c)
Classification of the results in terms of operation type.
The first figure shows the results relative to all the performed tests. As it can
be seen, the distribution has a mean value close to zero and almost all the tests
are comprised in the range ± 20 m, but the curve has a non-perfectly symmetrical
behavior. In particular, from this first qualitative analysis it appears that the
algorithm tends to over-estimate the travelled distance. As discussed in the first
part of the paper, an over-estimation of the distance does not influence the safety
of the ATP system, but can decrease its efficiency. The obtained results were
then analysed by subdividing them on the basis of operation type. The available
tests were relative to cases A and B described in the Table 1. As it can be seen
from Figure 3 b) and c), the type of operation has a significative effect on the
odometry precision. In particular, the results relative to the case A (acceleration
followed by a braking, Figure 3 b)) are characterized by greater (negative) errors.
During the acceleration phase, since in many tests the adhesion between the
wheel and the rail is very low, the axles tends to slip and then their tangential
velocities is greater than the train speed. The odometry algorithm can only
Computers in Railways IX, J. Allan, C. A. Brebbia, R. J. Hill, G. Sciutto & S. Sone (Editors)
© 2004 WIT Press, www.witpress.com, ISBN 1-85312-715-9
Computers in Railways IX
419
partially compensate for this difference and an error in the estimation necessarily
arises.
Base distance 200 m, case B, µ = 0.03
250
Base distance 200 m, case B, µ = 0,05
300
200
250
200
150
150
100
100
50
50
0
-100
-50
0
50
Error [m]
100
150
0
-80
200
-60
-40
-20
a)
20
40
60
80
[m]
b)
Base distance 200 m, case B, µ = 0.07
250
0
Error
Base distance 200 m, case B, µ = 0.09
350
300
200
250
150
200
150
100
100
50
50
0
-100
-80
-60
-40
-20
Error [m]
c)
Figure 4:
0
20
40
0
-100
-80
-60
-40
Error [m]
-20
0
20
d)
Classification of the results in terms of adhesion value.
The second set of results (Figure 4) shows the dependence of the odometry
error on the adhesion between the wheel and the rail. The presented results are
relative to type B operations (emergency braking, see Table 1 for more details).
As it can be seen, for low adhesion values the distribution is “wide”, i.e. it is
characterized by a great dispersion, this means that in this case the error in the
estimation can assume significative values. As the adhesion increases, the
distribution tends to become narrower and the error clearly decreases.
6
Conclusions
The use of a properly designed HIL test rig can effectively represent an
interesting solution for the testing activities necessary to the validation of
odometry devices. Such components have a heavy influence on the performance
of the ATP/ATC control systems, especially on their safety and efficiency.
The use of a HIL test rig allows to greatly simplify validation procedure. Test
runs on the line are no more necessary and then the costs decreases sensibly.
Computers in Railways IX, J. Allan, C. A. Brebbia, R. J. Hill, G. Sciutto & S. Sone (Editors)
© 2004 WIT Press, www.witpress.com, ISBN 1-85312-715-9
420 Computers in Railways IX
Testing conditions are completely controllable and repeatable this permits for
example the comparison between different solutions. Extreme testing conditions
(very low adhesion conditions, axles locking up and so on), that are difficult or
dangerous to be reproduced on the line, can be easily obtained.
The use of such types of test rigs is being extended to the validation of the
whole ATP on board subsystem (including the braking curve calculation and the
intervention of the control system), and to the type approval of anti-skid devices.
References
[1]
[2]
[3]
[4]
[5]
P. Toni, B.Allotta, A.Rindi, Un approccio innovativo alla progettazione di
banchi prova per sistemi ferroviari, Ingegneria ferroviaria, Aprile 2003, n.
4, pp.341-347.
B. Allotta, M. Malvezzi, L. Pugi, M. Rinchi, A. Rindi, P. Toni, A. Amore,
R. Cheli, G. Cocci, P. Presciani, G. Puliatti, “A Test Rig for Evaluating
Odometry Algorithms,” Proc. of 8th Int. Conf. on Computer Aided
Design, Manufacture and Operation in the Railway and Other Advanced
Mass Transit Systems, 12 - 14 June 2002, Lemnos, GR.
TRENITALIA S.p.A. Unità Tecnologie Materiale Rotabile “SCMT
Progetto dell’algoritmo per il calcolo della velocità istantanea del treno e
dello spazio percorso,” UTMR/DT.S.PS, 31/10/2000.
TRENITALIA S.p.A. Unità Tecnologie Materiale Rotabile “Odometria
SCMT:Principi generali dell’algoritmo per il calcolo della velocità stimata
in caso di pattinamento o slittamento degli assi di misura: Specifica
Requisiti Funzionali.” Specifica N. 372574 esp. 03, 28/11/2002.
TRENITALIA S.p.A. Unità Tecnologie Materiale Rotabile “Odometria
SCMT:Principi generali dell’algoritmo per il calcolo della velocità stimata
in caso di pattinamento o slittamento degli assi di misura: Specifica
Requisiti Software” Bozza 4 Specifica N. 373450 esp. 00, 29/11/2002.
Computers in Railways IX, J. Allan, C. A. Brebbia, R. J. Hill, G. Sciutto & S. Sone (Editors)
© 2004 WIT Press, www.witpress.com, ISBN 1-85312-715-9
© Copyright 2026 Paperzz