Chapter 6
Expected Value and Variance
6.1
Expected Value of Discrete Random Variables
When a large collection of numbers is assembled, as in a census, we are usually
interested not in the individual numbers, but rather in certain descriptive quantities
such as the average or the median. In general, the same is true for the probability
distribution of a numerically-valued random variable. In this and in the next section,
we shall discuss two such descriptive quantities: the expected value and the variance.
Both of these quantities apply only to numerically-valued random variables, and so
we assume, in these sections, that all random variables have numerical values. To
give some intuitive justification for our definition, we consider the following game.
Average Value
A die is rolled. If an odd number turns up, we win an amount equal to this number;
if an even number turns up, we lose an amount equal to this number. For example,
if a two turns up we lose 2, and if a three comes up we win 3. We want to decide if
this is a reasonable game to play. We first try simulation. The program Die carries
out this simulation.
The program prints the frequency and the relative frequency with which each
outcome occurs. It also calculates the average winnings. We have run the program
twice. The results are shown in Table 6.1.
In the first run we have played the game 100 times. In this run our average gain
is в€’.57. It looks as if the game is unfavorable, and we wonder how unfavorable it
really is. To get a better idea, we have played the game 10,000 times. In this case
our average gain is в€’.4949.
We note that the relative frequency of each of the six possible outcomes is quite
close to the probability 1/6 for this outcome. This corresponds to our frequency
interpretation of probability. It also suggests that for very large numbers of plays,
our average gain should be
Вµ =
1
1
1
1
1
1
1
в€’2
+3
в€’4
+5
в€’6
6
6
6
6
6
6
225
226
CHAPTER 6. EXPECTED VALUE AND VARIANCE
n = 100
Frequency
Relative
Frequency
17
.17
17
.17
16
.16
18
.18
16
.16
16
.16
Winning
1
-2
3
-4
5
-6
n = 10000
Frequency
Relative
Frequency
1681
.1681
1678
.1678
1626
.1626
1696
.1696
1686
.1686
1633
.1633
Table 6.1: Frequencies for dice game.
=
9 12
3
в€’
= в€’ = в€’.5 .
6
6
6
This agrees quite well with our average gain for 10,000 plays.
We note that the value we have chosen for the average gain is obtained by taking
the possible outcomes, multiplying by the probability, and adding the results. This
suggests the following definition for the expected outcome of an experiment.
Expected Value
Definition 6.1 Let X be a numerically-valued discrete random variable with sample space Ω and distribution function m(x). The expected value E(X) is defined
by
E(X) =
xm(x) ,
x∈Ω
provided this sum converges absolutely. We often refer to the expected value as
the mean, and denote E(X) by Вµ for short. If the above sum does not converge
absolutely, then we say that X does not have an expected value.
вњ·
Example 6.1 Let an experiment consist of tossing a fair coin three times. Let
X denote the number of heads which appear. Then the possible values of X are
0, 1, 2 and 3. The corresponding probabilities are 1/8, 3/8, 3/8, and 1/8. Thus, the
expected value of X equals
0
1
8
+1
3
8
+2
3
8
+3
1
8
=
3
.
2
Later in this section we shall see a quicker way to compute this expected value,
based on the fact that X can be written as a sum of simpler random variables. вњ·
Example 6.2 Suppose that we toss a fair coin until a head first comes up, and let
X represent the number of tosses which were made. Then the possible values of X
are 1, 2, . . ., and the distribution function of X is defined by
m(i) =
1
.
2i
6.1. EXPECTED VALUE
227
(This is just the geometric distribution with parameter 1/2.) Thus, we have
в€ћ
E(X)
=
i
i=1
в€ћ
1
2i
в€ћ
1
1
+
+ В·В·В·
i
2
2i
i=2
=
i=1
=
1+
=
2.
1
1
+ В·В·В·
+
2 22
вњ·
Example 6.3 (Example 6.2 continued) Suppose that we flip a coin until a head
first appears, and if the number of tosses equals n, then we are paid 2n dollars.
What is the expected value of the payment?
We let Y represent the payment. Then,
P (Y = 2n ) =
1
,
2n
for n ≥ 1. Thus,
в€ћ
2n
E(Y ) =
n=1
1
,
2n
which is a divergent sum. Thus, Y has no expectation. This example is called
the St. Petersburg Paradox . The fact that the above sum is infinite suggests that
a player should be willing to pay any fixed amount per game for the privilege of
playing this game. The reader is asked to consider how much he or she would be
willing to pay for this privilege. It is unlikely that the reader’s answer is more than
10 dollars; therein lies the paradox.
In the early history of probability, various mathematicians gave ways to resolve
this paradox. One idea (due to G. Cramer) consists of assuming that the amount
of money in the world is finite. He thus assumes that there is some fixed value of
n such that if the number of tosses equals or exceeds n, the payment is 2n dollars.
The reader is asked to show in Exercise 20 that the expected value of the payment
is now finite.
Daniel Bernoulli and Cramer also considered another way to assign value to
the payment. Their idea was that the value of a payment is some function of the
payment; such a function is now called a utility function. Examples of reasonable
utility functions might include the square-root function or the logarithm function.
In both cases, the value of 2n dollars is less than twice the value of n dollars. It
can easily be shown that in both cases, the expected utility of the payment is finite
(see Exercise 20).
вњ·
228
CHAPTER 6. EXPECTED VALUE AND VARIANCE
Example 6.4 Let T be the time for the first success in a Bernoulli trials process.
Then we take as sample space Ω the integers 1, 2, . . . and assign the geometric
distribution
m(j) = P (T = j) = q jв€’1 p .
Thus,
E(T )
=
1 В· p + 2qp + 3q 2 p + В· В· В·
= p(1 + 2q + 3q 2 + В· В· В·) .
Now if |x| < 1, then
1 + x + x2 + x3 + В· В· В· =
1
.
1в€’x
Differentiating this formula, we get
1 + 2x + 3x2 + В· В· В· =
so
E(T ) =
1
,
(1 в€’ x)2
p
p
1
= 2 = .
2
(1 в€’ q)
p
p
In particular, we see that if we toss a fair coin a sequence of times, the expected
time until the first heads is 1/(1/2) = 2. If we roll a die a sequence of times, the
expected number of rolls until the first six is 1/(1/6) = 6.
вњ·
Interpretation of Expected Value
In statistics, one is frequently concerned with the average value of a set of data.
The following example shows that the ideas of average value and expected value are
very closely related.
Example 6.5 The heights, in inches, of the women on the Swarthmore basketball
team are 5’ 9”, 5’ 9”, 5’ 6”, 5’ 8”, 5’ 11”, 5’ 5”, 5’ 7”, 5’ 6”, 5’ 6”, 5’ 7”, 5’ 10”, and
6’ 0”.
A statistician would compute the average height (in inches) as follows:
69 + 69 + 66 + 68 + 71 + 65 + 67 + 66 + 66 + 67 + 70 + 72
= 67.9 .
12
One can also interpret this number as the expected value of a random variable. To
see this, let an experiment consist of choosing one of the women at random, and let
X denote her height. Then the expected value of X equals 67.9.
вњ·
Of course, just as with the frequency interpretation of probability, to interpret
expected value as an average outcome requires further justification. We know that
for any finite experiment the average of the outcomes is not predictable. However,
we shall eventually prove that the average will usually be close to E(X) if we repeat
the experiment a large number of times. We first need to develop some properties of
the expected value. Using these properties, and those of the concept of the variance
6.1. EXPECTED VALUE
229
X
HHH
HHT
HTH
HTT
THH
THT
TTH
TTT
Y
1
2
3
2
2
3
2
1
Table 6.2: Tossing a coin three times.
to be introduced in the next section, we shall be able to prove the Law of Large
Numbers. This theorem will justify mathematically both our frequency concept
of probability and the interpretation of expected value as the average value to be
expected in a large number of experiments.
Expectation of a Function of a Random Variable
Suppose that X is a discrete random variable with sample space Ω, and φ(x) is
a real-valued function with domain Ω. Then φ(X) is a real-valued random variable. One way to determine the expected value of φ(X) is to first determine the
distribution function of this random variable, and then use the definition of expectation. However, there is a better way to compute the expected value of П†(X), as
demonstrated in the next example.
Example 6.6 Suppose a coin is tossed 9 times, with the result
HHHT T T T HT .
The first set of three heads is called a run. There are three more runs in this
sequence, namely the next four tails, the next head, and the next tail. We do not
consider the first two tosses to constitute a run, since the third toss has the same
value as the first two.
Now suppose an experiment consists of tossing a fair coin three times. Find the
expected number of runs. It will be helpful to think of two random variables, X
and Y , associated with this experiment. We let X denote the sequence of heads and
tails that results when the experiment is performed, and Y denote the number of
runs in the outcome X. The possible outcomes of X and the corresponding values
of Y are shown in Table 6.2.
To calculate E(Y ) using the definition of expectation, we first must find the
distribution function m(y) of Y i.e., we group together those values of X with a
common value of Y and add their probabilities. In this case, we calculate that the
distribution function of Y is: m(1) = 1/4, m(2) = 1/2, and m(3) = 1/4. One easily
finds that E(Y ) = 2.
230
CHAPTER 6. EXPECTED VALUE AND VARIANCE
Now suppose we didn’t group the values of X with a common Y -value, but
instead, for each X-value x, we multiply the probability of x and the corresponding
value of Y , and add the results. We obtain
1
1
8
+2
1
8
+3
1
8
+2
1
8
+2
1
8
+3
1
8
+2
1
8
+1
1
8
,
which equals 2.
This illustrates the following general principle. If X and Y are two random
variables, and Y can be written as a function of X, then one can compute the
expected value of Y using the distribution function of X.
вњ·
Theorem 6.1 If X is a discrete random variable with sample space Ω and distribution function m(x), and if φ : Ω → R is a function, then
E(П†(X)) =
П†(x)m(x) ,
x∈Ω
provided the series converges absolutely.
вњ·
The proof of this theorem is straightforward, involving nothing more than grouping values of X with a common Y -value, as in Example 6.6.
The Sum of Two Random Variables
Many important results in probability theory concern sums of random variables.
We first consider what it means to add two random variables.
Example 6.7 We flip a coin and let X have the value 1 if the coin comes up heads
and 0 if the coin comes up tails. Then, we roll a die and let Y denote the face that
comes up. What does X + Y mean, and what is its distribution? This question
is easily answered in this case, by considering, as we did in Chapter 4, the joint
random variable Z = (X, Y ), whose outcomes are ordered pairs of the form (x, y),
where 0 ≤ x ≤ 1 and 1 ≤ y ≤ 6. The description of the experiment makes it
reasonable to assume that X and Y are independent, so the distribution function
of Z is uniform, with 1/12 assigned to each outcome. Now it is an easy matter to
find the set of outcomes of X + Y , and its distribution function.
вњ·
In Example 6.1, the random variable X denoted the number of heads which
occur when a fair coin is tossed three times. It is natural to think of X as the
sum of the random variables X1 , X2 , X3 , where Xi is defined to be 1 if the ith toss
comes up heads, and 0 if the ith toss comes up tails. The expected values of the
Xi ’s are extremely easy to compute. It turns out that the expected value of X can
be obtained by simply adding the expected values of the Xi ’s. This fact is stated
in the following theorem.
6.1. EXPECTED VALUE
231
Theorem 6.2 Let X and Y be random variables with finite expected values. Then
E(X + Y ) = E(X) + E(Y ) ,
and if c is any constant, then
E(cX) = cE(X) .
Proof. Let the sample spaces of X and Y be denoted by ΩX and ΩY , and suppose
that
ΩX = {x1 , x2 , . . .}
and
ΩY = {y1 , y2 , . . .} .
Then we can consider the random variable X + Y to be the result of applying the
function П†(x, y) = x+y to the joint random variable (X, Y ). Then, by Theorem 6.1,
we have
E(X + Y )
=
(xj + yk )P (X = xj , Y = yk )
j
k
j
k
xj P (X = xj , Y = yk ) +
=
=
yk P (X = xj , Y = yk )
j
xj P (X = xj ) +
j
k
yk P (Y = yk ) .
k
The last equality follows from the fact that
P (X = xj , Y = yk ) = P (X = xj )
k
and
P (X = xj , Y = yk ) = P (Y = yk ) .
j
Thus,
E(X + Y ) = E(X) + E(Y ) .
If c is any constant,
E(cX)
=
cxj P (X = xj )
j
= c
xj P (X = xj )
j
= cE(X) .
вњ·
232
CHAPTER 6. EXPECTED VALUE AND VARIANCE
a
a
b
b
c
c
X
b
c
a
c
a
b
c
b
c
a
b
a
Y
3
1
1
0
0
1
Table 6.3: Number of fixed points.
It is easy to prove by mathematical induction that the expected value of the sum
of any finite number of random variables is the sum of the expected values of the
individual random variables.
It is important to note that mutual independence of the summands was not
needed as a hypothesis in the Theorem 6.2 and its generalization. The fact that
expectations add, whether or not the summands are mutually independent, is sometimes referred to as the First Fundamental Mystery of Probability.
Example 6.8 Let Y be the number of fixed points in a random permutation of
the set {a, b, c}. To find the expected value of Y , it is helpful to consider the basic
random variable associated with this experiment, namely the random variable X
which represents the random permutation. There are six possible outcomes of X,
and we assign to each of them the probability 1/6 see Table 6.3. Then we can
calculate E(Y ) using Theorem 6.1, as
3
1
1
1
1
1
1
+1
+1
+0
+0
+1
=1.
6
6
6
6
6
6
We now give a very quick way to calculate the average number of fixed points
in a random permutation of the set {1, 2, 3, . . . , n}. Let Z denote the random
permutation. For each i, 1 ≤ i ≤ n, let Xi equal 1 if Z fixes i, and 0 otherwise. So
if we let F denote the number of fixed points in Z, then
F = X1 + X2 + В· В· В· + Xn .
Therefore, Theorem 6.2 implies that
E(F ) = E(X1 ) + E(X2 ) + В· В· В· + E(Xn ) .
But it is easy to see that for each i,
E(Xi ) =
1
,
n
so
E(F ) = 1 .
This method of calculation of the expected value is frequently very useful. It applies
whenever the random variable in question can be written as a sum of simpler random
variables. We emphasize again that it is not necessary that the summands be
mutually independent.
вњ·
6.1. EXPECTED VALUE
233
Bernoulli Trials
Theorem 6.3 Let Sn be the number of successes in n Bernoulli trials with probability p for success on each trial. Then the expected number of successes is np.
That is,
E(Sn ) = np .
Proof. Let Xj be a random variable which has the value 1 if the jth outcome is a
success and 0 if it is a failure. Then, for each Xj ,
E(Xj ) = 0 В· (1 в€’ p) + 1 В· p = p .
Since
Sn = X 1 + X 2 + В· В· В· + X n ,
and the expected value of the sum is the sum of the expected values, we have
E(Sn )
= E(X1 ) + E(X2 ) + В· В· В· + E(Xn )
= np .
вњ·
Poisson Distribution
Recall that the Poisson distribution with parameter О» was obtained as a limit of
binomial distributions with parameters n and p, where it was assumed that np = О»,
and n в†’ в€ћ. Since for each n, the corresponding binomial distribution has expected
value О», it is reasonable to guess that the expected value of a Poisson distribution
with parameter О» also has expectation equal to О». This is in fact the case, and the
reader is invited to show this (see Exercise 21).
Independence
If X and Y are two random variables, it is not true in general that E(X В· Y ) =
E(X)E(Y ). However, this is true if X and Y are independent.
Theorem 6.4 If X and Y are independent random variables, then
E(X В· Y ) = E(X)E(Y ) .
Proof. Suppose that
ΩX = {x1 , x2 , . . .}
and
ΩY = {y1 , y2 , . . .}
234
CHAPTER 6. EXPECTED VALUE AND VARIANCE
are the sample spaces of X and Y , respectively. Using Theorem 6.1, we have
E(X В· Y ) =
xj yk P (X = xj , Y = yk ) .
j
k
But if X and Y are independent,
P (X = xj , Y = yk ) = P (X = xj )P (Y = yk ) .
Thus,
E(X В· Y )
=
xj yk P (X = xj )P (Y = yk )
j
k
пЈ«
пЈ¶
= пЈ
xj P (X = xj )пЈё
j
yk P (Y = yk )
k
= E(X)E(Y ) .
вњ·
Example 6.9 A coin is tossed twice. Xi = 1 if the ith toss is heads and 0 otherwise.
We know that X1 and X2 are independent. They each have expected value 1/2.
Thus E(X1 В· X2 ) = E(X1 )E(X2 ) = (1/2)(1/2) = 1/4.
вњ·
We next give a simple example to show that the expected values need not multiply if the random variables are not independent.
Example 6.10 Consider a single toss of a coin. We define the random variable X
to be 1 if heads turns up and 0 if tails turns up, and we set Y = 1 в€’ X. Then
E(X) = E(Y ) = 1/2. But X В· Y = 0 for either outcome. Hence, E(X В· Y ) = 0 =
E(X)E(Y ).
вњ·
We return to our records example of Section 3.1 for another application of the
result that the expected value of the sum of random variables is the sum of the
expected values of the individual random variables.
Records
Example 6.11 We start keeping snowfall records this year and want to find the
expected number of records that will occur in the next n years. The first year is
necessarily a record. The second year will be a record if the snowfall in the second
year is greater than that in the first year. By symmetry, this probability is 1/2.
More generally, let Xj be 1 if the jth year is a record and 0 otherwise. To find
E(Xj ), we need only find the probability that the jth year is a record. But the
record snowfall for the first j years is equally likely to fall in any one of these years,
6.1. EXPECTED VALUE
235
so E(Xj ) = 1/j. Therefore, if Sn is the total number of records observed in the
first n years,
1 1
1
E(Sn ) = 1 + + + В· В· В· + .
2 3
n
This is the famous divergent harmonic series. It is easy to show that
E(Sn ) в€ј log n
as n в†’ в€ћ. A more accurate approximation to E(Sn ) is given by the expression
log n + Оі +
1
,
2n
where γ denotes Euler’s constant, and is approximately equal to .5772.
Therefore, in ten years the expected number of records is approximately 2.9298;
the exact value is the sum of the first ten terms of the harmonic series which is
2.9290.
вњ·
Craps
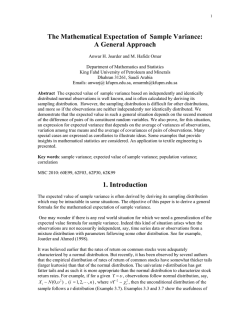
Example 6.12 In the game of craps, the player makes a bet and rolls a pair of
dice. If the sum of the numbers is 7 or 11 the player wins, if it is 2, 3, or 12 the
player loses. If any other number results, say r, then r becomes the player’s point
and he continues to roll until either r or 7 occurs. If r comes up first he wins, and
if 7 comes up first he loses. The program Craps simulates playing this game a
number of times.
We have run the program for 1000 plays in which the player bets 1 dollar each
time. The player’s average winnings were −.006. The game of craps would seem
to be only slightly unfavorable. Let us calculate the expected winnings on a single
play and see if this is the case. We construct a two-stage tree measure as shown in
Figure 6.1.
The first stage represents the possible sums for his first roll. The second stage
represents the possible outcomes for the game if it has not ended on the first roll. In
this stage we are representing the possible outcomes of a sequence of rolls required
to determine the final outcome. The branch probabilities for the first stage are
computed in the usual way assuming all 36 possibilites for outcomes for the pair of
dice are equally likely. For the second stage we assume that the game will eventually
end, and we compute the conditional probabilities for obtaining either the point or
a 7. For example, assume that the player’s point is 6. Then the game will end when
one of the eleven pairs, (1, 5), (2, 4), (3, 3), (4, 2), (5, 1), (1, 6), (2, 5), (3, 4), (4, 3),
(5, 2), (6, 1), occurs. We assume that each of these possible pairs has the same
probability. Then the player wins in the first five cases and loses in the last six.
Thus the probability of winning is 5/11 and the probability of losing is 6/11. From
the path probabilities, we can find the probability that the player wins 1 dollar; it
is 244/495. The probability of losing is then 251/495. Thus if X is his winning for
236
CHAPTER 6. EXPECTED VALUE AND VARIANCE
(7,11) W
1/3
W
1/36
2/3
L
2/36
2/5
W
2/45
3/5
L
3/45
5/11
W
25/396
6/11
L
30/396
W
25/396
6/11
L
30/396
2/5
W
2/45
3/5
L
3/45
1/3
W
1/36
2/3
L
2/36
4
2/9
1/12
5
1/9
5/36
6
5/36
5/11
8
1/9
1/12
9
1/9
10
(2,3,12) L
Figure 6.1: Tree measure for craps.
6.1. EXPECTED VALUE
237
a dollar bet,
E(X)
251
244
+ (в€’1)
495
495
7
= в€’
≈ −.0141 .
495
=
1
The game is unfavorable, but only slightly. The player’s expected gain in n plays is
в€’n(.0141). If n is not large, this is a small expected loss for the player. The casino
makes a large number of plays and so can afford a small average gain per play and
still expect a large profit.
вњ·
Roulette
Example 6.13 In Las Vegas, a roulette wheel has 38 slots numbered 0, 00, 1, 2,
. . . , 36. The 0 and 00 slots are green, and half of the remaining 36 slots are red
and half are black. A croupier spins the wheel and throws an ivory ball. If you bet
1 dollar on red, you win 1 dollar if the ball stops in a red slot, and otherwise you
lose a dollar. We wish to calculate the expected value of your winnings, if you bet
1 dollar on red.
Let X be the random variable which denotes your winnings in a 1 dollar bet on
red in Las Vegas roulette. Then the distribution of X is given by
mX =
в€’1
20/38
1
18/38
,
and one can easily calculate (see Exercise 5) that
E(X) ≈ −.0526 .
We now consider the roulette game in Monte Carlo, and follow the treatment
of Sagan.1 In the roulette game in Monte Carlo there is only one 0. If you bet 1
franc on red and a 0 turns up, then, depending upon the casino, one or more of the
following options may be offered:
(a) You get 1/2 of your bet back, and the casino gets the other half of your bet.
(b) Your bet is put “in prison,” which we will denote by P1 . If red comes up on
the next turn, you get your bet back (but you don’t win any money). If black or 0
comes up, you lose your bet.
(c) Your bet is put in prison P1 , as before. If red comes up on the next turn, you
get your bet back, and if black comes up on the next turn, then you lose your bet.
If a 0 comes up on the next turn, then your bet is put into double prison, which we
will denote by P2 . If your bet is in double prison, and if red comes up on the next
turn, then your bet is moved back to prison P1 and the game proceeds as before.
If your bet is in double prison, and if black or 0 come up on the next turn, then
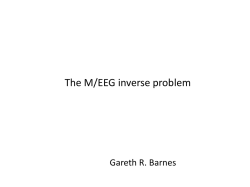
you lose your bet. We refer the reader to Figure 6.2, where a tree for this option is
shown. In this figure, S is the starting position, W means that you win your bet,
L means that you lose your bet, and E means that you break even.
1 H.
Sagan, Markov Chains in Monte Carlo, Math. Mag., vol. 54, no. 1 (1981), pp. 3-10.
238
CHAPTER 6. EXPECTED VALUE AND VARIANCE
W
S
L
E
P1
L
P1
L
P2
L
P2
E
P1
L
L
L
Figure 6.2: Tree for 2-prison Monte Carlo roulette.
It is interesting to compare the expected winnings of a 1 franc bet on red, under
each of these three options. We leave the first two calculations as an exercise (see
Exercise 37). Suppose that you choose to play alternative (c). The calculation for
this case illustrates the way that the early French probabilists worked problems like
this.
Suppose you bet on red, you choose alternative (c), and a 0 comes up. Your
possible future outcomes are shown in the tree diagram in Figure 6.3. Assume that
your money is in the first prison and let x be the probability that you lose your
franc. From the tree diagram we see that
x=
1
18
+ P (you lose your franc | your franc is in P2 ) .
37 37
Also,
P (you lose your franc | your franc is in P2 ) =
19 18
+ x.
37 37
So, we have
18
1 19 18
+
+ x .
37 37 37 37
Solving for x, we obtain x = 685/1351. Thus, starting at S, the probability that
you lose your bet equals
18
1
25003
+ x=
.
37 37
49987
To find the probability that you win when you bet on red, note that you can
only win if red comes up on the first turn, and this happens with probability 18/37.
Thus your expected winnings are
x=
1В·
18
25003
687
в€’1В·
=в€’
≈ −.0137 .
37
49987
49987
6.1. EXPECTED VALUE
239
L
18/37
P1
18/37
W
L
19/37
1/37
P2
18/37
P1
Figure 6.3: Your money is put in prison.
It is interesting to note that the more romantic option (c) is less favorable than
option (a) (see Exercise 37).
If you bet 1 dollar on the number 17, then the distribution function for your
winnings X is
в€’1
35
PX =
,
36/37 1/37
and the expected winnings are
в€’1 В·
36
1
1
+ 35 В·
=в€’
≈ −.027 .
37
37
37
Thus, at Monte Carlo different bets have different expected values. In Las Vegas
almost all bets have the same expected value of в€’2/38 = в€’.0526 (see Exercises 4
and 5).
вњ·
Conditional Expectation
Definition 6.2 If F is any event and X is a random variable with sample space
Ω = {x1 , x2 , . . .}, then the conditional expectation given F is defined by
xj P (X = xj |F ) .
E(X|F ) =
j
Conditional expectation is used most often in the form provided by the following
theorem.
вњ·
Theorem 6.5 Let X be a random variable with sample space Ω. If F1 , F2 , . . . , Fr
are events such that Fi ∩ Fj = ∅ for i = j and Ω = ∪j Fj , then
E(X) =
E(X|Fj )P (Fj ) .
j
240
CHAPTER 6. EXPECTED VALUE AND VARIANCE
Proof. We have
E(X|Fj )P (Fj )
xk P (X = xk |Fj )P (Fj )
=
j
j
k
j
k
k
j
=
xk P (X = xk and Fj occurs)
=
xk P (X = xk and Fj occurs)
=
xk P (X = xk )
k
= E(X) .
вњ·
Example 6.14 (Example 6.12 continued) Let T be the number of rolls in a single
play of craps. We can think of a single play as a two-stage process. The first stage
consists of a single roll of a pair of dice. The play is over if this roll is a 2, 3, 7,
11, or 12. Otherwise, the player’s point is established, and the second stage begins.
This second stage consists of a sequence of rolls which ends when either the player’s
point or a 7 is rolled. We record the outcomes of this two-stage experiment using
the random variables X and S, where X denotes the first roll, and S denotes the
number of rolls in the second stage of the experiment (of course, S is sometimes
equal to 0). Note that T = S + 1. Then by Theorem 6.5
12
E(T |X = j)P (X = j) .
E(T ) =
j=2
If j = 7, 11 or 2, 3, 12, then E(T |X = j) = 1. If j = 4, 5, 6, 8, 9, or 10, we can
use Example 6.4 to calculate the expected value of S. In each of these cases, we
continue rolling until we get either a j or a 7. Thus, S is geometrically distributed
with parameter p, which depends upon j. If j = 4, for example, the value of p is
3/36 + 6/36 = 1/4. Thus, in this case, the expected number of additional rolls is
1/p = 4, so E(T |X = 4) = 1 + 4 = 5. Carrying out the corresponding calculations
for the other possible values of j and using Theorem 6.5 gives
E(T )
12
+ 1+
36
36
+ 1+
5+6
36
+ 1+
4+6
557
=
165
≈ 3.375 . . . .
=
1
36
3+6
5
+
36
4
+
36
3
+ 1+
36
36
1+
5+6
36
1+
3+6
36
4+6
5
36
3
36
4
36
вњ·
6.1. EXPECTED VALUE
241
Martingales
We can extend the notion of fairness to a player playing a sequence of games by
using the concept of conditional expectation.
Example 6.15 Let S1 , S2 , . . . , Sn be Peter’s accumulated fortune in playing heads
or tails (see Example 1.4). Then
E(Sn |Snв€’1 = a, . . . , S1 = r) =
1
1
(a + 1) + (a в€’ 1) = a .
2
2
We note that Peter’s expected fortune after the next play is equal to his present
fortune. When this occurs, we say the game is fair. A fair game is also called a
martingale. If the coin is biased and comes up heads with probability p and tails
with probability q = 1 в€’ p, then
E(Sn |Snв€’1 = a, . . . , S1 = r) = p(a + 1) + q(a в€’ 1) = a + p в€’ q .
Thus, if p < q, this game is unfavorable, and if p > q, it is favorable.
вњ·
If you are in a casino, you will see players adopting elaborate systems of play
to try to make unfavorable games favorable. Two such systems, the martingale
doubling system and the more conservative Labouchere system, were described in
Exercises 1.1.9 and 1.1.10. Unfortunately, such systems cannot change even a fair
game into a favorable game.
Even so, it is a favorite pastime of many people to develop systems of play for
gambling games and for other games such as the stock market. We close this section
with a simple illustration of such a system.
Stock Prices
Example 6.16 Let us assume that a stock increases or decreases in value each
day by 1 dollar, each with probability 1/2. Then we can identify this simplified
model with our familiar game of heads or tails. We assume that a buyer, Mr. Ace,
adopts the following strategy. He buys the stock on the first day at its price V .
He then waits until the price of the stock increases by one to V + 1 and sells. He
then continues to watch the stock until its price falls back to V . He buys again and
waits until it goes up to V + 1 and sells. Thus he holds the stock in intervals during
which it increases by 1 dollar. In each such interval, he makes a profit of 1 dollar.
However, we assume that he can do this only for a finite number of trading days.
Thus he can lose if, in the last interval that he holds the stock, it does not get back
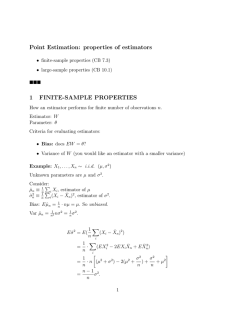
up to V + 1; and this is the only way he can lose. In Figure 6.4 we illustrate a
typical history if Mr. Ace must stop in twenty days. Mr. Ace holds the stock under
his system during the days indicated by broken lines. We note that for the history
shown in Figure 6.4, his system nets him a gain of 4 dollars.
We have written a program StockSystem to simulate the fortune of Mr. Ace
if he uses his sytem over an n-day period. If one runs this program a large number
242
CHAPTER 6. EXPECTED VALUE AND VARIANCE
2
1.5
1
0.5
5
10
15
20
-0.5
-1
Figure 6.4: Mr. Ace’s system.
of times, for n = 20, say, one finds that his expected winnings are very close to 0,
but the probability that he is ahead after 20 days is significantly greater than 1/2.
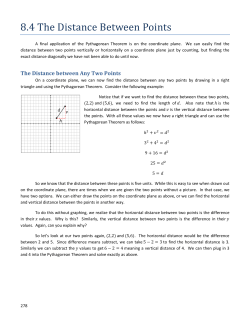
For small values of n, the exact distribution of winnings can be calculated. The
distribution for the case n = 20 is shown in Figure 6.5. Using this distribution,
it is easy to calculate that the expected value of his winnings is exactly 0. This
is another instance of the fact that a fair game (a martingale) remains fair under
quite general systems of play.
Although the expected value of his winnings is 0, the probability that Mr. Ace is
ahead after 20 days is about .610. Thus, he would be able to tell his friends that his
system gives him a better chance of being ahead than that of someone who simply
buys the stock and holds it, if our simple random model is correct. There have been
a number of studies to determine how random the stock market is.
вњ·
Historical Remarks
With the Law of Large Numbers to bolster the frequency interpretation of probability, we find it natural to justify the definition of expected value in terms of the
average outcome over a large number of repetitions of the experiment. The concept
of expected value was used before it was formally defined; and when it was used,
it was considered not as an average value but rather as the appropriate value for
a gamble. For example recall, from the Historical Remarks section of Chapter 1,
Section 1.2, Pascal’s way of finding the value of a three-game series that had to be
called off before it is finished.
Pascal first observed that if each player has only one game to win, then the
stake of 64 pistoles should be divided evenly. Then he considered the case where
one player has won two games and the other one.
Then consider, Sir, if the first man wins, he gets 64 pistoles, if he loses
he gets 32. Thus if they do not wish to risk this last game, but wish
6.1. EXPECTED VALUE
243
0.2
0.15
0.1
0.05
0
-20
-15
-10
-5
0
5
10
Figure 6.5: Winnings distribution for n = 20.
to separate without playing it, the first man must say: “I am certain
to get 32 pistoles, even if I lose I still get them; but as for the other
32 pistoles, perhaps I will get them, perhaps you will get them, the
chances are equal. Let us then divide these 32 pistoles in half and give
one half to me as well as my 32 which are mine for sure.” He will then
have 48 pistoles and the other 16.2
Note that Pascal reduced the problem to a symmetric bet in which each player
gets the same amount and takes it as obvious that in this case the stakes should be
divided equally.
The first systematic study of expected value appears in Huygens’ book. Like
Pascal, Huygens find the value of a gamble by assuming that the answer is obvious
for certain symmetric situations and uses this to deduce the expected for the general
situation. He does this in steps. His first proposition is
Prop. I. If I expect a or b, either of which, with equal probability, may
fall to me, then my Expectation is worth (a + b)/2, that is, the half Sum
of a and b.3
Huygens proved this as follows: Assume that two player A and B play a game in
which each player puts up a stake of (a + b)/2 with an equal chance of winning the
total stake. Then the value of the game to each player is (a + b)/2. For example, if
the game had to be called off clearly each player should just get back his original
stake. Now, by symmetry, this value is not changed if we add the condition that
the winner of the game has to pay the loser an amount b as a consolation prize.
Then for player A the value is still (a + b)/2. But what are his possible outcomes
2 Quoted
in F. N. David, Games, Gods and Gambling (London: Griffin, 1962), p. 231.
Huygens, Calculating in Games of Chance, translation attributed to John Arbuthnot (London, 1692), p. 34.
3 C.
244
CHAPTER 6. EXPECTED VALUE AND VARIANCE
for the modified game? If he wins he gets the total stake a + b and must pay B an
amount b so ends up with a. If he loses he gets an amount b from player B. Thus
player A wins a or b with equal chances and the value to him is (a + b)/2.
Huygens illustrated this proof in terms of an example. If you are offered a game
in which you have an equal chance of winning 2 or 8, the expected value is 5, since
this game is equivalent to the game in which each player stakes 5 and agrees to pay
the loser 3 — a game in which the value is obviously 5.
Huygens’ second proposition is
Prop. II. If I expect a, b, or c, either of which, with equal facility, may
happen, then the Value of my Expectation is (a + b + c)/3, or the third
of the Sum of a, b, and c.4
His argument here is similar. Three players, A, B, and C, each stake
(a + b + c)/3
in a game they have an equal chance of winning. The value of this game to player
A is clearly the amount he has staked. Further, this value is not changed if A enters
into an agreement with B that if one of them wins he pays the other a consolation
prize of b and with C that if one of them wins he pays the other a consolation prize
of c. By symmetry these agreements do not change the value of the game. In this
modified game, if A wins he wins the total stake a + b + c minus the consolation
prizes b + c giving him a final winning of a. If B wins, A wins b and if C wins, A
wins c. Thus A finds himself in a game with value (a + b + c)/3 and with outcomes
a, b, and c occurring with equal chance. This proves Proposition II.
More generally, this reasoning shows that if there are n outcomes
a1 , a2 , . . . , an ,
all occurring with the same probability, the expected value is
a1 + a2 + В· В· В· + an
.
n
In his third proposition Huygens considered the case where you win a or b but
with unequal probabilities. He assumed there are p chances of winning a, and q
chances of winning b, all having the same probability. He then showed that the
expected value is
p
q
E=
В·a+
В·b .
p+q
p+q
This follows by considering an equivalent gamble with p + q outcomes all occurring
with the same probability and with a payoff of a in p of the outcomes and b in q of
the outcomes. This allowed Huygens to compute the expected value for experiments
with unequal probabilities, at least when these probablities are rational numbers.
Thus, instead of defining the expected value as a weighted average, Huygens
assumed that the expected value of certain symmetric gambles are known and deduced the other values from these. Although this requires a good deal of clever
4 ibid.,
p. 35.
6.1. EXPECTED VALUE
245
manipulation, Huygens ended up with values that agree with those given by our
modern definition of expected value. One advantage of this method is that it gives
a justification for the expected value in cases where it is not reasonable to assume
that you can repeat the experiment a large number of times, as for example, in
betting that at least two presidents died on the same day of the year. (In fact,
three did; all were signers of the Declaration of Independence, and all three died on
July 4.)
In his book, Huygens calculated the expected value of games using techniques
similar to those which we used in computing the expected value for roulette at
Monte Carlo. For example, his proposition XIV is:
Prop. XIV. If I were playing with another by turns, with two Dice, on
this Condition, that if I throw 7 I gain, and if he throws 6 he gains
allowing him the first Throw: To find the proportion of my Hazard to
his.5
A modern description of this game is as follows. Huygens and his opponent take
turns rolling a die. The game is over if Huygens rolls a 7 or his opponent rolls a 6.
His opponent rolls first. What is the probability that Huygens wins the game?
To solve this problem Huygens let x be his chance of winning when his opponent
threw first and y his chance of winning when he threw first. Then on the first roll
his opponent wins on 5 out of the 36 possibilities. Thus,
x=
31
В·y .
36
But when Huygens rolls he wins on 6 out of the 36 possible outcomes, and in the
other 30, he is led back to where his chances are x. Thus
y=
6
30
+
В·x .
36 36
From these two equations Huygens found that x = 31/61.
Another early use of expected value appeared in Pascal’s argument to show that
a rational person should believe in the existence of God.6 Pascal said that we have
to make a wager whether to believe or not to believe. Let p denote the probability
that God does not exist. His discussion suggests that we are playing a game with
two strategies, believe and not believe, with payoffs as shown in Table 6.4.
Here в€’u represents the cost to you of passing up some worldly pleasures as
a consequence of believing that God exists. If you do not believe, and God is a
vengeful God, you will lose x. If God exists and you do believe you will gain v.
Now to determine which strategy is best you should compare the two expected
values
p(в€’u) + (1 в€’ p)v
and
p0 + (1 в€’ p)(в€’x),
5 ibid.,
p. 47.
in I. Hacking, The Emergence of Probability (Cambridge: Cambridge Univ. Press,
6 Quoted
1975).
246
CHAPTER 6. EXPECTED VALUE AND VARIANCE
God does not exist
1в€’p
p
в€’u
0
believe
not believe
God exists
v
в€’x
Table 6.4: Payoffs.
Age
0
6
16
26
36
46
56
66
76
Survivors
100
64
40
25
16
10
6
3
1
Table 6.5: Graunt’s mortality data.
and choose the larger of the two. In general, the choice will depend upon the value of
p. But Pascal assumed that the value of v is infinite and so the strategy of believing
is best no matter what probability you assign for the existence of God. This example
is considered by some to be the beginning of decision theory. Decision analyses of
this kind appear today in many fields, and, in particular, are an important part of
medical diagnostics and corporate business decisions.
Another early use of expected value was to decide the price of annuities. The
study of statistics has its origins in the use of the bills of mortality kept in the
parishes in London from 1603. These records kept a weekly tally of christenings
and burials. From these John Graunt made estimates for the population of London
and also provided the first mortality data,7 shown in Table 6.5.
As Hacking observes, Graunt apparently constructed this table by assuming
that after the age of 6 there is a constant probability of about 5/8 of surviving
for another decade.8 For example, of the 64 people who survive to age 6, 5/8 of
64 or 40 survive to 16, 5/8 of these 40 or 25 survive to 26, and so forth. Of course,
he rounded off his figures to the nearest whole person.
Clearly, a constant mortality rate cannot be correct throughout the whole range,
and later tables provided by Halley were more realistic in this respect.9
7 ibid.,
p. 108.
p. 109.
9 E. Halley, “An Estimate of The Degrees of Mortality of Mankind,” Phil. Trans. Royal. Soc.,
8 ibid.,
6.1. EXPECTED VALUE
247
A terminal annuity provides a fixed amount of money during a period of n years.
To determine the price of a terminal annuity one needs only to know the appropriate
interest rate. A life annuity provides a fixed amount during each year of the buyer’s
life. The appropriate price for a life annuity is the expected value of the terminal
annuity evaluated for the random lifetime of the buyer. Thus, the work of Huygens
in introducing expected value and the work of Graunt and Halley in determining
mortality tables led to a more rational method for pricing annuities. This was one
of the first serious uses of probability theory outside the gambling houses.
Although expected value plays a role now in every branch of science, it retains
its importance in the casino. In 1962, Edward Thorp’s book Beat the Dealer 10
provided the reader with a strategy for playing the popular casino game of blackjack
that would assure the player a positive expected winning. This book forevermore
changed the belief of the casinos that they could not be beat.
Exercises
1 A card is drawn at random from a deck consisting of cards numbered 2
through 10. A player wins 1 dollar if the number on the card is odd and
loses 1 dollar if the number if even. What is the expected value of his winnings?
2 A card is drawn at random from a deck of playing cards. If it is red, the player
wins 1 dollar; if it is black, the player loses 2 dollars. Find the expected value
of the game.
3 In a class there are 20 students: 3 are 5’ 6”, 5 are 5’8”, 4 are 5’10”, 4 are
6’, and 4 are 6’ 2”. A student is chosen at random. What is the student’s
expected height?
4 In Las Vegas the roulette wheel has a 0 and a 00 and then the numbers 1 to 36
marked on equal slots; the wheel is spun and a ball stops randomly in one
slot. When a player bets 1 dollar on a number, he receives 36 dollars if the
ball stops on this number, for a net gain of 35 dollars; otherwise, he loses his
dollar bet. Find the expected value for his winnings.
5 In a second version of roulette in Las Vegas, a player bets on red or black.
Half of the numbers from 1 to 36 are red, and half are black. If a player bets
a dollar on black, and if the ball stops on a black number, he gets his dollar
back and another dollar. If the ball stops on a red number or on 0 or 00 he
loses his dollar. Find the expected winnings for this bet.
6 A die is rolled twice. Let X denote the sum of the two numbers that turn up,
and Y the difference of the numbers (specifically, the number on the first roll
minus the number on the second). Show that E(XY ) = E(X)E(Y ). Are X
and Y independent?
vol. 17 (1693), pp. 596–610; 654–656.
10 E. Thorp, Beat the Dealer (New York: Random House, 1962).
248
CHAPTER 6. EXPECTED VALUE AND VARIANCE
*7 Show that, if X and Y are random variables taking on only two values each,
and if E(XY ) = E(X)E(Y ), then X and Y are independent.
8 A royal family has children until it has a boy or until it has three children,
whichever comes first. Assume that each child is a boy with probability 1/2.
Find the expected number of boys in this royal family and the expected number of girls.
9 If the first roll in a game of craps is neither a natural nor craps, the player
can make an additional bet, equal to his original one, that he will make his
point before a seven turns up. If his point is four or ten he is paid off at 2 : 1
odds; if it is a five or nine he is paid off at odds 3 : 2; and if it is a six or eight
he is paid off at odds 6 : 5. Find the player’s expected winnings if he makes
this additional bet when he has the opportunity.
10 In Example 6.16 assume that Mr. Ace decides to buy the stock and hold it
until it goes up 1 dollar and then sell and not buy again. Modify the program
StockSystem to find the distribution of his profit under this system after
a twenty-day period. Find the expected profit and the probability that he
comes out ahead.
11 On September 26, 1980, the New York Times reported that a mysterious
stranger strode into a Las Vegas casino, placed a single bet of 777,000 dollars
on the “don’t pass” line at the crap table, and walked away with more than
1.5 million dollars. In the “don’t pass” bet, the bettor is essentially betting
with the house. An exception occurs if the roller rolls a 12 on the first roll.
In this case, the roller loses and the “don’t pass” better just gets back the
money bet instead of winning. Show that the “don’t pass” bettor has a more
favorable bet than the roller.
12 Recall that in the martingale doubling system (see Exercise 1.1.10), the player
doubles his bet each time he loses. Suppose that you are playing roulette in
a fair casino where there are no 0’s, and you bet on red each time. You then
win with probability 1/2 each time. Assume that you enter the casino with
100 dollars, start with a 1-dollar bet and employ the martingale system. You
stop as soon as you have won one bet, or in the unlikely event that black
turns up six times in a row so that you are down 63 dollars and cannot make
the required 64-dollar bet. Find your expected winnings under this system of
play.
13 You have 80 dollars and play the following game. An urn contains two white
balls and two black balls. You draw the balls out one at a time without
replacement until all the balls are gone. On each draw, you bet half of your
present fortune that you will draw a white ball. What is your expected final
fortune?
14 In the hat check problem (see Example 3.12), it was assumed that N people
check their hats and the hats are handed back at random. Let Xj = 1 if the
6.1. EXPECTED VALUE
249
jth person gets his or her hat and 0 otherwise. Find E(Xj ) and E(Xj В· Xk )
for j not equal to k. Are Xj and Xk independent?
15 A box contains two gold balls and three silver balls. You are allowed to choose
successively balls from the box at random. You win 1 dollar each time you
draw a gold ball and lose 1 dollar each time you draw a silver ball. After a
draw, the ball is not replaced. Show that, if you draw until you are ahead by
1 dollar or until there are no more gold balls, this is a favorable game.
16 Gerolamo Cardano in his book, The Gambling Scholar, written in the early
1500s, considers the following carnival game. There are six dice. Each of the
dice has five blank sides. The sixth side has a number between 1 and 6—a
different number on each die. The six dice are rolled and the player wins a
prize depending on the total of the numbers which turn up.
(a) Find, as Cardano did, the expected total without finding its distribution.
(b) Large prizes were given for large totals with a modest fee to play the
game. Explain why this could be done.
17 Let X be the first time that a failure occurs in an infinite sequence of Bernoulli
trials with probability p for success. Let pk = P (X = k) for k = 1, 2, . . . .
Show that pk = pkв€’1 q where q = 1 в€’ p. Show that k pk = 1. Show that
E(X) = 1/q. What is the expected number of tosses of a coin required to
obtain the first tail?
18 Exactly one of six similar keys opens a certain door. If you try the keys, one
after another, what is the expected number of keys that you will have to try
before success?
19 A multiple choice exam is given. A problem has four possible answers, and
exactly one answer is correct. The student is allowed to choose a subset of
the four possible answers as his answer. If his chosen subset contains the
correct answer, the student receives three points, but he loses one point for
each wrong answer in his chosen subset. Show that if he just guesses a subset
uniformly and randomly his expected score is zero.
20 You are offered the following game to play: a fair coin is tossed until heads
turns up for the first time (see Example 6.3). If this occurs on the first toss
you receive 2 dollars, if it occurs on the second toss you receive 22 = 4 dollars
and, in general, if heads turns up for the first time on the nth toss you receive
2n dollars.
(a) Show that the expected value of your winnings does not exist (i.e., is
given by a divergent sum) for this game. Does this mean that this game
is favorable no matter how much you pay to play it?
(b) Assume that you only receive 210 dollars if any number greater than or
equal to ten tosses are required to obtain the first head. Show that your
expected value for this modified game is finite and find its value.
250
CHAPTER 6. EXPECTED VALUE AND VARIANCE
(c) Assume that you pay 10 dollars for each play of the original game. Write
a program to simulate 100 plays of the game and see how you do.
в€љ
(d) Now assume that the utility of n dollars is n. Write an expression for
the expected utility of the payment, and show that this expression has a
finite value. Estimate this value. Repeat this exercise for the case that
the utility function is log(n).
21 Let X be a random variable which is Poisson distributed with parameter О».
Show that E(X) = О». Hint: Recall that
ex = 1 + x +
x2
x3
+
+ В·В·В· .
2!
3!
22 Recall that in Exercise 1.1.14, we considered a town with two hospitals. In
the large hospital about 45 babies are born each day, and in the smaller
hospital about 15 babies are born each day. We were interested in guessing
which hospital would have on the average the largest number of days with
the property that more than 60 percent of the children born on that day are
boys. For each hospital find the expected number of days in a year that have
the property that more than 60 percent of the children born on that day were
boys.
23 An insurance company has 1,000 policies on men of age 50. The company
estimates that the probability that a man of age 50 dies within a year is .01.
Estimate the number of claims that the company can expect from beneficiaries
of these men within a year.
24 Using the life table for 1981 in Appendix C, write a program to compute the
expected lifetime for males and females of each possible age from 1 to 85.
Compare the results for males and females. Comment on whether life insurance should be priced differently for males and females.
*25 A deck of ESP cards consists of 20 cards each of two types: say ten stars,
ten circles (normally there are five types). The deck is shuffled and the cards
turned up one at a time. You, the alleged percipient, are to name the symbol
on each card before it is turned up.
Suppose that you are really just guessing at the cards. If you do not get to
see each card after you have made your guess, then it is easy to calculate the
expected number of correct guesses, namely ten.
If, on the other hand, you are guessing with information, that is, if you see
each card after your guess, then, of course, you might expect to get a higher
score. This is indeed the case, but calculating the correct expectation is no
longer easy.
But it is easy to do a computer simulation of this guessing with information,
so we can get a good idea of the expectation by simulation. (This is similar to
the way that skilled blackjack players make blackjack into a favorable game
by observing the cards that have already been played. See Exercise 29.)
6.1. EXPECTED VALUE
251
(a) First, do a simulation of guessing without information, repeating the
experiment at least 1000 times. Estimate the expected number of correct
answers and compare your result with the theoretical expectation.
(b) What is the best strategy for guessing with information?
(c) Do a simulation of guessing with information, using the strategy in (b).
Repeat the experiment at least 1000 times, and estimate the expectation
in this case.
(d) Let S be the number of stars and C the number of circles in the deck. Let
h(S, C) be the expected winnings using the optimal guessing strategy in
(b). Show that h(S, C) satisfies the recursion relation
h(S, C) =
C
max(S, C)
S
h(S в€’ 1, C) +
h(S, C в€’ 1) +
,
S+C
S+C
S+C
and h(0, 0) = h(в€’1, 0) = h(0, в€’1) = 0. Using this relation, write a
program to compute h(S, C) and find h(10, 10). Compare the computed
value of h(10, 10) with the result of your simulation in (c). For more
about this exercise and Exercise 26 see Diaconis and Graham.11
*26 Consider the ESP problem as described in Exercise 25. You are again guessing
with information, and you are using the optimal guessing strategy of guessing
star if the remaining deck has more stars, circle if more circles, and tossing a
coin if the number of stars and circles are equal. Assume that S ≥ C, where
S is the number of stars and C the number of circles.
We can plot the results of a typical game on a graph, where the horizontal axis
represents the number of steps and the vertical axis represents the difference
between the number of stars and the number of circles that have been turned
up. A typical game is shown in Figure 6.6. In this particular game, the order
in which the cards were turned up is (C, S, S, S, S, C, C, S, S, C). Thus, in this
particular game, there were six stars and four circles in the deck. This means,
in particular, that every game played with this deck would have a graph which
ends at the point (10, 2). We define the line L to be the horizontal line which
goes through the ending point on the graph (so its vertical coordinate is just
the difference between the number of stars and circles in the deck).
(a) Show that, when the random walk is below the line L, the player guesses
right when the graph goes up (star is turned up) and, when the walk is
above the line, the player guesses right when the walk goes down (circle
turned up). Show from this property that the subject is sure to have at
least S correct guesses.
(b) When the walk is at a point (x, x) on the line L the number of stars and
circles remaining is the same, and so the subject tosses a coin. Show that
11 P. Diaconis and R. Graham, “The Analysis of Sequential Experiments with Feedback to Subjects,” Annals of Statistics, vol. 9 (1981), pp. 3–23.
252
CHAPTER 6. EXPECTED VALUE AND VARIANCE
L
2
(10,2)
1
1
2
3
4
5
6
7
8
9
10
Figure 6.6: Random walk for ESP.
the probability that the walk reaches (x, x) is
S C
x x
S+C
2x
.
Hint: The outcomes of 2x cards is a hypergeometric distribution (see
Section 5.1).
(c) Using the results of (a) and (b) show that the expected number of correct
guesses under intelligent guessing is
C
S+
1
2
x=1
S C
x x
S+C
2x
.
27 It has been said12 that a Dr. B. Muriel Bristol declined a cup of tea stating
that she preferred a cup into which milk had been poured first. The famous
statistician R. A. Fisher carried out a test to see if she could tell whether milk
was put in before or after the tea. Assume that for the test Dr. Bristol was
given eight cups of tea—four in which the milk was put in before the tea and
four in which the milk was put in after the tea.
(a) What is the expected number of correct guesses the lady would make if
she had no information after each test and was just guessing?
(b) Using the result of Exercise 26 find the expected number of correct
guesses if she was told the result of each guess and used an optimal
guessing strategy.
28 In a popular computer game the computer picks an integer from 1 to n at
random. The player is given k chances to guess the number. After each guess
the computer responds “correct,” “too small,” or “too big.”
12 J.
F. Box, R. A. Fisher, The Life of a Scientist (New York: John Wiley and Sons, 1978).
6.1. EXPECTED VALUE
253
(a) Show that if n ≤ 2k − 1, then there is a strategy that guarantees you will
correctly guess the number in k tries.
(b) Show that if n ≥ 2k −1, there is a strategy that assures you of identifying
one of 2k в€’ 1 numbers and hence gives a probability of (2k в€’ 1)/n of
winning. Why is this an optimal strategy? Illustrate your result in
terms of the case n = 9 and k = 3.
29 In the casino game of blackjack the dealer is dealt two cards, one face up and
one face down, and each player is dealt two cards, both face down. If the
dealer is showing an ace the player can look at his down cards and then make
a bet called an insurance bet. (Expert players will recognize why it is called
insurance.) If you make this bet you will win the bet if the dealer’s second
card is a ten card : namely, a ten, jack, queen, or king. If you win, you are
paid twice your insurance bet; otherwise you lose this bet. Show that, if the
only cards you can see are the dealer’s ace and your two cards and if your
cards are not ten cards, then the insurance bet is an unfavorable bet. Show,
however, that if you are playing two hands simultaneously, and you have no
ten cards, then it is a favorable bet. (Thorp13 has shown that the game of
blackjack is favorable to the player if he or she can keep good enough track
of the cards that have been played.)
30 Assume that, every time you buy a box of Wheaties, you receive a picture of
one of the n players for the New York Yankees (see Exercise 3.2.34). Let Xk
be the number of additional boxes you have to buy, after you have obtained
k в€’ 1 different pictures, in order to obtain the next new picture. Thus X1 = 1,
X2 is the number of boxes bought after this to obtain a picture different from
the first pictured obtained, and so forth.
(a) Show that Xk has a geometric distribution with p = (n в€’ k + 1)/n.
(b) Simulate the experiment for a team with 26 players (25 would be more
accurate but we want an even number). Carry out a number of simulations and estimate the expected time required to get the first 13 players
and the expected time to get the second 13. How do these expectations
compare?
(c) Show that, if there are 2n players, the expected time to get the first half
of the players is
2n
1
1
1
+
+ В·В·В· +
2n 2n в€’ 1
n+1
and the expected time to get the second half is
2n
13 E.
1
1
+
+ В·В·В· + 1
n nв€’1
Thorp, Beat the Dealer (New York: Random House, 1962).
.
,
254
CHAPTER 6. EXPECTED VALUE AND VARIANCE
(d) In Example 6.11 we stated that
1+
1 1
1
1
+ + В· В· В· + в€ј log n + .5772 +
.
2 3
n
2n
Use this to estimate the expression in (c). Compare these estimates with
the exact values and also with your estimates obtained by simulation for
the case n = 26.
*31 (Feller14 ) A large number, N , of people are subjected to a blood test. This
can be administered in two ways: (1) Each person can be tested separately,
in this case N test are required, (2) the blood samples of k persons can be
pooled and analyzed together. If this test is negative, this one test suffices
for the k people. If the test is positive, each of the k persons must be tested
separately, and in all, k + 1 tests are required for the k people. Assume that
the probability p that a test is positive is the same for all people and that
these events are independent.
(a) Find the probability that the test for a pooled sample of k people will
be positive.
(b) What is the expected value of the number X of tests necessary under
plan (2)? (Assume that N is divisible by k.)
(c) For small p, show that the value of k which will minimize the expected
в€љ
number of tests under the second plan is approximately 1/ p.
32 Write a program to add random numbers chosen from [0, 1] until the first
time the sum is greater than one. Have your program repeat this experiment
a number of times to estimate the expected number of selections necessary
in order that the sum of the chosen numbers first exceeds 1. On the basis of
your experiments, what is your estimate for this number?
*33 The following related discrete problem also gives a good clue for the answer
to Exercise 32. Randomly select with replacement t1 , t2 , . . . , tr from the set
(1/n, 2/n, . . . , n/n). Let X be the smallest value of r satisfying
t1 + t2 + В· В· В· + tr > 1 .
Then E(X) = (1 + 1/n)n . To prove this, we can just as well choose t1 , t2 ,
. . . , tr randomly with replacement from the set (1, 2, . . . , n) and let X be the
smallest value of r for which
t1 + t 2 + В· В· В· + t r > n .
(a) Use Exercise 3.2.36 to show that
P (X ≥ j + 1) =
n
j
1
n
j
.
14 W. Feller, Introduction to Probability Theory and Its Applications, 3rd ed., vol. 1 (New York:
John Wiley and Sons, 1968), p. 240.
6.1. EXPECTED VALUE
255
(b) Show that
n
P (X ≥ j + 1) .
E(X) =
j=0
(c) From these two facts, find an expression for E(X). This proof is due to
Harris Schultz.15
*34 (Banach’s Matchbox16 ) A man carries in each of his two front pockets a box
of matches originally containing N matches. Whenever he needs a match,
he chooses a pocket at random and removes one from that box. One day he
reaches into a pocket and finds the box empty.
(a) Let pr denote the probability that the other pocket contains r matches.
Define a sequence of counter random variables as follows: Let Xi = 1 if
the ith draw is from the left pocket, and 0 if it is from the right pocket.
Interpret pr in terms of Sn = X1 + X2 + В· В· В· + Xn . Find a binomial
expression for pr .
(b) Write a computer program to compute the pr , as well as the probability
that the other pocket contains at least r matches, for N = 100 and r
from 0 to 50.
(c) Show that (N в€’ r)pr = (1/2)(2N + 1)pr+1 в€’ (1/2)(r + 1)pr+1 .
(d) Evaluate
r
pr .
(e) Use (c) and (d) to determine the expectation E of the distribution {pr }.
(f) Use Stirling’s formula to obtain an approximation for E. How many
matches must each box contain to ensure a value of about 13 for the
expectation E? (Take ПЂ = 22/7.)
35 A coin is tossed until the first time a head turns up. If this occurs on the nth
toss and n is odd you win 2n /n, but if n is even then you lose 2n /n. Then if
your expected winnings exist they are given by the convergent series
1в€’
1 1 1
+ в€’ + В·В·В·
2 3 4
called the alternating harmonic series. It is tempting to say that this should
be the expected value of the experiment. Show that if we were to do this, the
expected value of an experiment would depend upon the order in which the
outcomes are listed.
36 Suppose we have an urn containing c yellow balls and d green balls. We draw
k balls, without replacement, from the urn. Find the expected number of
yellow balls drawn. Hint: Write the number of yellow balls drawn as the sum
of c random variables.
15 H. Schultz, “An Expected Value Problem,” Two-Year Mathematics Journal, vol. 10, no. 4
(1979), pp. 277–78.
16 W. Feller, Introduction to Probability Theory, vol. 1, p. 166.
256
CHAPTER 6. EXPECTED VALUE AND VARIANCE
37 The reader is referred to Example 6.13 for an explanation of the various options available in Monte Carlo roulette.
(a) Compute the expected winnings of a 1 franc bet on red under option (a).
(b) Repeat part (a) for option (b).
(c) Compare the expected winnings for all three options.
*38 (from Pittel17 ) Telephone books, n in number, are kept in a stack. The
probability that the book numbered i (where 1 ≤ i ≤ n) is consulted for a
given phone call is pi > 0, where the pi ’s sum to 1. After a book is used,
it is placed at the top of the stack. Assume that the calls are independent
and evenly spaced, and that the system has been employed indefinitely far
into the past. Let di be the average depth of book i in the stack. Show that
di ≤ dj whenever pi ≥ pj . Thus, on the average, the more popular books
have a tendency to be closer to the top of the stack. Hint: Let pij denote the
probability that book i is above book j. Show that pij = pij (1 в€’ pj ) + pji pi .
*39 (from Propp18 ) In the previous problem, let P be the probability that at the
present time, each book is in its proper place, i.e., book i is ith from the top.
Find a formula for P in terms of the pi ’s. In addition, find the least upper
bound on P , if the pi ’s are allowed to vary. Hint: First find the probability
that book 1 is in the right place. Then find the probability that book 2 is in
the right place, given that book 1 is in the right place. Continue.
*40 (from H. Shultz and B. Leonard19 ) A sequence of random numbers in [0, 1)
is generated until the sequence is no longer monotone increasing. The numbers are chosen according to the uniform distribution. What is the expected
length of the sequence? (In calculating the length, the term that destroys
monotonicity is included.) Hint: Let a1 , a2 , . . . be the sequence and let X
denote the length of the sequence. Then
P (X > k) = P (a1 < a2 < В· В· В· < ak ) ,
and the probability on the right-hand side is easy to calculate. Furthermore,
one can show that
E(X) = 1 + P (X > 1) + P (X > 2) + В· В· В· .
41 Let T be the random variable that counts the number of 2-unshuffles performed on an n-card deck until all of the labels on the cards are distinct. This
random variable was discussed in Section 3.3. Using Equation 3.4 in that
section, together with the formula
в€ћ
E(T ) =
P (T > s)
s=0
17 B.
Pittel, Problem #1195, Mathematics Magazine, vol. 58, no. 3 (May 1985), pg. 183.
Propp, Problem #1159, Mathematics Magazine vol. 57, no. 1 (Feb. 1984), pg. 50.
19 H. Shultz and B. Leonard, “Unexpected Occurrences of the Number e,” Mathematics Magazine
vol. 62, no. 4 (October, 1989), pp. 269-271.
18 J.
6.2. VARIANCE OF DISCRETE RANDOM VARIABLES
257
that was proved in Exercise 33, show that
в€ћ
1в€’
E(T ) =
s=0
2s n!
n 2sn
.
Show that for n = 52, this expression is approximately equal to 11.7. (As was
stated in Chapter 3, this means that on the average, almost 12 riffle shuffles of
a 52-card deck are required in order for the process to be considered random.)
6.2
Variance of Discrete Random Variables
The usefulness of the expected value as a prediction for the outcome of an experiment is increased when the outcome is not likely to deviate too much from the
expected value. In this section we shall introduce a measure of this deviation, called
the variance.
Variance
Definition 6.3 Let X be a numerically valued random variable with expected value
Вµ = E(X). Then the variance of X, denoted by V (X), is
V (X) = E((X в€’ Вµ)2 ) .
вњ·
Note that, by Theorem 6.1, V (X) is given by
(x в€’ Вµ)2 m(x) ,
V (X) =
(6.1)
x
where m is the distribution function of X.
Standard Deviation
The standard deviation of X, denoted by D(X), is D(X) =
write Пѓ for D(X) and Пѓ 2 for V (X).
V (X). We often
Example 6.17 Consider one roll of a die. Let X be the number that turns up. To
find V (X), we must first find the expected value of X. This is
Вµ = E(X) = 1
=
1
1
1
1
1
1
+2
+3
+4
+5
+6
6
6
6
6
6
6
7
.
2
To find the variance of X, we form the new random variable (X в€’ Вµ)2 and
compute its expectation. We can easily do this using the following table.
258
CHAPTER 6. EXPECTED VALUE AND VARIANCE
x
1
2
3
4
5
6
m(x)
1/6
1/6
1/6
1/6
1/6
1/6
(x в€’ 7/2)2
25/4
9/4
1/4
1/4
9/4
25/4
Table 6.6: Variance calculation.
From this table we find E((X в€’ Вµ)2 ) is
V (X)
=
=
1 25 9 1 1 9 25
+ + + + +
6 4
4 4 4 4
4
35
,
12
and the standard deviation D(X) =
35/12 ≈ 1.707.
вњ·
Calculation of Variance
We next prove a theorem that gives us a useful alternative form for computing the
variance.
Theorem 6.6 If X is any random variable with E(X) = Вµ, then
V (X) = E(X 2 ) в€’ Вµ2 .
Proof. We have
= E((X в€’ Вµ)2 ) = E(X 2 в€’ 2ВµX + Вµ2 )
V (X)
= E(X 2 ) в€’ 2ВµE(X) + Вµ2 = E(X 2 ) в€’ Вµ2 .
вњ·
Using Theorem 6.6, we can compute the variance of the outcome of a roll of a
die by first computing
E(X 2 )
1
1
1
1
1
1
+4
+9
+ 16
+ 25
+ 36
6
6
6
6
6
6
=
1
=
91
,
6
and,
7 2
35
91
в€’
=
,
6
2
12
in agreement with the value obtained directly from the definition of V (X).
V (X) = E(X 2 ) в€’ Вµ2 =
6.2. VARIANCE OF DISCRETE RANDOM VARIABLES
259
Properties of Variance
The variance has properties very different from those of the expectation. If c is any
constant, E(cX) = cE(X) and E(X + c) = E(X) + c. These two statements imply
that the expectation is a linear function. However, the variance is not linear, as
seen in the next theorem.
Theorem 6.7 If X is any random variable and c is any constant, then
V (cX) = c2 V (X)
and
V (X + c) = V (X) .
Proof. Let Вµ = E(X). Then E(cX) = cВµ, and
V (cX)
= E((cX в€’ cВµ)2 ) = E(c2 (X в€’ Вµ)2 )
= c2 E((X в€’ Вµ)2 ) = c2 V (X) .
To prove the second assertion, we note that, to compute V (X + c), we would
replace x by x+c and µ by µ+c in Equation 6.1. Then the c’s would cancel, leaving
V (X).
вњ·
We turn now to some general properties of the variance. Recall that if X and Y
are any two random variables, E(X +Y ) = E(X)+E(Y ). This is not always true for
the case of the variance. For example, let X be a random variable with V (X) = 0,
and define Y = в€’X. Then V (X) = V (Y ), so that V (X) + V (Y ) = 2V (X). But
X + Y is always 0 and hence has variance 0. Thus V (X + Y ) = V (X) + V (Y ).
In the important case of mutually independent random variables, however, the
variance of the sum is the sum of the variances.
Theorem 6.8 Let X and Y be two independent random variables. Then
V (X + Y ) = V (X) + V (Y ) .
Proof. Let E(X) = a and E(Y ) = b. Then
V (X + Y )
= E((X + Y )2 ) в€’ (a + b)2
= E(X 2 ) + 2E(XY ) + E(Y 2 ) в€’ a2 в€’ 2ab в€’ b2 .
Since X and Y are independent, E(XY ) = E(X)E(Y ) = ab. Thus,
V (X + Y ) = E(X 2 ) в€’ a2 + E(Y 2 ) в€’ b2 = V (X) + V (Y ) .
вњ·
260
CHAPTER 6. EXPECTED VALUE AND VARIANCE
It is easy to extend this proof, by mathematical induction, to show that the
variance of the sum of any number of mutually independent random variables is the
sum of the individual variances. Thus we have the following theorem.
Theorem 6.9 Let X1 , X2 , . . . , Xn be an independent trials process with E(Xj ) =
Вµ and V (Xj ) = Пѓ 2 . Let
Sn = X 1 + X 2 + В· В· В· + X n
be the sum, and
An =
Sn
n
be the average. Then
E(Sn )
= nВµ ,
V (Sn )
= nПѓ 2 ,
в€љ
= Пѓ n,
Пѓ(Sn )
E(An )
V (An )
Пѓ(An )
= Вµ,
Пѓ2
,
=
n
Пѓ
= в€љ .
n
Proof. Since all the random variables Xj have the same expected value, we have
E(Sn ) = E(X1 ) + В· В· В· + E(Xn ) = nВµ ,
V (Sn ) = V (X1 ) + В· В· В· + V (Xn ) = nПѓ 2 ,
and
в€љ
Пѓ(Sn ) = Пѓ n .
We have seen that, if we multiply a random variable X with mean Вµ and variance
Пѓ by a constant c, the new random variable has expected value cВµ and variance
c2 Пѓ 2 . Thus,
nВµ
Sn
=
=Вµ,
E(An ) = E
n
n
2
and
V (An ) = V
Sn
n
=
V (Sn )
nПѓ 2
Пѓ2
.
= 2 =
2
n
n
n
Finally, the standard deviation of An is given by
Пѓ
Пѓ(An ) = в€љ .
n
вњ·
6.2. VARIANCE OF DISCRETE RANDOM VARIABLES
0.6
261
2
n = 10
n = 100
0.5
1.5
0.4
0.3
1
0.2
0.5
0.1
0
1
2
4
3
5
6
0
2
2.5
3
3.5
4
4.5
5
Figure 6.7: Empirical distribution of An .
The last equation in the above theorem implies that in an independent trials
process, if the individual summands have finite variance, then the standard deviation of the average goes to 0 as n в†’ в€ћ. Since the standard deviation tells us
something about the spread of the distribution around the mean, we see that for
large values of n, the value of An is usually very close to the mean of An , which
equals Вµ, as shown above. This statement is made precise in Chapter 8, where it
is called the Law of Large Numbers. For example, let X represent the roll of a fair
die. In Figure 6.7, we show the distribution of a random variable An corresponding
to X, for n = 10 and n = 100.
Example 6.18 Consider n rolls of a die. We have seen that, if Xj is the outcome
if the jth roll, then E(Xj ) = 7/2 and V (Xj ) = 35/12. Thus, if Sn is the sum of the
outcomes, and An = Sn /n is the average of the outcomes, we have E(An ) = 7/2 and
V (An ) = (35/12)/n. Therefore, as n increases, the expected value of the average
remains constant, but the variance tends to 0. If the variance is a measure of the
expected deviation from the mean this would indicate that, for large n, we can
expect the average to be very near the expected value. This is in fact the case, and
we shall justify it in Chapter 8.
вњ·
Bernoulli Trials
Consider next the general Bernoulli trials process. As usual, we let Xj = 1 if the
jth outcome is a success and 0 if it is a failure. If p is the probability of a success,
and q = 1 в€’ p, then
E(Xj )
=
0q + 1p = p ,
E(Xj2 )
=
02 q + 12 p = p ,
and
V (Xj ) = E(Xj2 ) в€’ (E(Xj ))2 = p в€’ p2 = pq .
Thus, for Bernoulli trials, if Sn = X1 + X2 + В· В· В· + Xn is the number of successes,
в€љ
then E(Sn ) = np, V (Sn ) = npq, and D(Sn ) = npq. If An = Sn /n is the average
number of successes, then E(An ) = p, V (An ) = pq/n, and D(An ) = pq/n. We
see that the expected proportion of successes remains p and the variance tends to 0.
262
CHAPTER 6. EXPECTED VALUE AND VARIANCE
This suggests that the frequency interpretation of probability is a correct one. We
shall make this more precise in Chapter 8.
Example 6.19 Let T denote the number of trials until the first success in a
Bernoulli trials process. Then T is geometrically distributed. What is the variance of T ? In Example 4.15, we saw that
1
p
mT =
2
qp
В·В·В·
В·В·В·
3
q2 p
.
In Example 6.4, we showed that
E(T ) = 1/p .
Thus,
V (T ) = E(T 2 ) в€’ 1/p2 ,
so we need only find
E(T 2 )
=
1p + 4qp + 9q 2 p + В· В· В·
= p(1 + 4q + 9q 2 + В· В· В·) .
To evaluate this sum, we start again with
1 + x + x2 + В· В· В· =
1
.
1в€’x
Differentiating, we obtain
1 + 2x + 3x2 + В· В· В· =
1
.
(1 в€’ x)2
x + 2x2 + 3x3 + В· В· В· =
x
.
(1 в€’ x)2
Multiplying by x,
Differentiating again gives
1 + 4x + 9x2 + В· В· В· =
1+x
.
(1 в€’ x)3
Thus,
E(T 2 ) = p
1+q
1+q
=
(1 в€’ q)3
p2
and
V (T )
= E(T 2 ) в€’ (E(T ))2
1+q
1
q
=
в€’ 2 = 2 .
p2
p
p
For example, the variance for the number of tosses of a coin until the first
head turns up is (1/2)/(1/2)2 = 2. The variance for the number of rolls of a
die until the first six turns up is (5/6)/(1/6)2 = 30. Note that, as p decreases, the
variance increases rapidly. This corresponds to the increased spread of the geometric
distribution as p decreases (noted in Figure 5.1).
вњ·
6.2. VARIANCE OF DISCRETE RANDOM VARIABLES
263
Poisson Distribution
Just as in the case of expected values, it is easy to guess the variance of the Poisson
distribution with parameter О». We recall that the variance of a binomial distribution
with parameters n and p equals npq. We also recall that the Poisson distribution
could be obtained as a limit of binomial distributions, if n goes to в€ћ and p goes
to 0 in such a way that their product is kept fixed at the value О». In this case,
npq = О»q approaches О», since q goes to 1. So, given a Poisson distribution with
parameter О», we should guess that its variance is О». The reader is asked to show
this in Exercise 29.
Exercises
1 A number is chosen at random from the set S = {в€’1, 0, 1}. Let X be the
number chosen. Find the expected value, variance, and standard deviation of
X.
2 A random variable X has the distribution
pX =
0
1/3
1
1/3
2
1/6
4
1/6
.
Find the expected value, variance, and standard deviation of X.
3 You place a 1-dollar bet on the number 17 at Las Vegas, and your friend
places a 1-dollar bet on black (see Exercises 1.1.6 and 1.1.7). Let X be your
winnings and Y be her winnings. Compare E(X), E(Y ), and V (X), V (Y ).
What do these computations tell you about the nature of your winnings if
you and your friend make a sequence of bets, with you betting each time on
a number and your friend betting on a color?
4 X is a random variable with E(X) = 100 and V (X) = 15. Find
(a) E(X 2 ).
(b) E(3X + 10).
(c) E(в€’X).
(d) V (в€’X).
(e) D(в€’X).
5 In a certain manufacturing process, the (Fahrenheit) temperature never varies
by more than 2в—¦ from 62в—¦ . The temperature is, in fact, a random variable F
with distribution
PF =
60
1/10
61
2/10
62
4/10
63
2/10
64
1/10
.
(a) Find E(F ) and V (F ).
(b) Define T = F в€’ 62. Find E(T ) and V (T ), and compare these answers
with those in part (a).
264
CHAPTER 6. EXPECTED VALUE AND VARIANCE
(c) It is decided to report the temperature readings on a Celsius scale, that
is, C = (5/9)(F в€’ 32). What is the expected value and variance for the
readings now?
6 Write a computer program to calculate the mean and variance of a distribution
which you specify as data. Use the program to compare the variances for the
following densities, both having expected value 0:
pX =
в€’2
3/11
в€’1
2/11
0
1/11
1
2/11
2
3/11
;
pY =
в€’2
1/11
в€’1
2/11
0
5/11
1
2/11
2
1/11
.
7 A coin is tossed three times. Let X be the number of heads that turn up.
Find V (X) and D(X).
8 A random sample of 2400 people are asked if they favor a government proposal to develop new nuclear power plants. If 40 percent of the people in the
country are in favor of this proposal, find the expected value and the standard deviation for the number S2400 of people in the sample who favored the
proposal.
9 A die is loaded so that the probability of a face coming up is proportional to
the number on that face. The die is rolled with outcome X. Find V (X) and
D(X).
10 Prove the following facts about the standard deviation.
(a) D(X + c) = D(X).
(b) D(cX) = |c|D(X).
11 A number is chosen at random from the integers 1, 2, 3, . . . , n. Let X be the
number chosen. Show that E(X) = (n + 1)/2 and V (X) = (n в€’ 1)(n + 1)/12.
Hint: The following identity may be useful:
12 + 22 + В· В· В· + n2 =
(n)(n + 1)(2n + 1)
.
6
12 Let X be a random variable with Вµ = E(X) and Пѓ 2 = V (X). Define X в€— =
(X в€’Вµ)/Пѓ. The random variable X в€— is called the standardized random variable
associated with X. Show that this standardized random variable has expected
value 0 and variance 1.
13 Peter and Paul play Heads or Tails (see Example 1.4). Let Wn be Peter’s
winnings after n matches. Show that E(Wn ) = 0 and V (Wn ) = n.
14 Find the expected value and the variance for the number of boys and the
number of girls in a royal family that has children until there is a boy or until
there are three children, whichever comes first.
6.2. VARIANCE OF DISCRETE RANDOM VARIABLES
265
15 Suppose that n people have their hats returned at random. Let Xi = 1 if the
n
ith person gets his or her own hat back and 0 otherwise. Let Sn = i=1 Xi .
Then Sn is the total number of people who get their own hats back. Show
that
(a) E(Xi2 ) = 1/n.
(b) E(Xi В· Xj ) = 1/n(n в€’ 1) for i = j.
(c) E(Sn2 ) = 2 (using (a) and (b)).
(d) V (Sn ) = 1.
16 Let Sn be the number of successes in n independent trials. Use the program
BinomialProbabilities (Section 3.2) to compute, for given n, p, and j, the
probability
в€љ
в€љ
P (в€’j npq < Sn в€’ np < j npq) .
(a) Let p = .5, and compute this probability for j = 1, 2, 3 and n = 10, 30, 50.
Do the same for p = .2.
в€љ
(b) Show that the standardized random variable Snв€— = (Sn в€’ np)/ npq has
expected value 0 and variance 1. What do your results from (a) tell you
about this standardized quantity Snв€— ?
17 Let X be the outcome of a chance experiment with E(X) = Вµ and V (X) =
Пѓ 2 . When Вµ and Пѓ 2 are unknown, the statistician often estimates them by
repeating the experiment n times with outcomes x1 , x2 , . . . , xn , estimating
Вµ by the sample mean
n
1
x
ВЇ=
xi ,
n i=1
and Пѓ 2 by the sample variance
s2 =
1
n
n
(xi в€’ x
ВЇ)2 .
i=1
Then s is the sample standard deviation. These formulas should remind the
reader of the definitions of the theoretical mean and variance. (Many statisticians define the sample variance with the coefficient 1/n replaced by 1/(nв€’1).
If this alternative definition is used, the expected value of s2 is equal to Пѓ 2 .
See Exercise 18, part (d).)
Write a computer program that will roll a die n times and compute the sample
mean and sample variance. Repeat this experiment several times for n = 10
and n = 1000. How well do the sample mean and sample variance estimate
the true mean 7/2 and variance 35/12?
18 Show that, for the sample mean x
ВЇ and sample variance s2 as defined in Exercise 17,
(a) E(ВЇ
x) = Вµ.
266
CHAPTER 6. EXPECTED VALUE AND VARIANCE
(b) E (ВЇ
x в€’ Вµ)2 = Пѓ 2 /n.
(c) E(s2 ) =
nв€’1 2
n Пѓ .
Hint: For (c) write
n
n
(xi в€’ x
ВЇ)2
(xi в€’ Вµ) в€’ (ВЇ
x в€’ Вµ)
=
i=1
2
i=1
n
n
2
(xi в€’ Вµ) + n(ВЇ
x в€’ Вµ)2
(xi в€’ Вµ) в€’ 2(ВЇ
x в€’ Вµ)
=
i=1
n
i=1
(xi в€’ Вµ)2 в€’ n(ВЇ
x в€’ Вµ)2 ,
=
i=1
and take expectations of both sides, using part (b) when necessary.
(d) Show that if, in the definition of s2 in Exercise 17, we replace the coefficient 1/n by the coefficient 1/(n в€’ 1), then E(s2 ) = Пѓ 2 . (This shows why
many statisticians use the coefficient 1/(n в€’ 1). The number s2 is used
to estimate the unknown quantity Пѓ 2 . If an estimator has an average
value which equals the quantity being estimated, then the estimator is
said to be unbiased . Thus, the statement E(s2 ) = Пѓ 2 says that s2 is an
unbiased estimator of Пѓ 2 .)
19 Let X be a random variable taking on values a1 , a2 , . . . , ar with probabilities
p1 , p2 , . . . , pr and with E(X) = Вµ. Define the spread of X as follows:
r
|ai в€’ Вµ|pi .
Пѓ
ВЇ=
i=1
This, like the standard deviation, is a way to quantify the amount that a
random variable is spread out around its mean. Recall that the variance of a
sum of mutually independent random variables is the sum of the individual
variances. The square of the spread corresponds to the variance in a manner
similar to the correspondence between the spread and the standard deviation.
Show by an example that it is not necessarily true that the square of the
spread of the sum of two independent random variables is the sum of the
squares of the individual spreads.
20 We have two instruments that measure the distance between two points. The
measurements given by the two instruments are random variables X1 and
X2 that are independent with E(X1 ) = E(X2 ) = Вµ, where Вµ is the true
distance. From experience with these instruments, we know the values of the
variances Пѓ12 and Пѓ22 . These variances are not necessarily the same. From two
measurements, we estimate Вµ by the weighted average Вµ
ВЇ = wX1 + (1 в€’ w)X2 .
Here w is chosen in [0, 1] to minimize the variance of Вµ
ВЇ.
(a) What is E(ВЇ
Вµ)?
(b) How should w be chosen in [0, 1] to minimize the variance of Вµ
ВЇ?
6.2. VARIANCE OF DISCRETE RANDOM VARIABLES
267
21 Let X be a random variable with E(X) = Вµ and V (X) = Пѓ 2 . Show that the
function f (x) defined by
(X(П‰) в€’ x)2 p(П‰)
f (x) =
П‰
has its minimum value when x = Вµ.
22 Let X and Y be two random variables defined on the finite sample space Ω.
Assume that X, Y , X + Y , and X в€’ Y all have the same distribution. Prove
that P (X = Y = 0) = 1.
23 If X and Y are any two random variables, then the covariance of X and Y is
defined by Cov(X, Y ) = E((X в€’ E(X))(Y в€’ E(Y ))). Note that Cov(X, X) =
V (X). Show that, if X and Y are independent, then Cov(X, Y ) = 0; and
show, by an example, that we can have Cov(X, Y ) = 0 and X and Y not
independent.
*24 A professor wishes to make up a true-false exam with n questions. She assumes
that she can design the problems in such a way that a student will answer
the jth problem correctly with probability pj , and that the answers to the
various problems may be considered independent experiments. Let Sn be the
number of problems that a student will get correct. The professor wishes to
choose pj so that E(Sn ) = .7n and so that the variance of Sn is as large as
possible. Show that, to achieve this, she should choose pj = .7 for all j; that
is, she should make all the problems have the same difficulty.
25 (Lamperti20 ) An urn contains exactly 5000 balls, of which an unknown number
X are white and the rest red, where X is a random variable with a probability
distribution on the integers 0, 1, 2, . . . , 5000.
(a) Suppose we know that E(X) = Вµ. Show that this is enough to allow us
to calculate the probability that a ball drawn at random from the urn
will be white. What is this probability?
(b) We draw a ball from the urn, examine its color, replace it, and then
draw another. Under what conditions, if any, are the results of the two
drawings independent; that is, does
P (white, white) = P (white)2 ?
(c) Suppose the variance of X is Пѓ 2 . What is the probability of drawing two
white balls in part (b)?
26 For a sequence of Bernoulli trials, let X1 be the number of trials until the first
success. For j ≥ 2, let Xj be the number of trials after the (j − 1)st success
until the jth success. It can be shown that X1 , X2 , . . . is an independent trials
process.
20 Private
communication.
268
CHAPTER 6. EXPECTED VALUE AND VARIANCE
(a) What is the common distribution, expected value, and variance for Xj ?
(b) Let Tn = X1 + X2 + В· В· В· + Xn . Then Tn is the time until the nth success.
Find E(Tn ) and V (Tn ).
(c) Use the results of (b) to find the expected value and variance for the
number of tosses of a coin until the nth occurrence of a head.
27 Referring to Exercise 6.1.30, find the variance for the number of boxes of
Wheaties bought before getting half of the players’ pictures and the variance
for the number of additional boxes needed to get the second half of the players’
pictures.
28 In Example 5.3, assume that the book in question has 1000 pages. Let X be
the number of pages with no mistakes. Show that E(X) = 905 and V (X) =
86. Using these results, show that the probability is ≤ .05 that there will be
more than 924 pages without errors or fewer than 866 pages without errors.
29 Let X be Poisson distributed with parameter О». Show that V (X) = О».
6.3
Continuous Random Variables
In this section we consider the properties of the expected value and the variance
of a continuous random variable. These quantities are defined just as for discrete
random variables and share the same properties.
Expected Value
Definition 6.4 Let X be a real-valued random variable with density function f (x).
The expected value Вµ = E(X) is defined by
+в€ћ
Вµ = E(X) =
xf (x) dx ,
в€’в€ћ
provided the integral
+в€ћ
|x|f (x) dx
в€’в€ћ
is finite.
вњ·
The reader should compare this definition with the corresponding one for discrete
random variables in Section 6.1. Intuitively, we can interpret E(X), as we did in
the previous sections, as the value that we should expect to obtain if we perform a
large number of independent experiments and average the resulting values of X.
We can summarize the properties of E(X) as follows (cf. Theorem 6.2).
6.3. CONTINUOUS RANDOM VARIABLES
269
Theorem 6.10 If X and Y are real-valued random variables and c is any constant,
then
E(X + Y )
= E(X) + E(Y ) ,
E(cX)
= cE(X) .
The proof is very similar to the proof of Theorem 6.2, and we omit it.
вњ·
More generally, if X1 , X2 , . . . , Xn are n real-valued random variables, and c1 , c2 ,
. . . , cn are n constants, then
E(c1 X1 + c2 X2 + В· В· В· + cn Xn ) = c1 E(X1 ) + c2 E(X2 ) + В· В· В· + cn E(Xn ) .
Example 6.20 Let X be uniformly distributed on the interval [0, 1]. Then
1
E(X) =
x dx = 1/2 .
0
It follows that if we choose a large number N of random numbers from [0, 1] and take
the average, then we can expect that this average should be close to the expected
value of 1/2.
вњ·
Example 6.21 Let Z = (x, y) denote a point chosen uniformly and randomly from
the unit disk, as in the dart game in Example 2.8 and let X = (x2 + y 2 )1/2 be the
distance from Z to the center of the disk. The density function of X can easily be
shown to equal f (x) = 2x, so by the definition of expected value,
1
E(X)
=
xf (x) dx
0
1
=
x(2x) dx
0
=
2
.
3
вњ·
Example 6.22 In the example of the couple meeting at the Inn (Example 2.16),
each person arrives at a time which is uniformly distributed between 5:00 and 6:00
PM. The random variable Z under consideration is the length of time the first
person has to wait until the second one arrives. It was shown that
fZ (z) = 2(1 в€’ z) ,
for 0 ≤ z ≤ 1. Hence,
1
E(Z)
=
zfZ (z) dz
0
270
CHAPTER 6. EXPECTED VALUE AND VARIANCE
1
2z(1 в€’ z) dz
=
0
2
z2 в€’ z3
3
=
1
0
1
= .
3
вњ·
Expectation of a Function of a Random Variable
Suppose that X is a real-valued random variable and П†(x) is a continuous function
from R to R. The following theorem is the continuous analogue of Theorem 6.1.
Theorem 6.11 If X is a real-valued random variable and if П† : R в†’ R is a
continuous real-valued function with domain [a, b], then
+в€ћ
E(П†(X)) =
П†(x)fX (x) dx ,
в€’в€ћ
вњ·
provided the integral exists.
For a proof of this theorem, see Ross.21
Expectation of the Product of Two Random Variables
In general, it is not true that E(XY ) = E(X)E(Y ), since the integral of a product is
not the product of integrals. But if X and Y are independent, then the expectations
multiply.
Theorem 6.12 Let X and Y be independent real-valued continuous random variables with finite expected values. Then we have
E(XY ) = E(X)E(Y ) .
Proof. We will prove this only in the case that the ranges of X and Y are contained
in the intervals [a, b] and [c, d], respectively. Let the density functions of X and Y
be denoted by fX (x) and fY (y), respectively. Since X and Y are independent, the
joint density function of X and Y is the product of the individual density functions.
Hence
b
E(XY )
d
=
xyfX (x)fY (y) dy dx
a
c
b
=
d
xfX (x) dx
a
yfY (y) dy
c
= E(X)E(Y ) .
The proof in the general case involves using sequences of bounded random variables that approach X and Y , and is somewhat technical, so we will omit it.
вњ·
21 S.
Ross, A First Course in Probability, (New York: Macmillan, 1984), pgs. 241-245.
6.3. CONTINUOUS RANDOM VARIABLES
271
In the same way, one can show that if X1 , X2 , . . . , Xn are n mutually independent real-valued random variables, then
E(X1 X2 В· В· В· Xn ) = E(X1 ) E(X2 ) В· В· В· E(Xn ) .
Example 6.23 Let Z = (X, Y ) be a point chosen at random in the unit square.
Let A = X 2 and B = Y 2 . Then Theorem 4.3 implies that A and B are independent.
Using Theorem 6.11, the expectations of A and B are easy to calculate:
1
E(A) = E(B)
x2 dx
=
0
=
1
.
3
Using Theorem 6.12, the expectation of AB is just the product of E(A) and E(B),
or 1/9. The usefulness of this theorem is demonstrated by noting that it is quite a
bit more difficult to calculate E(AB) from the definition of expectation. One finds
that the density function of AB is
fAB (t) =
в€’ log(t)
в€љ
,
4 t
so
1
E(AB)
=
tfAB (t) dt
0
=
1
.
9
вњ·
Example 6.24 Again let Z = (X, Y ) be a point chosen at random in the unit
square, and let W = X + Y . Then Y and W are not independent, and we have
E(Y )
=
E(W )
=
E(Y W )
1
,
2
1,
= E(XY + Y 2 ) = E(X)E(Y ) +
1
7
=
= E(Y )E(W ) .
3
12
вњ·
We turn now to the variance.
Variance
Definition 6.5 Let X be a real-valued random variable with density function f (x).
The variance Пѓ 2 = V (X) is defined by
Пѓ 2 = V (X) = E((X в€’ Вµ)2 ) .
вњ·
272
CHAPTER 6. EXPECTED VALUE AND VARIANCE
The next result follows easily from Theorem 6.1. There is another way to calculate
the variance of a continuous random variable, which is usually slightly easier. It is
given in Theorem 6.15.
Theorem 6.13 If X is a real-valued random variable with E(X) = Вµ, then
в€ћ
(x в€’ Вµ)2 f (x) dx .
Пѓ2 =
в€’в€ћ
вњ·
The properties listed in the next three theorems are all proved in exactly the
same way that the corresponding theorems for discrete random variables were
proved in Section 6.2.
Theorem 6.14 If X is a real-valued random variable defined on Ω and c is any
constant, then (cf. Theorem 6.7)
V (cX)
V (X + c)
= c2 V (X) ,
= V (X) .
вњ·
Theorem 6.15 If X is a real-valued random variable with E(X) = Вµ, then (cf.
Theorem 6.6)
V (X) = E(X 2 ) в€’ Вµ2 .
вњ·
Theorem 6.16 If X and Y are independent real-valued random variables on Ω,
then (cf. Theorem 6.8)
V (X + Y ) = V (X) + V (Y ) .
вњ·
Example 6.25 (continuation of Example 6.20) If X is uniformly distributed on
[0, 1], then, using Theorem 6.15, we have
1
xв€’
V (X) =
0
1
2
2
dx =
1
.
12
вњ·
6.3. CONTINUOUS RANDOM VARIABLES
273
Example 6.26 Let X be an exponentially distributed random variable with parameter О». Then the density function of X is
fX (x) = О»eв€’О»x .
From the definition of expectation and integration by parts, we have
в€ћ
E(X)
=
xfX (x) dx
0
в€ћ
xeв€’О»x dx
= О»
0
в€ћ
= в€’xeв€’О»x
в€ћ
eв€’О»x dx
+
0
0
eв€’О»x
0+
в€’О»
=
в€ћ
=
0
1
.
О»
Similarly, using Theorems 6.11 and 6.15, we have
в€ћ
V (X)
1
О»2
0
в€ћ
1
= О»
x2 eв€’О»x dx в€’ 2
О»
0
=
x2 fX (x) dx в€’
в€ћ
= в€’x2 eв€’О»x
в€ћ
xeв€’О»x dx в€’
+2
0
0
в€ћ
= в€’x2 eв€’О»x
в€’
0
в€ћ
2xeв€’О»x
О»
в€’
0
1
О»2
2 в€’О»x
e
О»2
в€ћ
в€’
0
In this case, both E(X) and V (X) are finite if О» > 0.
1
2
1
1
= 2в€’ 2 = 2 .
О»2
О»
О»
О»
вњ·
Example 6.27 Let Z be a standard normal random variable with density function
2
1
fZ (x) = в€љ eв€’x /2 .
2ПЂ
Since this density function is symmetric with respect to the y-axis, then it is easy
to show that
в€ћ
xfZ (x) dx
в€’в€ћ
has value 0. The reader should recall however, that the expectation is defined to be
the above integral only if the integral
в€ћ
|x|fZ (x) dx
в€’в€ћ
is finite. This integral equals
в€ћ
2
xfZ (x) dx ,
0
274
CHAPTER 6. EXPECTED VALUE AND VARIANCE
which one can easily show is finite. Thus, the expected value of Z is 0.
To calculate the variance of Z, we begin by applying Theorem 6.15:
+в€ћ
x2 fZ (x) dx в€’ Вµ2 .
V (Z) =
в€’в€ћ
If we write x2 as x В· x, and integrate by parts, we obtain
2
1
в€љ (в€’xeв€’x /2 )
2ПЂ
+в€ћ
1
+в€љ
2ПЂ
в€’в€ћ
+в€ћ
2
eв€’x
/2
dx .
в€’в€ћ
2
The first summand above can be shown to equal 0, since as x в†’ В±в€ћ, eв€’x /2 gets
small more quickly than x gets large. The second summand is just the standard
normal density integrated over its domain, so the value of this summand is 1.
Therefore, the variance of the standard normal density equals 1.
Now let X be a (not necessarily standard) normal random variable with parameters Вµ and Пѓ. Then the density function of X is
fX (x) = в€љ
2
2
1
eв€’(xв€’Вµ) /2Пѓ .
2ПЂПѓ
We can write X = ПѓZ + Вµ, where Z is a standard normal random variable. Since
E(Z) = 0 and V (Z) = 1 by the calculation above, Theorems 6.10 and 6.14 imply
that
E(X)
= E(ПѓZ + Вµ) = Вµ ,
V (X)
= V (ПѓZ + Вµ) = Пѓ 2 .
вњ·
Example 6.28 Let X be a continuous random variable with the Cauchy density
function
1
a
.
fX (x) =
2
ПЂ a + x2
Then the expectation of X does not exist, because the integral
a
ПЂ
+в€ћ
в€’в€ћ
|x| dx
a2 + x2
diverges. Thus the variance of X also fails to exist. Densities whose variance is not
defined, like the Cauchy density, behave quite differently in a number of important
respects from those whose variance is finite. We shall see one instance of this
difference in Section 8.2.
вњ·
Independent Trials
6.3. CONTINUOUS RANDOM VARIABLES
275
Corollary 6.1 If X1 , X2 , . . . , Xn is an independent trials process of real-valued
random variables, with E(Xi ) = Вµ and V (Xi ) = Пѓ 2 , and if
Sn
An
= X1 + X2 + В· В· В· + Xn ,
Sn
=
,
n
then
E(Sn )
= nВµ ,
E(An )
= Вµ,
= nПѓ 2 ,
Пѓ2
.
V (An ) =
n
V (Sn )
It follows that if we set
Sn в€’ nВµ
,
Snв€— = в€љ
nПѓ 2
then
E(Snв€— )
=
0,
(Snв€— )
=
1.
V
We say that Snв€— is a standardized version of Sn (see Exercise 12 in Section 6.2). вњ·
Queues
Example 6.29 Let us consider again the queueing problem, that is, the problem of
the customers waiting in a queue for service (see Example 5.7). We suppose again
that customers join the queue in such a way that the time between arrivals is an
exponentially distributed random variable X with density function
fX (t) = О»eв€’О»t .
Then the expected value of the time between arrivals is simply 1/О» (see Example 6.26), as was stated in Example 5.7. The reciprocal О» of this expected value
is often referred to as the arrival rate. The service time of an individual who is
first in line is defined to be the amount of time that the person stays at the head
of the line before leaving. We suppose that the customers are served in such a way
that the service time is another exponentially distributed random variable Y with
density function
fX (t) = Вµeв€’Вµt .
Then the expected value of the service time is
в€ћ
E(X) =
tfX (t) dt =
0
1
.
Вµ
The reciprocal Вµ if this expected value is often referred to as the service rate.
276
CHAPTER 6. EXPECTED VALUE AND VARIANCE
We expect on grounds of our everyday experience with queues that if the service
rate is greater than the arrival rate, then the average queue size will tend to stabilize,
but if the service rate is less than the arrival rate, then the queue will tend to increase
in length without limit (see Figure 5.7). The simulations in Example 5.7 tend to
bear out our everyday experience. We can make this conclusion more precise if we
introduce the traffic intensity as the product
ПЃ = (arrival rate)(average service time) =
О»
1/Вµ
=
.
Вµ
1/О»
The traffic intensity is also the ratio of the average service time to the average
time between arrivals. If the traffic intensity is less than 1 the queue will perform
reasonably, but if it is greater than 1 the queue will grow indefinitely large. In the
critical case of ПЃ = 1, it can be shown that the queue will become large but there
will always be times at which the queue is empty.22
In the case that the traffic intensity is less than 1 we can consider the length of
the queue as a random variable Z whose expected value is finite,
E(Z) = N .
The time spent in the queue by a single customer can be considered as a random
variable W whose expected value is finite,
E(W ) = T .
Then we can argue that, when a customer joins the queue, he expects to find N
people ahead of him, and when he leaves the queue, he expects to find О»T people
behind him. Since, in equilibrium, these should be the same, we would expect to
find that
N = О»T .
This last relationship is called Little’s law for queues.23 We will not prove it here.
A proof may be found in Ross.24 Note that in this case we are counting the waiting
time of all customers, even those that do not have to wait at all. In our simulation
in Section 4.2, we did not consider these customers.
If we knew the expected queue length then we could use Little’s law to obtain
the expected waiting time, since
N
.
T =
О»
The queue length is a random variable with a discrete distribution. We can estimate
this distribution by simulation, keeping track of the queue lengths at the times at
which a customer arrives. We show the result of this simulation (using the program
Queue) in Figure 6.8.
22 L.
Kleinrock, Queueing Systems, vol. 2 (New York: John Wiley and Sons, 1975).
p. 17.
24 S. M. Ross, Applied Probability Models with Optimization Applications, (San Francisco:
Holden-Day, 1970)
23 ibid.,
6.3. CONTINUOUS RANDOM VARIABLES
277
0.08
0.06
0.04
0.02
0
0
10
20
30
40
50
Figure 6.8: Distribution of queue lengths.
We note that the distribution appears to be a geometric distribution. In the
study of queueing theory it is shown that the distribution for the queue length in
equilibrium is indeed a geometric distribution with
sj = (1 в€’ ПЃ)ПЃj
for j = 0, 1, 2, . . . ,
if ПЃ < 1. The expected value of a random variable with this distribution is
N=
ПЃ
(1 в€’ ПЃ)
(see Example 6.4). Thus by Little’s result the expected waiting time is
T =
1
ПЃ
=
,
О»(1 в€’ ПЃ)
Вµв€’О»
where Вµ is the service rate, О» the arrival rate, and ПЃ the traffic intensity.
In our simulation, the arrival rate is 1 and the service rate is 1.1. Thus, the
traffic intensity is 1/1.1 = 10/11, the expected queue size is
10/11
= 10 ,
(1 в€’ 10/11)
and the expected waiting time is
1
= 10 .
1.1 в€’ 1
In our simulation the average queue size was 8.19 and the average waiting time was
7.37. In Figure 6.9, we show the histogram for the waiting times. This histogram
suggests that the density for the waiting times is exponential with parameter Вµ в€’ О»,
and this is the case.
вњ·
278
CHAPTER 6. EXPECTED VALUE AND VARIANCE
0.08
0.06
0.04
0.02
0
0
10
20
30
40
50
Figure 6.9: Distribution of queue waiting times.
Exercises
1 Let X be a random variable with range [в€’1, 1] and let fX (x) be the density
function of X. Find Вµ(X) and Пѓ 2 (X) if, for |x| < 1,
(a) fX (x) = 1/2.
(b) fX (x) = |x|.
(c) fX (x) = 1 в€’ |x|.
(d) fX (x) = (3/2)x2 .
2 Let X be a random variable with range [в€’1, 1] and fX its density function.
Find Вµ(X) and Пѓ 2 (X) if, for |x| > 1, fX (x) = 0, and for |x| < 1,
(a) fX (x) = (3/4)(1 в€’ x2 ).
(b) fX (x) = (ПЂ/4) cos(ПЂx/2).
(c) fX (x) = (x + 1)/2.
(d) fX (x) = (3/8)(x + 1)2 .
3 The lifetime, measure in hours, of the ACME super light bulb is a random
variable T with density function fT (t) = О»2 teв€’О»t , where О» = .05. What is the
expected lifetime of this light bulb? What is its variance?
4 Let X be a random variable with range [в€’1, 1] and density function fX (x) =
ax + b if |x| < 1.
(a) Show that if
+1
в€’1
fX (x) dx = 1, then b = 1/2.
(b) Show that if fX (x) ≥ 0, then −1/2 ≤ a ≤ 1/2.
(c) Show that µ = (2/3)a, and hence that −1/3 ≤ µ ≤ 1/3.
6.3. CONTINUOUS RANDOM VARIABLES
279
(d) Show that Пѓ 2 (X) = (2/3)b в€’ (4/9)a2 = 1/3 в€’ (4/9)a2 .
5 Let X be a random variable with range [в€’1, 1] and density function fX (x) =
ax2 + bx + c if |x| < 1 and 0 otherwise.
(a) Show that 2a/3 + 2c = 1 (see Exercise 4).
(b) Show that 2b/3 = Вµ(X).
(c) Show that 2a/5 + 2c/3 = Пѓ 2 (X).
(d) Find a, b, and c if Вµ(X) = 0, Пѓ 2 (X) = 1/15, and sketch the graph of fX .
(e) Find a, b, and c if Вµ(X) = 0, Пѓ 2 (X) = 1/2, and sketch the graph of fX .
6 Let T be a random variable with range [0, в€ћ] and fT its density function.
Find Вµ(T ) and Пѓ 2 (T ) if, for t < 0, fT (t) = 0, and for t > 0,
(a) fT (t) = 3eв€’3t .
(b) fT (t) = 9teв€’3t .
(c) fT (t) = 3/(1 + t)4 .
7 Let X be a random variable with density function fX . Show, using elementary
calculus, that the function
П†(a) = E((X в€’ a)2 )
takes its minimum value when a = Вµ(X), and in that case П†(a) = Пѓ 2 (X).
8 Let X be a random variable with mean Вµ and variance Пѓ 2 . Let Y = aX 2 +
bX + c. Find the expected value of Y .
9 Let X, Y , and Z be independent random variables, each with mean Вµ and
variance Пѓ 2 .
(a) Find the expected value and variance of S = X + Y + Z.
(b) Find the expected value and variance of A = (1/3)(X + Y + Z).
(c) Find the expected value of S 2 and A2 .
10 Let X and Y be independent random variables with uniform density functions
on [0, 1]. Find
(a) E(|X в€’ Y |).
(b) E(max(X, Y )).
(c) E(min(X, Y )).
(d) E(X 2 + Y 2 ).
(e) E((X + Y )2 ).
280
CHAPTER 6. EXPECTED VALUE AND VARIANCE
11 The Pilsdorff Beer Company runs a fleet of trucks along the 100 mile road
from Hangtown to Dry Gulch. The trucks are old, and are apt to break
down at any point along the road with equal probability. Where should the
company locate a garage so as to minimize the expected distance from a
typical breakdown to the garage? In other words, if X is a random variable
giving the location of the breakdown, measured, say, from Hangtown, and b
gives the location of the garage, what choice of b minimizes E(|X в€’ b|)? Now
suppose X is not distributed uniformly over [0, 100], but instead has density
function fX (x) = 2x/10,000. Then what choice of b minimizes E(|X в€’ b|)?
12 Find E(X Y ), where X and Y are independent random variables which are
uniform on [0, 1]. Then verify your answer by simulation.
13 Let X be a random variable that takes on nonnegative values and has distribution function F (x). Show that
в€ћ
(1 в€’ F (x)) dx .
E(X) =
0
Hint: Integrate by parts.
Illustrate this result by calculating E(X) by this method if X has an exponential distribution F (x) = 1 − e−λx for x ≥ 0, and F (x) = 0 otherwise.
14 Let X be a continuous random variable with density function fX (x). Show
that if
+в€ћ
x2 fX (x) dx < в€ћ ,
в€’в€ћ
then
+в€ћ
|x|fX (x) dx < в€ћ .
в€’в€ћ
Hint: Except on the interval [в€’1, 1], the first integrand is greater than the
second integrand.
15 Let X be a random variable distributed uniformly over [0, 20]. Define a new
random variable Y by Y = X (the greatest integer in X). Find the expected
value of Y . Do the same for Z = X + .5 . Compute E |X в€’ Y | and
E |X в€’ Z| . (Note that Y is the value of X rounded off to the nearest
smallest integer, while Z is the value of X rounded off to the nearest integer.
Which method of rounding off is better? Why?)
16 Assume that the lifetime of a diesel engine part is a random variable X with
density fX . When the part wears out, it is replaced by another with the same
density. Let N (t) be the number of parts that are used in time t. We want
to study the random variable N (t)/t. Since parts are replaced on the average
every E(X) time units, we expect about t/E(X) parts to be used in time t.
That is, we expect that
lim E
t→∞
N (t)
1
=
.
t
E(X)
6.3. CONTINUOUS RANDOM VARIABLES
281
This result is correct but quite difficult to prove. Write a program that will
allow you to specify the density fX , and the time t, and simulate this experiment to find N (t)/t. Have your program repeat the experiment 500 times and
plot a bar graph for the random outcomes of N (t)/t. From this data, estimate
E(N (t)/t) and compare this with 1/E(X). In particular, do this for t = 100
with the following two densities:
(a) fX = eв€’t .
(b) fX = teв€’t .
17 Let X and Y be random variables. The covariance Cov(X, Y) is defined by
(see Exercise 6.2.23)
cov(X, Y) = E((X в€’ Вµ(X))(Y в€’ Вµ(Y))) .
(a) Show that cov(X, Y) = E(XY) в€’ E(X)E(Y).
(b) Using (a), show that cov(X, Y ) = 0, if X and Y are independent. (Caution: the converse is not always true.)
(c) Show that V (X + Y ) = V (X) + V (Y ) + 2cov(X, Y ).
18 Let X and Y be random variables with positive variance. The correlation of
X and Y is defined as
ПЃ(X, Y ) =
cov(X, Y )
V (X)V (Y )
.
(a) Using Exercise 17(c), show that
0≤V
X
Y
+
Пѓ(X) Пѓ(Y )
= 2(1 + ПЃ(X, Y )) .
Y
X
в€’
Пѓ(X) Пѓ(Y )
= 2(1 в€’ ПЃ(X, Y )) .
(b) Now show that
0≤V
(c) Using (a) and (b), show that
−1 ≤ ρ(X, Y ) ≤ 1 .
19 Let X and Y be independent random variables with uniform densities in [0, 1].
Let Z = X + Y and W = X в€’ Y . Find
(a) ПЃ(X, Y ) (see Exercise 18).
(b) ПЃ(X, Z).
(c) ПЃ(Y, W ).
(d) ПЃ(Z, W ).
282
CHAPTER 6. EXPECTED VALUE AND VARIANCE
*20 When studying certain physiological data, such as heights of fathers and sons,
it is often natural to assume that these data (e.g., the heights of the fathers
and the heights of the sons) are described by random variables with normal
densities. These random variables, however, are not independent but rather
are correlated. For example, a two-dimensional standard normal density for
correlated random variables has the form
2
2
2
1
В· eв€’(x в€’2ПЃxy+y )/2(1в€’ПЃ ) .
fX,Y (x, y) =
2ПЂ 1 в€’ ПЃ2
(a) Show that X and Y each have standard normal densities.
(b) Show that the correlation of X and Y (see Exercise 18) is ПЃ.
*21 For correlated random variables X and Y it is natural to ask for the expected
value for X given Y . For example, Galton calculated the expected value of
the height of a son given the height of the father. He used this to show
that tall men can be expected to have sons who are less tall on the average.
Similarly, students who do very well on one exam can be expected to do less
well on the next exam, and so forth. This is called regression on the mean.
To define this conditional expected value, we first define a conditional density
of X given Y = y by
fX,Y (x, y)
,
fX|Y (x|y) =
fY (y)
where fX,Y (x, y) is the joint density of X and Y , and fY is the density for Y .
Then the conditional expected value of X given Y is
b
E(X|Y = y) =
xfX|Y (x|y) dx .
a
For the normal density in Exercise 20, show that the conditional density of
fX|Y (x|y) is normal with mean ПЃy and variance 1 в€’ ПЃ2 . From this we see that
if X and Y are positively correlated (0 < ПЃ < 1), and if y > E(Y ), then the
expected value for X given Y = y will be less than y (i.e., we have regression
on the mean).
22 A point Y is chosen at random from [0, 1]. A second point X is then chosen
from the interval [0, Y ]. Find the density for X. Hint: Calculate fX|Y as in
Exercise 21 and then use
1
fX (x) =
fX|Y (x|y)fY (y) dy .
x
Can you also derive your result geometrically?
*23 Let X and V be two standard normal random variables. Let ПЃ be a real
number between -1 and 1.
(a) Let Y = ПЃX + 1 в€’ ПЃ2 V . Show that E(Y ) = 0 and V ar(Y ) = 1. We
shall see later (see Example 7.5 and Example 10.17), that the sum of two
independent normal random variables is again normal. Thus, assuming
this fact, we have shown that Y is standard normal.
6.3. CONTINUOUS RANDOM VARIABLES
283
(b) Using Exercises 17 and 18, show that the correlation of X and Y is ПЃ.
(c) In Exercise 20, the joint density function fX,Y (x, y) for the random variable (X, Y ) is given. Now suppose that we want to know the set of
points (x, y) in the xy-plane such that fX,Y (x, y) = C for some constant
C. This set of points is called a set of constant density. Roughly speaking, a set of constant density is a set of points where the outcomes (X, Y )
are equally likely to fall. Show that for a given C, the set of points of
constant density is a curve whose equation is
x2 в€’ 2ПЃxy + y 2 = D ,
where D is a constant which depends upon C. (This curve is an ellipse.)
(d) One can plot the ellipse in part (c) by using the parametric equations
x =
y
=
r cos Оё
2(1 в€’ ПЃ)
r cos Оё
2(1 в€’ ПЃ)
+
в€’
r sin Оё
2(1 + ПЃ)
r sin Оё
2(1 + ПЃ)
,
.
Write a program to plot 1000 pairs (X, Y ) for ПЃ = в€’1/2, 0, 1/2. For each
plot, have your program plot the above parametric curves for r = 1, 2, 3.
*24 Following Galton, let us assume that the fathers and sons have heights that
are dependent normal random variables. Assume that the average height is
68 inches, standard deviation is 2.7 inches, and the correlation coefficient is .5
(see Exercises 20 and 21). That is, assume that the heights of the fathers
and sons have the form 2.7X + 68 and 2.7Y + 68, respectively, where X
and Y are correlated standardized normal random variables, with correlation
coefficient .5.
(a) What is the expected height for the son of a father whose height is
72 inches?
(b) Plot a scatter diagram of the heights of 1000 father and son pairs. Hint:
You can choose standardized pairs as in Exercise 23 and then plot (2.7X+
68, 2.7Y + 68).
*25 When we have pairs of data (xi , yi ) that are outcomes of the pairs of dependent
random variables X, Y we can estimate the coorelation coefficient ПЃ by
rВЇ =
в€’x
ВЇ)(yi в€’ yВЇ)
,
(n в€’ 1)sX sY
i (xi
where x
ВЇ and yВЇ are the sample means for X and Y , respectively, and sX and sY
are the sample standard deviations for X and Y (see Exercise 6.2.17). Write
a program to compute the sample means, variances, and correlation for such
dependent data. Use your program to compute these quantities for Galton’s
data on heights of parents and children given in Appendix B.
284
CHAPTER 6. EXPECTED VALUE AND VARIANCE
Plot the equal density ellipses as defined in Exercise 23 for r = 4, 6, and 8, and
on the same graph print the values that appear in the table at the appropriate
points. For example, print 12 at the point (70.5, 68.2), indicating that there
were 12 cases where the parent’s height was 70.5 and the child’s was 68.12.
See if Galton’s data is consistent with the equal density ellipses.
26 (from Hamming25 ) Suppose you are standing on the bank of a straight river.
(a) Choose, at random, a direction which will keep you on dry land, and
walk 1 km in that direction. Let P denote your position. What is the
expected distance from P to the river?
(b) Now suppose you proceed as in part (a), but when you get to P , you pick
a random direction (from among all directions) and walk 1 km. What
is the probability that you will reach the river before the second walk is
completed?
27 (from Hamming26 ) A game is played as follows: A random number X is chosen
uniformly from [0, 1]. Then a sequence Y1 , Y2 , . . . of random numbers is chosen
independently and uniformly from [0, 1]. The game ends the first time that
Yi > X. You are then paid (i в€’ 1) dollars. What is a fair entrance fee for
this game?
28 A long needle of length L much bigger than 1 is dropped on a grid with
horizontal and vertical lines one unit apart. Show that the average number a
of lines crossed is approximately
a=
4L
.
ПЂ
25 R. W. Hamming, The Art of Probability for Scientists and Engineers (Redwood City:
Addison-Wesley, 1991), p. 192.
26 ibid., pg. 205.
Index
π, estimation of, 43–46
n!, 80
absorbing Markov chain, 416
absorbing state, 416
AbsorbingChain (program), 421
absorption probabilities, 420
Ace, Mr., 241
Ali, 178
alleles, 348
AllPermutations (program), 84
ANDERSON, C. L., 157
annuity, 246
life, 247
terminal, 247
arc sine laws, 493
area, estimation of, 42
Areabargraph (program), 46
asymptotically equal, 81
Baba, 178
babies, 14, 250
Banach’s Matchbox, 255
BAR-HILLEL, M., 176
BARNES, B., 175
BARNHART, R., 11
BAYER, D., 120
Bayes (program), 147
Bayes probability, 136
Bayes’ formula, 146
BAYES, T., 149
beard, 153
bell-shaped, 47
Benford distribution, 195
BENKOSKI, S., 40
Bernoulli trials process, 96
BERNOULLI, D., 227
BERNOULLI, J., 113, 149, 310–312
Bertrand’s paradox, 47–50
BERTRAND, J., 49, 181
BertrandsParadox (program), 49
beta density, 168
Вґ I., 310, 377
BIENAYME,
BIGGS, N. L., 85
binary expansion, 69
binomial coefficient, 93
binomial distribution, 99, 184
approximating a, 329
Binomial Theorem, 103
BinomialPlot (program), 99
BinomialProbabilities (program), 98
Birthday (program), 78
birthday problem, 77
blackjack, 247, 253
blood test, 254
Bose-Einstein statistics, 107
Box paradox, 181
BOX, G. E. P., 213
boxcars, 27
BRAMS, S., 179, 182
Branch (program), 381
branching process, 376
customer, 393
BranchingSimulation (program), 386
bridge, 181, 182, 199, 203, 287
BROWN, B. H., 38
BROWN, E., 425
Buffon’s needle, 44–46, 51–53
BUFFON, G. L., 9, 44, 50–51
BuffonsNeedle (program), 45
bus paradox, 164
calendar, 38
cancer, 147
503
504
canonical form of an absorbing
Markov chain, 416
car, 137
CARDANO, G., 30–31, 110, 249
cars on a highway, 66
CASANOVA, G., 11
Cauchy density, 218, 400
cells, 347
Central Limit Theorem, 325
for Bernoulli Trials, 330
for Binomial Distributions, 328
for continuous independent trials process, 357
for discrete independent random variables, 345
for discrete independent trials
process, 343
for Markov Chains, 464
proof of, 397
chain letter, 388
characteristic function, 397
Chebyshev Inequality, 305, 316
CHEBYSHEV, P. L., 313
chi-squared density, 216, 296
Chicago World’s Fair, 52
chord, random, 47, 54
chromosomes, 348
CHU, S.-C., 110
CHUNG, K. L., 153
Circle of Gold, 388
Clinton, Bill, 196
clover-leaf interchange, 39
CLTBernoulliGlobal, 332
CLTBernoulliLocal (program), 329
CLTBernoulliPlot (program), 327
CLTGeneral (program), 345
CLTIndTrialsLocal (program), 342
CLTIndTrialsPlot (program), 341
COATES, R. M., 305
CoinTosses (program), 3
Collins, People v., 153, 202
color-blindness, 424
conditional density, 162
conditional distribution, 134
conditional expectation, 239
INDEX
conditional probability, 133
CONDORCET, Le Marquis de, 12
confidence interval, 334, 360
conjunction fallacy, 38
continuum, 41
convolution, 286, 291
of binomial distributions, 289
of Cauchy densities, 294
of exponential densities, 292, 300
of geometric distributions, 289
of normal densities, 294
of standard normal densities, 299
of uniform densities, 292, 299
CONWAY, J., 432
CRAMER, G., 227
craps, 235, 240, 468
Craps (program), 235
CROSSEN, C., 161
CROWELL, R., 468
cumulative distribution function, 61
joint, 165
customer branching process, 393
cut, 120
Dartmouth, 27
darts, 56, 57, 59, 60, 64, 71, 163, 164
Darts (program), 58
DAVID, F. N., 86, 337, 489
DAVID, F. N., 32
Вґ E,
Вґ CHEVALIER, 4, 31, 37
de MER
de MOIVRE, A., 37, 88, 148, 336, 489
de MONTMORT, P. R., 85
degrees of freedom, 217
DeMere1 (program), 4
DeMere2 (program), 4
density function, 56, 59
beta, 168
Cauchy, 218, 400
chi-squared, 216, 296
conditional, 162
exponential, 53, 66, 163, 205
gamma, 207
joint, 165
log normal, 224
Maxwell, 215
INDEX
normal, 212
Rayleigh, 215, 295
t-, 360
uniform, 60, 205
derangement, 85
DIACONIS, P., 120, 251
Die (program), 225
DieTest (program), 297
distribution function, 1, 19
properties of, 22
Benford, 195
binomial, 99, 184
geometric, 184
hypergeometric, 193
joint, 142
marginal, 143
negative binomial, 186
Poisson, 187
uniform, 183
DNA, 348
DOEBLIN, W., 449
DOYLE, P. G., 87, 452, 470
Drunkard’s Walk example, 416, 419–421,
423, 427, 443
Dry Gulch, 280
505
Eulerian number, 127
event, 18
events
attraction of, 160
independent, 139, 164
repulsion of, 160
existence of God, 245
expected value, 226, 268
exponential density, 53, 66, 163, 205
extinction, problem of, 378
factorial, 80
fair game, 241
FALK, R., 161, 176
fall, 131
fallacy, 38
FELLER, W., 11, 106, 107, 191, 201,
218, 254, 344
FERMAT, P., 4, 32–35, 112–113, 156
Fermi-Dirac statistics, 107
figurate numbers, 108
financial records
suspicious, 196
finite additivity property, 23
FINN, J., 178
First Fundamental Mystery of ProbabilEDWARDS, A. W. F., 108
ity, 232
Egypt, 30
first maximum of a random walk, 496
Ehrenfest model, 410, 433, 441, 460, 461 first return to the origin, 473
EHRENFEST, P., 410
Fisher’s Exact Test, 193
EHRENFEST, T, 410
FISHER, R. A., 252
EhrenfestUrn (program), 462
fixed column vector, 435
EISENBERG, B., 160
fixed points, 82
elevator, 89, 116
fixed row vector, 435
Emile’s restaurant, 75
FixedPoints (program), 82
ENGLE, A., 445
FixedVector (program), 437
envelopes, 179, 180
flying bombs, 191, 201
EPSTEIN, R., 287
Fourier transform, 397
equalization, 472
FRECHET, M., 466
equalizations
frequency concept of probability, 70
expected number of, 479
frustration solitaire, 86
ergodic Markov chain, 433
Fundamental Limit Theorem for Regular
Markov Chains, 448
ESP, 250, 251
fundamental matrix, 419
EUCLID, 85
for a regular Markov chain, 457
Euler’s formula, 202
506
INDEX
Hardy-Weinberg Law, 349
harmonic function, 428
GALAMBOS, J., 303
Harvard, 27
GALILEO, G., 13
hat check problem, 82, 85, 105
Gallup Poll, 14, 335
heights
Galton board, 99, 351
distribution of, 345
GALTON, F., 282, 345, 350, 376
helium, 107
GaltonBoard (program), 99
HEYDE, C., 377
Gambler’s Ruin, 426, 486, 487
HILL, T., 196
Holmes, Sherlock, 91
gambling systems, 241
HorseRace (program), 6
gamma density, 207
hospital, 14, 250
GARDNER, M., 181
HOWARD, R. A., 406
gas diffusion
Ehrenfest model of, 410, 433, 441, HTSimulation (program), 6
HUDDE, J., 148
460, 461
HUIZINGA, F., 388
GELLER, S., 176
HUYGENS, C., 147, 243–245
GeneralSimulation (program), 9
hypergeometric distribution, 193
generating function
hypotheses, 145
for continuous density, 393
hypothesis testing, 101
moment, 366, 394
ordinary, 369
Inclusion-Exclusion Principle, 104
genes, 348, 411
independence of events, 139, 164
genetics, 345
mutual, 141
genotypes, 348
independence of random variables
geometric distribution, 184
mutual, 143, 165
geometric series, 29
independence of random
GHOSH, B. K., 160
variables, 143, 165
goat, 137
independent trials process, 144, 168
GONSHOR, H., 425
interarrival time, average, 208
GOSSET, W. S., 360
interleaving, 120
grade point average, 343
irreducible Markov chain, 433
GRAHAM, R., 251
Isle Royale, 202
GRANBERG, D., 161
GRAUNT, J., 246
JAYNES, E. T., 49
Greece, 30
JOHNSONBOUGH, R., 153
GRIDGEMAN, N. T., 51, 181
joint cumulative distribution
GRINSTEAD, C. M., 87
function, 165
GUDDER, S., 160
joint density function, 165
for an ergodic Markov chain, 458
HACKING, I., 30, 148
HAMMING, R. W., 284
HANES data, 345
Hangtown, 280
Hanover Inn, 65
hard drive, Warp 9, 66
joint distribution function, 142
joint random variable, 142
KAHNEMAN, D., 38
Kemeny’s constant, 469, 470
KEMENY, J. G., 200, 406, 466
KENDALL, D. G., 377
INDEX
KEYFITZ, N., 382
KILGOUR, D. M., 179, 182
KINGSTON, J. G., 157
KONOLD, C., 161
KOZELKA, R. M., 344
Labouchere betting system, 12, 13
LABOUCHERE, H. du P., 12
LAMPERTI, J., 267, 324
LAPLACE, P. S., 51, 53, 350
last return to the origin, 482
Law (program), 310
Law of Averages, 70
Law of Large Numbers, 307, 316
for Ergodic Markov Chains, 439
Strong, 70
LawContinuous (program), 318
lead change, 482
LEONARD, B., 256
LEONTIEF, W. W., 426
LEVASSEUR, K., 485
library problem, 82
life table, 39
light bulb, 66, 72, 172
Linda problem, 38
LINDEBERG, J. W., 344
LIPSON, A., 161
Little’s law for queues, 276
Lockhorn, Mr. and Mrs., 65
log normal density, 224
lottery
Powerball, 204
LUCAS, E., 119
LUSINCHI, D., 12
MAISTROV, L., 150, 310
MANN, B., 120
margin of error, 335
marginal distribution function, 143
Markov chain, 405
absorbing, 416
ergodic, 433
irreducible, 433
regular, 433
Markov Chains
507
Central Limit Theorem for, 464
Fundamental Limit Theorem for Regular, 448
MARKOV, A. A., 464
martingale, 241, 242, 428
origin of word, 11
martingale betting system, 11, 14, 248
matrix
fundamental, 419
MatrixPowers (program), 407
maximum likelihood
estimate, 198, 202
Maximum Likelihood
Principle, 91, 117
Maxwell density, 215
maze, 440, 453
McCRACKEN, D., 10
mean, 226
mean first passage matrix, 455
mean first passage time, 453
mean recurrence matrix, 455
mean recurrence time, 454
memoryless property, 68, 164, 206
milk, 252
modular arithmetic, 10
moment generating function, 366, 394
moment problem, 368, 397
moments, 365, 393
Monopoly, 469
MonteCarlo (program), 42
Monty Hall problem, 136, 161
moose, 202
mortality table, 246
mule kicks, 201
MULLER, M. E., 213
multiple-gene hypothesis, 348
mustache, 153
mutually independent events, 141
mutually independent random
variables, 143
negative binomial distribution, 186
New York Times, 340
New York Yankees, 118, 253
New-Age Solitaire, 130
508
NEWCOMB, S., 196
NFoldConvolution (program), 287
NIGRINI, M., 196
normal density, 47, 212
NormalArea (program), 322
nursery rhyme, 84
odds, 27
ordering, random, 127
ordinary generating function, 369
ORE, O., 30, 31
outcome, 18
Oz, Land of, 406, 439
Вґ
POLYA,
G., 15, 17, 475
Pascal’s triangle, 94, 103, 108
PASCAL, B., 4, 32–35, 107, 112–113,
156, 242, 245
paternity suit, 222
PEARSON, K., 9, 351
PENNEY, W., 432
People v. Collins, 153, 202
PERLMAN, M. D., 45
permutation, 79
fixed points of, 82
Philadelphia 76ers, 15
photons, 106
Pickwick, Mr., 153
Pilsdorff Beer Company, 280
PITTEL, B., 256
point count, 287
Poisson approximation to the
binomial distribution, 189
Poisson distribution, 187
variance of, 263
poker, 95
polls, 333
Polya urn model, 152, 174
ponytail, 153
posterior probabilities, 145
Powerball lottery, 204
PowerCurve (program), 102
Presidential election, 335
PRICE, C., 86
prior probabilities, 145
INDEX
probability
Bayes, 136
conditional, 133
frequency concept of, 2
of an event, 19
transition, 406
vector, 407
problem of points, 32, 112, 147, 156
process, random, 128
PROPP, J., 256
PROSSER, R., 200
protons, 106
quadratic equation, roots of, 73
quantum mechanics, 107
QUETELET, A., 350
Queue (program), 208
queues, 186, 208, 275
quincunx, 351
Вґ
RENYI,
A., 167
RABELAIS, F., 12
racquetball, 157
radioactive isotope, 66, 71
RAND Corporation, 10
random integer, 39
random number generator, 2
random ordering, 127
random process, 128
random variable, 1, 18
continuous, 58
discrete, 18
functions of a, 210
joint, 142
random variables
independence of, 143
mutual independence of, 143
random walk, 471
in n dimensions, 17
RandomNumbers (program), 3
RandomPermutation (program), 82
rank event, 160
raquetball, 13
rat, 440, 453
Rayleigh density, 215, 295
INDEX
records, 83, 234
Records (program), 84
regression on the mean, 282
regression to the mean, 345, 352
regular Markov chain, 433
reliability of a system, 154
restricted choice, principle of, 182
return to the origin, 472
first, 473
last, 482
probability of eventual, 475
reversibility, 463
reversion, 352
riffle shuffle, 120
RIORDAN, J., 86
rising sequence, 120
rnd, 42
ROBERTS, F., 426
Rome, 30
ROSS, S., 270, 276
roulette, 13, 237, 432
run, 229
SAGAN, H., 237
sample, 333
sample mean, 265
sample space, 18
continuous, 58
countably infinite, 28
infinite, 28
sample standard deviation, 265
sample variance, 265
SAWYER, S., 412
SCHULTZ, H., 255
SENETA, E., 377, 444
service time, average, 208
SHANNON, C. E., 465
SHOLANDER, M., 39
shuffling, 120
SHULTZ, H., 256
SimulateChain (program), 439
simulating a random variable, 211
snakeeyes, 27
SNELL, J. L., 87, 175, 406, 466
snowfall in Hanover, 83
509
spike graph, 6
Spikegraph (program), 6
spinner, 41, 55, 59, 162
spread, 266
St. Ives, 84
St. Petersburg Paradox, 227
standard deviation, 257
standard normal random
variable, 213
standardized random variable, 264
standardized sum, 326
state
absorbing, 416
of a Markov chain, 405
transient, 416
statistics
applications of the Central Limit Theorem to, 333
stepping stones, 412
SteppingStone (program), 413
stick of unit length, 73
STIFEL, M., 110
STIGLER, S., 350
Stirling’s formula, 81
STIRLING, J., 88
StirlingApproximations
(program), 81
stock prices, 241
StockSystem (program), 241
Strong Law of Large
Numbers, 70, 314
suit event, 160
SUTHERLAND, E., 182
t-density, 360
TARTAGLIA, N., 110
tax returns, 196
tea, 252
telephone books, 256
tennis, 157, 424
tetrahedral numbers, 108
THACKERAY, W. M., 14
THOMPSON, G. L., 406
THORP, E., 247, 253
time to absorption, 419
510
TIPPETT, L. H. C., 10
traits, independence of, 216
transient state, 416
transition matrix, 406
transition probability, 406
tree diagram, 24, 76
infinite binary, 69
Treize, 85
triangle
acute, 73
triangular numbers, 108
trout, 198
true-false exam, 267
Tunbridge, 154
TVERSKY, A., 14, 38
Two aces problem, 181
two-armed bandit, 170
TwoArm (program), 171
type 1 error, 101
type 2 error, 101
typesetter, 189
ULAM, S., 11
unbiased estimator, 266
uniform density, 205
uniform density function, 60
uniform distribution, 25, 183
uniform random variables
sum of two continuous, 63
unshuffle, 122
USPENSKY, J. B., 299
utility function, 227
VANDERBEI, R., 175
variance, 257, 271
calculation of, 258
variation distance, 128
VariationList (program), 128
volleyball, 158
von BORTKIEWICZ, L., 201
von MISES, R., 87
von NEUMANN, J., 10, 11
vos SAVANT, M., 40, 86, 136, 176, 181
Wall Street Journal, 161
watches, counterfeit, 91
INDEX
WATSON, H. W., 377
WEAVER, W., 465
Weierstrass Approximation Theorem, 315
WELDON, W. F. R., 9
Wheaties, 118, 253
WHITAKER, C., 136
WHITEHEAD, J. H. C., 181
WICHURA, M. J., 45
WILF, H. S., 91, 474
WOLF, R., 9
WOLFORD, G., 159
Woodstock, 154
Yang, 130
Yin, 130
ZAGIER, D., 485
Zorg, planet of, 90
© Copyright 2026 Paperzz