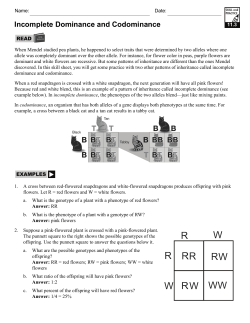
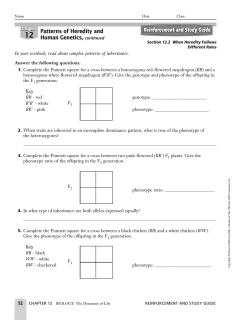
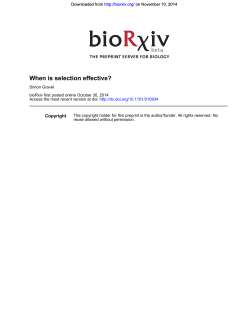
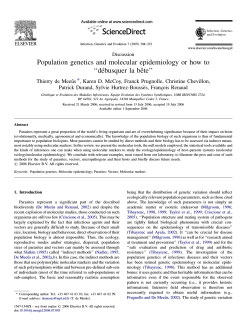
bi04_tetx_ch11 3/29/04 8:12 PM Page 267 11–2 Probability and Punnett Squares Section 11–2 TEKS: 2D TEKS SUPPORT: 2D Communicate valid conclusions 1 FOCUS W henever Mendel performed a cross with pea plants, he carefully categorized and counted the many offspring. Every time Mendel repeated a particular cross, he obtained similar results. For example, whenever Mendel crossed two plants that were hybrid for stem height (Tt), about three fourths of the resulting plants were tall and about one fourth were short. Mendel realized that the principles of probability could be used to explain the results of genetic crosses. Genetics and Probability The likelihood that a particular event will occur is called probability. As an example of probability, consider an ordinary event like the coin flip shown in Figure 11– 6. There are two possible outcomes: The coin may land heads up or tails up. The chances, or probabilities, of either outcome are equal. Therefore, the probability that a single coin flip will come up heads is 1 chance in 2. This is 1/2, or 50 percent. If you flip a coin three times in a row, what is the probability that it will land heads up every time? Because each coin flip is an independent event, the probability of each coin’s landing heads up is 1/2. Therefore, the probability of flipping three heads in a row is: П« П« Objectives Key Concepts • How do geneticists use the principles of probability? • How do geneticists use Punnett squares? 11.2.1 Explain how geneticists use the principles of probability. 11.2.2 Describe how geneticists use Punnett squares. Vocabulary probability Punnett square homozygous heterozygous phenotype genotype Reading Strategy: Building Vocabulary Before you read, preview the list of new vocabulary words. Predict the relationship between phenotype and genotype. As you read, check to see if your predictions were correct. = . As you can see, you have 1 chance in 8 of flipping heads three times in a row. That the individual probabilities are multiplied together illustrates an important point—past outcomes do not affect future ones. How is coin flipping relevant to genetics? The way in which alleles segregate is completely random, like a coin flip. The principles of probability can be used to predict the outcomes of genetic crosses. What is the probability that a tossed coin will come up tails twice in a row? Vocabulary Preview Ask: What suffix do the words homozygous and heterozygous share? (-zygous) Tell students that -zygous means “yoked” or “joined,” and the prefix homo- means “same.” Also explain that a homozygous organism has two identical alleles for a certain gene. Ask: If hetero- means “other,” what does heterozygous describe? (An organism with two different alleles for a gene) Reading Strategy Encourage students to write down the main headings of the section before they begin reading. Tell them to leave room below each heading to record important ideas as they read. 2 INSTRUCT Genetics and Probability М€ Figure 11–6 The mathematical concept of probability allows you to calculate the likelihood that a particular event will occur. Predicting What is the probability that the coin will land heads up? SECTION RESOURCES Print: Technology: • Teaching Resources, Section Review 11–2, Enrichment • Guided Reading and Study Workbook, Section 11–2 • TAKS Success Daily Planner, Section 11–2 • iText, Section 11–2 • Transparencies Plus, Section 11–2 • Lab Simulations CD-ROM, Mendelian Inheritance Make Connections Mathematics Give pairs of students a paper bag that has 4 items that are identical except for color. The items should be the same shape and size. Ask: What is the probability of picking a red item? (1/4 or 25 percent) Of picking a red item two times in a row? (1/4 П« 1/4 П 1/16) Then, instruct students to pick an item from the bag 20 times, then 50 times. Ask: Did your results equal your calculated probabilities? (The more times students pick from the bag, the closer their actual results will be to the predicted probability.) Answers to . . . CHECKPOINT 1/4 or 25 percent Figure 11–6 1/2 or 50 percent Introduction to Genetics 267 bi04_tetx_ch11 2/28/03 10:55 PM Page 268 11–2 (continued) Father’s genotype is dd (2 even digits) Mother’s genotype is Dd (1 even digit and 1 odd digit) Punnett Squares 4638 How are dimples inherited? Quick Lab Materials copy of page from telephone book, calculator Objective Students will be able to conclude how dimples are inherited. Skills Focus Applying Concepts, Drawing Conclusions Materials copy of page from telephone book, calculator Time 15 minutes Advance Prep Photocopy several pages from a telephone book. Strategies • Demonstrate the use of a 4-digit number to represent the genotypes of the parents in a genetic cross. • Show students how to set up and use Punnett squares, if necessary. Expected Outcomes Students will determine the probability of having a child with dimples based on the genotypes of the parents. Calculated probabilities will vary depending on the genotypes of the parents. Analyze and Conclude 1. Class averages will vary but will usually be close to 75 percent dimples, the result of a cross between two heterozygotes. 2. 100 percent because the allele for dimples (D) is a dominant allele. Probability and Segregation Address Misconceptions Beginning genetics students often misinterpret probable genotypic and phenotypic ratios as actual numbers of offspring. Provide opportunities to calculate “actual” ratios using F2 corn cobs or experimental data. Students should set up Punnett squares and compare the predicted ratios with the “actual” ratios. Procedure 1. Write the last 4 digits of any telephone number. These 4 random digits represent the alleles of a gene that determines whether a person will have dimples. Odd digits represent the allele for the dominant trait of dimples. Even digits stand for the allele for the recessive trait of no dimples. 2. Use the п¬Ѓrst 2 digits to represent a certain father’s genotype. Use the symbols D and d to write his genotype, as shown in the example. 3. Use the last 2 digits the same way to п¬Ѓnd the mother’s genotype. Write her genotype. Chapter 11 Analyze and Conclude 1. Applying Concepts How does the class average compare with the result of a cross of two heterozygous parents? 2. Drawing Conclusions What percentage of the children will be expected to have dimples if one parent is homozygous for dimples (DD) and the other is heterozygous (Dd)? Punnett Squares Tt Tt T t T TT 25% Tt 25% t Tt 25% tt 25% М† Figure 11–7 The principles of probability can be used to predict the outcomes of genetic crosses. This Punnett square shows the probability of each possible outcome of a cross between hybrid tall (Tt) pea plants. The gene combinations that might result from a genetic cross can be determined by drawing a diagram known as a Punnett square. The Punnett square in Figure 11–7 shows one of Mendel’s segregation experiments. The types of gametes produced by each F1 parent are shown along the top and left sides of the square. The possible gene combinations for the F2 offspring appear in the four boxes that make up the square. The letters in the Punnett square represent alleles. In this example, T represents the dominant allele for tallness and t represents the recessive allele for shortness. Punnett squares can be used to predict and compare the genetic variations that will result from a cross. Organisms that have two identical alleles for a particular trait—TT or tt in this example—are said to be homozygous (hoh-moh-ZY-gus). Organisms that have two different alleles for the same trait are heterozygous (het-ur-oh-ZY-gus). Homozygous organisms are truebreeding for a particular trait. Heterozygous organisms are hybrid for a particular trait. All of the tall plants have the same phenotype, or physical characteristics. They do not, however, have the same genotype, or genetic makeup. The genotype of one third of the tall plants is TT, while the genotype of two thirds of the tall plants is Tt. The plants in Figure 11–8 have the same phenotype but different genotypes. CUSTOMIZED INSTRUCTION Inclusion/Special Needs Give students additional opportunities to practice calculating probabilities by making available a “probabilities kit.” In this “kit,” provide coins and a grab bag with colored beads, colored sticks, or any other manipulative that differs only in color. You might have these students pair up with advanced students to predict probabilities and observe the outcomes. 268 4. Use Figure 11–7 as an example to construct a Punnett square for the cross of these parents. Then, using the Punnett square, determine the probability that their child will have dimples. 5. Determine the class average of the percent of children with dimples. Less Proficient Readers Challenge students to write an instructional manual for using Punnett squares. Students should include a labeled diagram of a Punnett square in their manual, as well as step-by-step directions on how to use one and why Punnett squares are useful tools for geneticists. bi04_tetx_ch11 3/29/04 8:16 PM Page 269 Probabilities Predict Averages Probability and Segregation Look again at Figure 11–7. One fourth (1/4) of the F2 plants have two alleles for tallness (TT); 2/4, or 1/2, of the F2 plants have one allele for tallness and one allele for shortness (Tt). Because the allele for tallness is dominant over the allele for shortness, 3/4 of the F2 plants should be tall. Overall, there are 3 tall plants for every 1 short plant in the F2 generation. Thus, the ratio of tall plants to short plants is 3 : 1. This assumes, of course, that Mendel’s model of segregation is correct. Did the data from Mendel’s experiments п¬Ѓt his model? Yes. The predicted ratio—3 dominant to 1 recessive—showed up consistently, indicating that Mendel’s assumptions about segregation had been correct. For each of his seven crosses, about 3/4 of the plants showed the trait controlled by the dominant allele. About 1/4 showed the trait controlled by the recessive allele. Segregation did indeed occur according to Mendel’s model. Build Science Skills Designing Experiments Give students a coin or a bag with 2 or 3 beads that differ in color. Ask them to design an experiment to show that probabilities cannot predict the outcome of an individual event. 3 ASSESS TT Homozygous Tt Heterozygous М† Probabilities Predict Averages Probabilities predict the average outcome of a large number of events. However, probability cannot predict the precise outcome of an individual event. If you flip a coin twice, you are likely to get one head and one tail. However, you might also get two heads or two tails. To be more likely to get the expected 50 : 50 ratio, you would have to flip the coin many times. The same is true of genetics. The larger the number of offspring, the closer the resulting numbers will get to expected values. If an F1 generation contains just three or four offspring, it may not match Mendelian predicted ratios. When an F1 generation contains hundreds or thousands of individuals, however, the ratios usually come very close to matching expectations. Figure 11–8 Although these plants have different genotypes (TT and Tt), they have the same phenotype (tall). Predicting If you crossed these two plants, would their offspring be tall or short? Give student pairs a list of genetic crosses between parents of various genotypes. Instruct pairs to use Punnett squares to show the possible outcomes of the crosses. Mathematics 9 Key Concept How are the principles of probability used to predict the outcomes of genetic crosses? 2. Key Concept How are Punnett squares used? 3. What is probability? 4. Deп¬Ѓne the terms genotype and phenotype. 5. Critical Thinking Problem Solving An F1 plant that is homozygous for shortness is crossed with a heterozygous F1 plant. What is the probability that a seed from the cross will produce a tall plant? Use a Punnett square to explain your answer and to compare the probable genetic variations in the F2 plants. Assign students different traits in peas. Then, instruct them to set up a Punnett square to show the cross between two heterozygous pea plants for their trait. Students should give both the genotypic and phenotypic ratio of the offspring. Reteach 11–2 Section Assessment 1. Evaluate Understanding Probability A geneticist crosses a pea plant that is heterozygous for the trait of gray seed color (Gg) with a plant from a true-breeding strain that produces only white seeds (gg). What is the probability that an offspring of this cross will have white seeds? Write out your calculations. The probability that the cross will produce a white-seed offspring is 50 percent. A fertilized egg receives gametes from two parents. Since one parent has the genotype Gg, the probability that an offspring will receive a g from that parent is 1/2. The other parent — of genotype gg — can produce only one kind of gamete, g, so the probability that an offspring will receive a g from that parent is 1. Multiplication (1/2 П« 1) gives 1/2, or 50 percent, probability that an offspring will have the genotype gg and the phenotype of white seeds. 11–2 Section Assessment 1. The way in which the alleles segregate is random, and probability allows the calculation of the likelihood that a particular allele combination will occur in offspring. 2. To predict and compare the genetic variations that will result from a cross 3. The likelihood that a particular event will occur 4. Genotype: actual alleles present for a trait, or genetic makeup; phenotype: visible expression of the alleles, or physical characteristics 5. 50 percent; Punnett square: T t t Tt tt t Tt tt If your class subscribes to the iText, use it to review the key concepts in Section 11–2. Answer to . . . Figure 11–8 The offspring would be 100 percent tall. Introduction to Genetics 269
© Copyright 2026 Paperzz