Paper
zz
Explore Categories
Log in
Create new account
Lifestyle and Career
Quantitative Literacy: Why Numeracy Matters for Schools and Colleges
Download
Report
diary dates - Old Heath Community Primary School
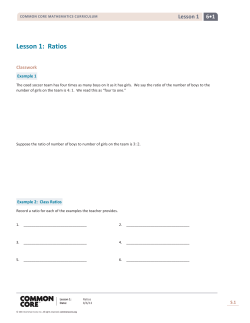
Lesson 1: Ratios - Common Core
%20biosketch.pdf;Abstract & Speaker Profile
(v) Tableware, kitchenware, toilet articles, carpets and other textile
Mathematics 1 - Phillips Exeter Academy
What Is Statistics?
Early Years Learning and Development
ACADEMY TRUST GCSE OPTIONS BOOKLET 2014 - 2016
(502) mould handle:cp _tsspec_055
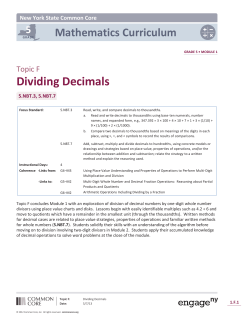
Topic F: Dividing Decimals - The Syracuse City School District
Riccardo Cristoferi - SISSA People Personal Home Pages
© Copyright 2026 Paperzz
About Paperzz
DMCA / GDPR
Report