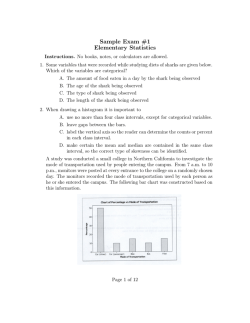
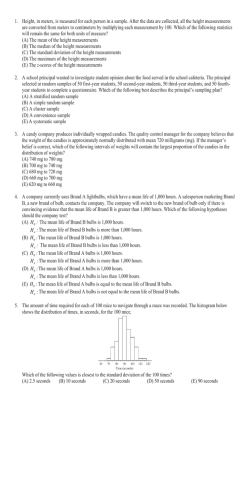
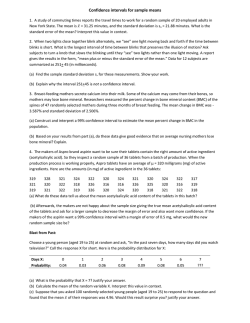
STA 2023 STATISTICS Sample Final Exam Nishant Patel The Final Exam will contain 25 questions, part multiple choices and part essay type questions. The questions on the Final exam will resemble the ones on this sample exam but some variations must be expected. To study for the final exam students should not limit themselves to these questions only. Identify the data set's level of measurement. 1) the amounts of fat (in grams) in 44 cookies A) ratio B) ordinal C) interval D) nominal Identify the sampling technique used. 2) To ensure customer satisfaction, every 35th phone call received by customer service will be monitored. A) convenience B) stratified C) systematic D) random E) cluster Provide an appropriate response. 3) Use the histogram below to approximate the median heart rate of adults in the gym. A) 75 B) 65 C) 70 D) 42 C) 4.2 D) 2.8 4) Find the sample standard deviation. 22 29 A) 4.8 21 24 27 28 B) 1.6 25 36 5) A competency test has scores with a mean of 82 and a standard deviation of 2. A histogram of the data shows that the distribution is normal. Between what two values do about 99.7% of the values lie? A) Between 80 and 84 B) Between 76 and 88 C) Between 78 and 86 D) Between 74 and 90 6) SAT verbal scores are normally distributed with a mean of 426 and a standard deviation of 94. Use the Empirical Rule to determine what percent of the scores lie between 332 and 426. A) 68% B) 47.5% C) 34% D) 49.9% 7) The cholesterol levels (in milligrams per deciliter) of 30 adults are listed below. Find the interquartile range for the cholesterol level of the 30 adults. A) 180 B) 30 C) 31 D) 211 C) 148 D) 146 Approximate the mean of the grouped data. 8) A) 150 B) 10 Provide an appropriate response. 9) A group of students were asked if they carry a credit card. The responses are listed in the table. If a student is selected at random, find the probability that he or she is a sophomore given that the student owns a credit card. Round your answers to three decimal places. A) 0.429 B) 0.571 C) 0.120 D) 0.700 10) The probability it will rain is 40% each day over a three-day period. What is the probability it will rain at least one of the three days? 11) The table lists the smoking habits of a group of college students. If a student is chosen at random, find the probability of getting someone who is a man or a non-smoker. Round your answer to three decimal places. A) 0.920 B) 0.946 C) 0.847 D) 0.942 12) The random variable x represents the number of credit cards that adults have along with the corresponding probabilities. Find the mean and standard deviation. 13) In a raffle, 1,000 tickets are sold for $2 each. One ticket will be randomly selected and the winner will receive a laptop computer valued at $1200. What is the expected value for a person that buys one ticket? 14) The probability that an individual is left-handed is 0.18. In a class of 50 students, what is the mean and standard deviation of the number of left-handers in the class? Use binomial probability distribution. 15) In a recent survey, 77% of the community favored building a police substation in their neighborhood. If 14 citizens are chosen, find the probability that exactly 5 of them favor the building of the police substation. Use binomial distribution probabilities. 16) The probability that an individual is left-handed is 0.11. In a class of 40 students, what is the probability of finding five left-handers? Use binomial distribution probabilities. 17) A recent survey found that 70% of all adults over 50 wear glasses for driving. In a random sample of 10 adults over 50, what is the probability that at least six wear glasses? Use binomial distribution probabilities. 18) According to government data, the probability that a woman between the ages of 25 and 29 was never married is 40%. In a random survey of 10 women in this age group, what is the probability that two or fewer were never married? Use binomial probabilities. 19) Find the area of the indicated region under the standard normal curve. 20) Use the standard normal distribution to find P(-2.25 < z < 1.25). A) 0.8822 B) 0.4878 C) 0.8944 D) 0.0122 21) Find the z-score that corresponds to the given area under the standard normal curve. 22) For the standard normal curve, find the z-score that corresponds to the A) -0.98 B) -0.12 C) -0.47 percentile. D) -0.53 23) Assume that the heights of women are normally distributed with a mean of 63.6 inches and a standard deviation of 2.5 inches. If 75 women are randomly selected, find the probability that they have a mean height between 63 and 65 inches. A) 0.9811 B) 0.3071 C) 0.2119 D) 0.0188 24) For the standard normal curve, find the z-score that corresponds to the third quartile. Provide an appropriate response. Use the Standard Normal Table to find the probability. 25) The lengths of pregnancies of humans are normally distributed with a mean of 268 days and a standard deviation of 15 days. Find the probability of a pregnancy lasting more than 300 days. A) 0.2375 B) 0.0166 C) 0.3189 D) 0.9834 26) The distribution of cholesterol levels in teenage boys is approximately normal with and (Source: U.S. National Center for Health Statistics). Levels above 200 warrant attention. Find the probability that a teenage boy has a cholesterol level greater than 200. 27) Find the z-scores for which 98% of the distribution's area lies between -z and z. A) (-0.99, 0.99) B) (-1.645, 1.645) C) (-2.33, 2.33) D) (-1.96, 1.96) 28) The body temperatures of adults are normally distributed with a mean of 98.6° F and a standard deviation of 0.44° F. What temperature represents the 95th percentile? 29) Assume that the heights of men are normally distributed with a mean of 67.9 inches and a standard deviation of 2.8 inches. If 64 men are randomly selected, find the probability that they have a mean height greater than 68.9 inches. 30) Assume that blood pressure readings are normally distributed with a mean of 116 and a standard deviation of 4.8. If 36 people are randomly selected, find the probability that their mean blood pressure will be less than 118. Solve the problem. 31) What is the effect on the width of the confidence interval if the sample size is increased ? A) The width increases. B) The width decreases. C) It is impossible to tell without more information. D) The width remains the same. 32) A random sample of 40 students has mean annual earnings of $3120 and a standard deviation of $677. Find the margin of error if c = 0.95. A) $7 B) $2891 C) $210 D) $77 33) A group of 49 randomly selected students has a mean age of 22.4 years with a standard deviation of 3.8. Construct a 98% confidence interval for the population mean. A) (18.8, 26.3) B) (20.3, 24.5) C) (21.1, 23.7) D) (19.8, 25.1) 34) In order to set rates, an insurance company is trying to estimate the number of sick days that full time workers at an auto repair shop take per year. A previous study indicated that the standard deviation was 2.8 days. How large a sample must be selected if the company wants to be 95% confident that the true mean differs from the sample mean by no more than 1 day? A) 141 B) 512 C) 90 D) 31 35) Find the value of E, the margin of error, for c = 0. 99, n = 15 and s = 5.7. A) 4.38 B) 1.13 C) 3.86 D) 4.90 36) Construct a 90% confidence interval for the population mean, μ. Assume the population has a normal distribution. In a recent study of 22 eighth graders, the mean number of hours per week that they watched television was 19.6 with a standard deviation of 5.8 hours. A) (18.63, 20.89) B) (5.87, 7.98) C) (17.47, 21.73) D) (19.62, 23.12) 37) A researcher wishes to estimate the number of households with two cars. How large a sample is needed in order to be 95% confident that the sample proportion will not differ from the true proportion by more than 4%? A previous study indicates that the proportion of households with two cars is 22%. A) 529 B) 4 C) 291 D) 413 38) The mean score for all NBA games during a particular season was less than 90 points per game. If a hypothesis test is performed, how should you interpret a decision that fails to reject the null hypothesis? A) There is sufficient evidence to reject the claim μ < 90. B) There is not sufficient evidence to reject the claim μ < 90. C) There is sufficient evidence to support the claim μ < 90. D) There is not sufficient evidence to support the claim μ < 90. 39) Find the critical value for a two-tailed test with α = 0.08 and n = 36. A) ±1.75 B) ±1.96 C) ±2.575 D) ±2.33 40) You wish to test the claim that μ ≠17 at a level of significance of α = 0.05 and are given sample statistics n = 35, and Compute the value of the standardized test statistic. Round your answer to two decimal places. A) -1.97 B) -3.12 C) -1.83 D) -2.86 41) Suppose you are using α = 0.05 to test the claim that μ > 13 using a P-value. You are given the sample statistics n = 50, = 13.3, and s = 1.2. Find the P-value. A) 0.0012 B) 0.1321 C) 0.0128 D) 0.0384 42) Find the critical values for a sample with n = 10 and α = 0.05 if A) -2.262 B) -3.250 C) -1.833 43) Find the standardized test statistic to test the claim that = . Two samples are randomly selected from each population. The sample statistics are given below. = 40 = 35 = 13 = 14 = 2.5 = 2.8 A) -1.0 44) B) -2.6 C) -1.6 : μ ≥ 20. D) -1.383 D) -0.8 Find the standardized test statistic, t, to test the claim that = . Two samples are randomly selected and come from populations that are normal. The sample statistics are given below. Assume that = 14 = 12 = 6 = 7 = 2.5 = 2.8 A) -0.962 B) -1.101 C) -1.326 D) -0.813 Solve the problem. 45) Calculate the correlation coefficient, r, for the data below. A) 0.881 B) 0.819 C) 0.990 D) 0.792 46) The data below are the ages and systolic blood pressures (measured in millimeters of mercury) of 9 randomly selected adults. Calculate the correlation coefficient, r. A) 0.960 B) 0.908 C) 0.890 D) 0.998 47) Given a sample with r = -0.541, n = 20, and α = 0.01, determine the standardized test statistic t necessary to test the claim ρ = 0. Round answers to three decimal places. A) -5.132 B) -3.251 C) -2.729 D) -4.671 48) Given a sample with r = 0.823, n = 10, and α = 0.05, determine the critical values to test the claim A) ± 2.306 B) ± 1.383 C) ± 1.833 necessary D) ± 2.821 49) The data below are the number of absences and the final grades of 9 randomly selected students from a statistics class. Find the equation of the regression line for the given data. A) C) = -2.75x - 96.14 B) = 96.14x - 2.75 = -96.14x + 2.75 D) = -2.75x + 96.14 50) Use the regression equation to predict the value of y for x = 1.1. Assume that the variables x and y have a significant correlation. A) -1.051 B) 2.832 C) -1.315 D) 2.719 1) 2) 3) 4) 5) 6) 7) 8) 9) 10) 11) 12) 13) 14) 15) 16) 17) 18) 19) 20) 21) 22) 23) 24) 25) 26) 27) 28) 29) 30) 31) 32) 33) 34) 35) 36) 37) 38) 39) 40) 41) 42) 43) 44) 45) 46) 47) 48) 49) 50) A C C A B C C C A P(rain at least one day) = 1 - P(no rain all three days) = 1 - (0.60)(0.60)(0.60) = 0.784 A mean: 1.23; standard deviation: 0.66 -$0.80 mean: 9; standard deviation: 2.72 0.001 0.179 0.850 0.167 0.6562 A z = 3.07 D A 0.67 B 0.1587 C 99.32° F 0.0021 0.9938 B C C D A C D D A A D C C A C A C A D C
© Copyright 2026 Paperzz