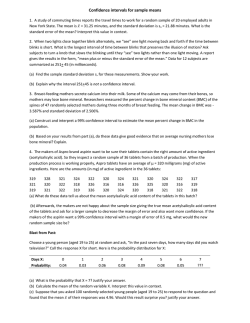
Camden County College MTH-111 Final Exam Sample Questions 1. The collection, organization, summarization, and presentation of data is called: a. Inferential statistics c. Sampling b. A Population d. Descriptive statistics For problem #2 and #3 Identify as a) Discrete or b)Continuous 2. Outdoor temperature at a randomly selected time of the day 3. The number of correct answers in a quiz consisting of 10 questions 4. Every seventh customer entering a shopping mall is asked to select his or her favorite store. The sampling technique this researcher is using is: a. Random d. Cluster b. Systematic e. Convenience c. Stratified 5. News coverage includes exit polls of everyone from each of 80 randomly selected election precincts. The sampling technique used is: a. Random d. Cluster b. Systematic sampling e. Convenience c. Stratified 6. Classifying each child in a day care center as infant, toddler, or preschool is an example of: a. A quantitative variable c. A discrete variable b. A qualitative variable d. A continuous variable 7. For the class 110 – 117 of a given frequency distribution, what is the upper class boundary? a. 110 b. 109.5 c. 117 d. 117.5 8. For the classes 27 – 32, 33 – 38, 39 – 44, what is the class width? a. 26.5 b. 44.5 c. 5 d. 6 9. A motorist recorded the number of gallons of gasoline he used for 8 weeks. The results are as follows: 11, 11, 11, 10, 9, 11, 9, and 10. The mean number of gallons used would be: a. 9.5 b. 10.25 c. 11 d. 10.8 Use the following sample to answer questions 10 and 11: 102, 88, 102, 98, 41, 120 10. The sample mean is a. 91.8 b. 24.6 c. 102 d. 100 11. The sample variance is a. 27 b. 727.4 c. 24.6 d. none b. D7 c. The first quartile 12. P75 is the same as a. Q3 d. the median 13. If a statement is made that more people are buying red cars than any other color, which measure of central tendency is being used? a. Mode b. Population mean c. Median d. Sample mean 14. Generally, if a distribution is negatively skewed (skewed to the left), the mean is: a. b. c. d. to the left of the median to the right of the median equal to the median to the right of the mode Use the following frequency distribution for problems 15 – 17. Class Boundaries 16.5 – 23.5 23.5 – 30.5 30.5 – 37.5 37.5 – 44.5 44.5 – 51.5 Midpoint 20 27 34 41 48 Frequency 8 3 9 7 3 Cum-Freq 8 11 20 27 30 15. The mean is: a. 5.667 b. 32.6 c. 34 d. 33.6 16. The Variance is a. 9.45 b. 99.54 c. 89.21 d. 31.27 17. The Standard deviation is a. 34.5 b. 9.45 c. 89.21 d. 99.54 18. A sample has a mean of 95 and a standard deviation of 20. According to the empirical rule, about 68% of the data will fall between what values? a. 35 and 155 b. 94 and 96 c. 75 and 115 d. 55 and 135 19. In a survey, 42% of Americans said they own an answering machine. If 10 Americans are selected at random, find the probability that exactly 8 own an answering machine. a. 0.153 b. 0.015 c. 0.008 Page 2 d. 0.021 USE THE PROBABILITY DISTRIBUTION BELOW TO ANSWER QUESTIONS 20-23 X P(X) 0 0.1 1 0.2 2 0.2 3 0.1 4 0.3 5 0.1 20. The probability of exactly 4 is, P(4)= a. 0.2 b. 0.3 c. 0.4 d. 0.1 21. The probability of at least 3 is, P( x ³ 3 ) = a. 0.3 b. 0.4 c. 0.5 d. 1.0 b. 1.0 c. 2.0 d. 2.6 c. 1.2 d. 5.2 22. The mean m is a. 5.2 23. The standard deviation s is a. 1.56 b. 2.6 USE THE FOLLOWING INFORMATION TO ANSWER QUESTIONS 24 – 28 Suppose x is a binomial random variable such that n = 5 and p = 0.4 then 24. Find P(x = 4) a. 0.680 b. 0.077 c. 0.770 d. 0.608 b. 0.690 c. 0.618 d. 0.780 b. 0.7701 c. 0.9726 d. 0.9898 b. 3.0 c. 1.2 d. 0.24 b. 1.10 c. 1.41 d. 0.49 25. Find P(x at least 4) a. 0.087 26. Find P(x at most 4) a. 0.8989 27. Find m a. 2.0 28. Find s a. 1.73 For questions 29 through 36, find the probabilities using the standard normal distribution. 29. P( z < 1.97 ) a. 0.9756 b. 0.9292 c. 0.9418 d. 0.8997 b. 0.3461 c. 0.1628 d. 0.3508 30. P( z > 1.02 ) a. 0.1539 Page 3 31. P( z < -1.43 ) a. 0.0987 b. 0.0764 c. 0.4236 d. 0.4251 b. 0.3078 c. 0.0832 d. 0.2566 b. 0.3232 c. 0.3643 d. 0.3843 b. 0.0296 c. 0.4066 d. 0.4236 b. 0.0823 c. 0.4345 d. 0.9177 32. P( -0.87 < z < -0.21 ) a. 0.2247 33. P( -0.05 < z < 1.10 ) a. 0.0199 34. P( 1.32 < z < 1.51) a. 0.0279 35. P( z > -1.39 ) a. 0.4177 36. What is the z-score that corresponds to the 85 a. 1.04 b. -1.04 th c. percentile? 0.1368 d. 0.39 Questions 37 and 38 refer to the following paragraph. The mean time it takes college freshmen to complete the Mason Basic Reasoning Test is 38.3 minutes. The standard deviation is 3.2 minutes. Assume that the times are normally distributed. 37. Find the probability that it will take a student between 35 and 42 minutes to complete the test. a. 0.3485 b. 0.3770 c. 0.285 d. 0.7250 38. Find the probability that it will take a student less than 35 minutes or more than 42 minutes to complete the test. a. 0.3485 b. 0.3770 c. 0.7255 d. 0.2750 39. A small publisher wishes to publish self-improvement books. After a survey of the market, the publisher finds that the mean cost of the type of book that she wishes to publish is $15.00. If she wants to price her books to sell in the middle 34% range, what should the maximum and minimum prices of the books be? The standard deviation is $0.25 and the self-improvement books are normally distributed. a. $13.80 and $16.20 c. $13.91 and $16.09 b. d. Page 4 $14.05 and $15.95 $14.89 and $15.11 40. In order to qualify for letter sorting, applicants are given a speed-reading test. The scores are normally distributed, with a mean of 70 and a standard deviation of 5. The variable is also normally distributed. If only the top 10% are selected, find the cutoff score. a. 70.1 b. 76.4 c. 79.2 d. 79.8 Questions 41 and 42 refer to the following paragraph. The mean annual salary of a certain group of wage earners in Pennsylvania was $25,000 in 1992. Assume that salaries were normally distributed and the standard deviation of this group was $3,000. Assume that the sample was taken from a large population and the correction factor can be ignored. 41. Find the probability that a randomly selected individual earned less than $27,000. a. 0.2514 b. 0.2486 c. 0.7475 d. 0.7888 42. Find the probability that for a randomly selected sample of 10 individuals, the mean salary was less than $27,000. a. 0.0174 b. 0.4826 c. 0.9825 d. 0.9266 43. Prevention magazine reports that 20 % of drivers use a car phone while driving. Find the probability that in a random sample of 80 drivers, exactly 16 will use a car phone while driving. a. 10.34 % b. 11.09 % c. 13 % d. 5.57 % Use the following information for problems 44 and 45. The mean waiting time for a drive-in window at a local bank is 9.2 minutes, with a standard deviation of 2.6 minutes. Assume the waiting times are normally distributed. 44. Find the probability that a customer will have to wait between 5 and 10 minutes. a. 0.4474 b. 0.5677 c.) 0.1217 d. 0.3257 45. Find the probability that a customer will have to wait less than 6 minutes or more than 9 minutes. a. 0.4226 b. 0.6399 c. -0.3907 46. What statistic best estimates the population mean ( m )? a. The population standard deviation ( s ). b. The population variance ( s 2 ). c. The sample standard deviation ( s ). d. The sample mean ( x ). Page 5 d. 0.0319 Use the following information to answer questions 47- 50: IQs are normally distributed with a mean of 100 and a standard deviation of 15 47. What is the probability of randomly selecting an IQ of at least 85? a. 0.1587 b. 85% c. 0.3413 d. 0.8413 48. A job requires an IQ in the top 25%, find the lowest acceptable IQ. a. 90.75 b. 110.12 c. 125.75 d. 118.02 49. If 10 subjects are randomly selected, what is the probability that their mean IQ is between 110 and 130? a. 0.5 b. 0.0800 c. 0.2297 d. 0.0175 50. In the above question, the standard error of the mean s x is a. 4.7434 b. 15 c. 0.9487 d. 0.06 51. A study found that the mean time it took a person to find a new job was 2.5 months. If a sample of 50 job seekers was surveyed, find the 80% confidence interval of the mean. s is known to be 0.3 month. a. 2.45 < m < 2.55 c. 1.83 < m < 3.22 b. 2.15 < m < 2.97 d. 1.74 < m < 3.38 52. A sample of 25 adult elephants had a mean weight of 9,500 pounds, with a sample standard deviation of 150 pounds. Find the 99% confidence interval of the true population mean. Assume that the weights are normally distributed. a. 1576.61 < m < 1609.39 c. 9314.06 < m < 9685.94 b. 9416.09 < m < 9583.91 d. 9214.03 < m < 9785.97 53. A survey of 100 recent fatal traffic accidents showed that 60 were alcohol-related. Find the 98% confidence interval of the true proportion of people who die in alcohol-related accidents. a. 0.434 < p < 0.766 c. 0.486 < p < 0.714 b. 0.410 < p < 0.790 d. 0.505 < p < 0.695 54. A trial is repeated 2000 times with 300 successes. Use a 95 % degree of confidence and find the margin of error E of the proportion p of successes. a. 0.156 b. 1.56 c. 0.0156 55. Evaluate tc for a = 0.01 and a sample of 25 scores. a. 2.797 b. 2.492 c. 1.711 Page 6 d. none of the above d. 2.787 56. A travel agent claims that the mean cost of a three-day trip to Atlantic City is $480. s is known to be $30. Fifty people who scheduled the trip paid an average of $490 for the trip. Test the agent’s claim using a = 0.01 level of significance. H0 : H1 : Critical Value(s): Test Statistic: P-value: Decision: 57. A real estate agent claims that the average price of a condominium in Naples, Florida, is at most $50,000. The standard deviation is s = $8,500. A sample of 81 condominiums has an average selling price of $51,500. Use a a = 0.10 level of significance to test the claim. H0 : H1 : Critical Value(s): Test Statistic: P-value: Decision: 58. A personnel researcher has designed a questionnaire that she believes will take an average time of 35 minutes to complete. Suppose she samples 20 employees and finds that the mean time to take the test is 27 minutes with a standard deviation of 4 minutes. Determine if there is sufficient evidence to conclude that the completion time of the newly designed test differs from its intended duration. Conduct the test at a = 0.05 level of significance. Assume that the population from which the sample is drawn is normally distributed. H0 : H1 : Critical Value(s): Test Statistic: P-value: Decision: 59. A government watchdog association claims that 70 % of Americans agree that the government is inefficient and wasteful. You work for a government agency and are asked to test this claim. You find that in a random sample of 1165 Americans, 785 agreed with this view. At a = 0.05 , do you have enough evidence to reject the association’s claim? H0 : H1 : Critical Value(s): Test Statistic: P-value: Decision: Page 7 60. A team of eye surgeons has developed a new technique for a risky eye operation to restore the sight of people blinded from certain disease. Under the old method, it is known that only 30 % of the patients who undergo this operation recover their eyesight. Suppose that surgeons in various hospitals have performed a total of 225 operations using the new method and that 88 have been successful (the patients fully recovered their sight). Can we justify the claim that the new method is better than the old one? (Use a 1% level of significance). H0 : H1 : Critical Value(s): Test Statistic: P-value: Decision: 61. The Hill of Tara in Ireland is a place of great archaeological importance. This region has been occupied by people for over 4,000 years. Geomagnetic surveys detect subsurface anomalies in the earth’s magnetic field. These surveys have lead to many significant archeological discoveries. The following data measure magnetic susceptibility (centimeter-gram-second ´ 10-6 ) on two of the main grids on the Hill of Tara Grid E: x variable 13.20 5.60 23.90 32.40 19.80 40.75 Grid H: y variable 11.85 15.25 21.30 25.95 57.60 34.35 15.05 5.10 17.30 38.80 21.40 17.75 27.50 41.00 10.35 31.25 17.25 28.35 14.90 27.45 48.70 16.95 25.40 Compute a 75% Chebyshev interval around the mean for x–values and also for y–values. Higher numbers indicate higher magnetic susceptibility. However, extreme values could mean an anomaly and possible archeological treasure. Use the intervals to compare the magnetic susceptibility on the two grids. 62. Compute the sample coefficient of variation for each grid in question 62 above. Use the CV’s to compare the two grids. The coefficient of variation can be thought of as a measure of the variability per unit of expected signal. A considerable variability in the signal (above or below average) might indicate buried artifacts. Why, in this case, would a large CV be better, or at least more exciting? 63. According to the U.S. Census Bureau, the mean commute time to work for a resident of Boston, MA is 27.3 minutes with a standard deviation of 8.1 minutes. Use Chebychev’s Inequality to find the percentage of commuters in Boston having a commute time within 1.5 standard deviations of the mean. What are these commute times? 64. Given the supply of a commodity, x, and the price of a commodity, y, would you expect a positive correlation, a negative correlation, or no correlation? a. positive correlation b. negative correlation c. no correlation Page 8 65. An agricultural business wants to determine if the rainfall in inches can be used to predict the yield per acre on a wheat farm. 66. The data below are the gestation periods, in months, of randomly selected animals and their corresponding life spans, in years. Construct a scatter plot for the data. Determine whether there is a positive linear correlation, a negative linear correlation, or no linear correlation. 67. In order for applicants to work for the foreign-service department, they must take a test in the language of the country where they plan to work. The data below show the relationship between the number of years that applicants have studied a particular language and the grades they received on the proficiency exam. Construct a scatter plot for the data. 68. The data below are the temperatures on randomly chosen days during a summer class and the number of absences on those days. Calculate the correlation coefficient, r. a. 0.890 b. 0.980 c. 0.881 d. 0.819 69. In an area of the Midwest, records were kept on the relationship between the rainfall (in inches) and the yield of wheat (bushels per acre). Calculate the correlation coefficient, r. a. 0.981 b. 0.900 c. 0.899 d. 0.998 70. Which of the following values could not represent a correlation coefficient? a. 0 b. 0.927 c. -1 d. 1.032 71. The data below are the gestation periods, in months, of randomly selected animals and their corresponding life spans, in years. Find the equation of the regression line for the given data. 72. The data below are the temperatures on randomly chosen days during a summer class and the number of absences on those days. Find the equation of the regression line for the given data. a. yˆ = 0.449 x + 30.27 c. yˆ = 30.27 x - 0.449 b. yˆ = 30.27 x + 0.449 d. yˆ = 0.449 x - 30.27 Page 9 73. Given the equation of a regression line is yˆ = 2 x - 5 , what is the best predicted value for y given x = 10 ? Assume that the variables x and y have a significant correlation. a. 15 b. 7 c. 25 d. 48 74. Given the equation of a regression line is yˆ = -1.04 x + 50.3 , determine whether there is a positive linear correlation or a negative linear correlation. a. positive linear correlation b. negative linear correlation 75. The data below are the number of absences and the final grades of 9 randomly selected students from a statistics class. Construct a scatter plot for the data. MTH-111 Final Review Answer Key 1. d 13. a 2. b 14. a 3. a 4. b 15. b 5. d 16. c 24. b binompdf (5, 0.4, 4 ) 27. a 28. b 6. b 7. d 17. b 18. c 8. d 9. b 19. b Fall 2011 10. a 20. b 25. a 1–binomcdf (5, 0.4, 3) 29. a normalcdf(-E99, 1.97) 11. b 21. c 12. a 22. d 23. a 26. d binomcdf (5, 0.4, 4) 30. a normalcdf (1.02, E99) 31. b normalcdf (-E99, -1.43) 32. a normalcdf (-0.87, -0.21) 33. d normalcdf (-0.05, 1.10) 34. a normalcdf (1.32, 1.51) 35. d normalcdf (-1.39, E99) 36. a invnorm (0.85) 37. d normalcdf (35, 42, 38.3, 3.2) 38. d 1–normalcdf (35, 42, 38.3, 3.2) 39. d 41. c normalcdf (-E99, 27000, 25000, 3000) 43. b binompdf (80, 0.20, 16) 52. b STAT> >TESTS 8 42. c normalcdf (-E99, 27000, 25000, 3000 44. b normalcdf (5, 10, 9.2, 2.6) 45. b 1–normalcdf (6, 9, 9.2, 2.6) 48. b invnorm (0.75, 100, 15) 40. b invnorm (0.90, 70, 5) 46. d 47. d normalcdf (85, E99, 100, 15) 49. d normalcdf (110, 130, 100, 15 53. c STAT> >TESTS A Page 10 54. c 10 55. a ) 50. a 51. a 10 ) 56. STAT> >TESTS 1 H 0 : m = 480 claim H1 : m ¹ 480 CV : z = ±2.575 TS : z = 2.36 p - value : 0.0184 Fail to Reject H 0 At the 1% level of significance, there is insufficient evidence to warrant rejection of the travel agent ' s claim that the mean cost of a three day trip to Atlantic City is $480. 57. STAT> >TESTS 2 H 0 : m = 50, 000 claim H1 : m > 50, 000 CV : t = 1.292 TS : t = 1.59 p - value : 0.0580 Reject H 0 At the 10% level of significance, there is sufficient evidence to warrant rejection of the real estate agent ' s claim that the average price of a condo in Naples, FL is at most $50, 000. 58. STAT> >TESTS 2 H 0 : m = 35 claim H1 : m ¹ 35 CV : t = ±2.093 TS : t = -8.94 p - value : 0.0 Reject H 0 At the 5% level of significance, there is sufficient evidence to conclude that the average completion time of the newly designed test differs from its intended duration. Page 11 59. STAT> >TESTS 5 H 0 : p = 0.70 claim H1 : p ¹ 0.70 CV : z = ±1.96 TS : z = -1.9499 p - value : 0.0512 Fail to Reject H 0 At the 5% level of significance, there is insufficient evidence to warrant rejection of the association ' s claim that 70% of Americans believe that the government is inefficient and wasteful. 60. STAT> >TESTS 5 H 0 : p = 0.30 H1 : p > 0.30 claim CV : z = 2.33 TS : z = 2.98 p - value : 0.0014 Reject H 0 At the 1% level of significance, there is sufficient evidence to support the claim that the new method is better than the old one. 61. x - 2 s = 20.35 - 2(9.80) = 0.75 x + 2s = 20.35 + 2(9.80) = 39.95 For Grid E, at least 75 % of the data fall in the interval 0.75–39.95. y - 2s = 28.1 - 2(13.93) = 0.24 y + 2 s = 28.1 + 2(13.93) = 55.96 For Grid H, at least 75% of the data fall in the interval 0.24–55.96. Grid H shows a wider 75% range of values. 62. Grid E: CV = s 9.80 ×100 = × 100 » 48% x 20.35 Grid H: CV = s 13.93 ×100 = ×100 » 50% y 28.1 Grid H demonstrates slightly greater variability per expected signal. The CV, together with the Chebychev interval, indicates that Grid H might have more buried artifacts. 63. Approximately 55.6 % of commuters in Boston have a commute time between 15.15 minutes and 39.45 minutes. Page 12 64. b 65. explanatory variable: rainfall in inches; response variable: yield per acre 66. 67. There appears to be a positive linear correlation. 68. b 69. a 70. d 71. yˆ = 1.523 x + 6.343 75. Page 13 72. d 73. a 74. b
© Copyright 2026 Paperzz