Introduction to
Probability
C
H
A
P
T
E
R
LEARNING OBJECTIVES
After reading
this chapter
you should
be able to:
LO 4.1 Describe fundamental probability concepts.
LO 4.2 Formulate and explain subjective, empirical, and classical probabilities.
LO 4.3 Calculate and interpret the probability of the complement of an event
and the probability that at least one of two events will occur.
LO 4.4 Calculate and interpret a conditional probability and apply the multiplication rule.
LO 4.5 Distinguish between independent and dependent events.
LO 4.6 Calculate and interpret probabilities from a contingency table.
LO 4.7 Apply the total probability rule and Bayes’ theorem.
Every day we make choices about issues in the presence of uncertainty. Uncertainty describes a
situation where a variety of events are possible. Usually, we either implicitly or explicitly assign probabilities to these events and plan or act accordingly. For instance, we read the paper, watch the news,
or check the Internet to determine the likelihood of rain and whether we should carry an umbrella.
Retailers strengthen their sales force before the end-of-year holiday season in anticipation of an
increase in shoppers. The Federal Reserve cuts interest rates when it believes the economy is at risk
for weak growth and raises interest rates when it feels that inflation is the greater risk. By figuring
out the chances of various events, we are better prepared to make the more desirable choices. This
chapter presents the essential probability tools needed to frame and address many real-world issues
involving uncertainty. Probability theory turns out to be the very foundation for statistical inference,
and numerous concepts introduced in this chapter are essential for understanding later chapters.
100
jag20549_ch04_100-137.indd 100
23/11/12 5:20 PM
I N T R O D U C T O R Y
C A S E
Sportswear Brands
Annabel Gonzalez is chief retail analyst at Longmeadow Consultants, a marketing firm. One aspect of her job is to
track sports-apparel sales and uncover any particular trends that may be unfolding in the industry. Recently, she
has been following Under Armour, Inc., the pioneer in the compression-gear market. Compression garments are
meant to keep moisture away from a wearer’s body during athletic activities in warm and cool weather. Under
Armour has experienced exponential growth since the firm went public in November 2005. However, Nike, Inc.,
and Adidas Group, with 18% and 10% market shares, respectively, have aggressively entered the compressiongear market (The Wall Street Journal, October 23, 2007).
As part of her analysis, Annabel would first like to examine whether the age of the customer matters when
buying compression clothing. Her initial feeling is that the Under Armour brand attracts a younger customer,
whereas the more established companies, Nike and Adidas, draw an older clientele. She believes this information
is relevant to advertisers and retailers in the sporting-goods industry as well as to some in the financial community. She collects data on 600 recent purchases in the compression-gear market. She cross-classifies the data by
age group and brand name, as shown in Table 4.1.
TABLE 4.1 Purchases of Compression Garments Based on Age and Brand Name
Brand Name
Age Group
Under 35 years
35 years and older
Under Armour
Nike
Adidas
174
132
90
54
72
78
Annabel wants to use the sample information to:
1. Calculate and interpret relevant probabilities concerning brand name and age.
2. Determine whether the appeal of the Under Armour brand is mostly to younger customers.
A synopsis of this case is provided at the end of Section 4.3.
jag20549_ch04_100-137.indd 101
23/11/12 5:20 PM
4.1 Fundamental Probability Concepts
LO 4.1
Describe
fundamental
probability
concepts.
Since many choices we make involve some degree of uncertainty, we are better prepared
for the eventual outcome if we can use probabilities to describe which events are likely
and which are unlikely.
A probability is a numerical value that measures the likelihood that an event occurs.
This value is between zero and one, where a value of zero indicates impossible
events and a value of one indicates definite events.
In order to define an event and assign the appropriate probability to it, it is useful to first
establish some terminology and impose some structure on the situation.
An experiment is a process that leads to one of several possible outcomes. The diversity of the outcomes of an experiment is due to the uncertainty of the real world. When
you purchase a new computer, there is no guarantee as to how long it will last before any
repair work is needed. It may need repair in the first year, in the second year, or after two
years. You can think of this as an experiment because the actual outcome will be determined only over time. Other examples of an experiment include whether a roll of a fair
die will result in a value of 1, 2, 3, 4, 5, or 6; whether the toss of a coin results in heads
or tails; whether a project is finished early, on time, or late; whether the economy will
improve, stay the same, or deteriorate; whether a ball game will end in a win, loss, or tie.
A sample space, denoted by S, of an experiment contains all possible outcomes of
the experiment. For example, suppose the sample space representing the letter grade in
a course is given by S 5 {A, B, C, D, F}. If the teacher also gives out an I (incomplete)
grade, then S is not valid because all outcomes of the experiment are not included in S.
The sample space for an experiment need not be unique. For example, in the above experiment, we can also define the sample space with just P (pass) and F (fail) outcomes,
that is, S 5 {P, F}.
An experiment is a process that leads to one of several possible outcomes. A sample
space, denoted S, of an experiment contains all possible outcomes of the experiment.
EXAMPLE 4.1
A snowboarder competing in the Winter Olympic Games is trying to assess her
probability of earning a medal in her event, the ladies’ halfpipe. Construct the
appropriate sample space.
SOLUTION: The athlete’s attempt to predict her chances of earning a medal is an
experiment because, until the Winter Games occur, the outcome is unknown. We
formalize an experiment by constructing its sample space. The athlete’s competition
has four possible outcomes: gold medal, silver medal, bronze medal, and no medal.
We formally write the sample space as S 5 {gold, silver, bronze, no medal}.
Events
An event is a subset of the sample space. A simple event consists of just one of the possible outcomes of an experiment. Getting an A in a course is an example of a simple event.
An event may also contain several outcomes of an experiment. For example, we can define an event as getting a passing grade in a course; this event is formed by the subset of
outcomes A, B, C, and D.
102
E S S E N T I A L S O F B U S I N E S S S TAT I S T I C S
jag20549_ch04_100-137.indd 102
CHAPTER 4
Introduction to Probability
23/11/12 5:20 PM
An event is any subset of outcomes of the experiment. It is called a simple event if
it contains a single outcome.
Let us define two events from Example 4.1, where one event represents “earning a medal”
and the other denotes “failing to earn a medal.” These events are exhaustive because they
include all outcomes in the sample space. In the earlier grade-distribution example, the
events of getting grades A and B are not exhaustive events because they do not include
many feasible grades in the sample space. However, the events P and F, defined as pass
and fail, respectively, are exhaustive.
Another important probability concept concerns mutually exclusive events. For two
mutually exclusive events, the occurrence of one event precludes the occurrence of the
other. Suppose we define the two events “at least earning a silver medal” (outcomes of
gold and silver) and “at most earning a silver medal” (outcomes of silver, bronze, no
medal). These two events are exhaustive because no outcome of the experiment is omitted. However, in this case, the events are not mutually exclusive because the outcome
“silver” appears in both events. Going back to the grade-distribution example, while the
events of getting grades A and B are not exhaustive, they are mutually exclusive, since
you cannot possibly get an A as well as a B in the same course. However, getting grades
P and F are mutually exclusive and exhaustive. Similarly, the events defined as “at least
earning a silver medal” and “at most earning a bronze medal” are mutually exclusive and
exhaustive.
Events are exhaustive if all possible outcomes of an experiment belong to the
events.
Events are mutually exclusive if they do not share any common outcome of an
experiment.
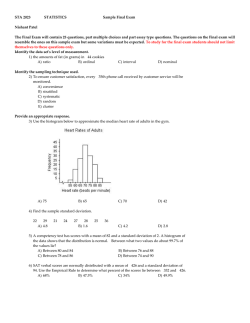
For any experiment, we can define events based on one or more outcomes of the experiment and also combine events to form new events. The union of two events, denoted
A в€Є B, is the event consisting of all outcomes in A or B. A useful way to illustrate these
concepts is through the use of a Venn diagram, named after the British mathematician
John Venn (1834–1923). Figure 4.1 shows a Venn diagram where the rectangle represents
the sample space S and the two circles represent events A and B. The union A в€Є B is the
portion in the Venn diagram that is included in either A or B.
FIGURE 4.1 The union of two events, A в€Є B
A
B
S
Aв€ЄB
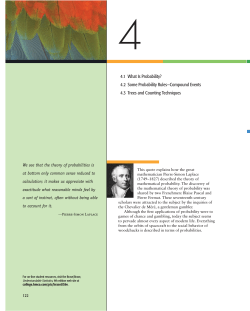
The intersection of two events, denoted A ∩ B, is the event consisting of all outcomes in
A and B. Figure 4.2 depicts the intersection of two events A and B. The intersection A ∩ B
is the portion in the Venn diagram that is included in both A and B.
4.1
jag20549_ch04_100-137.indd 103
Fundamental Probability Concepts
103
23/11/12 5:20 PM
FIGURE 4.2 The intersection of two events, A ∩ B
A
B
S
A∩B
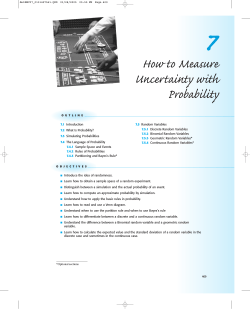
The complement of event A, denoted Ac, is the event consisting of all outcomes in the
sample space S that are not in A. In Figure 4.3, Ac is everything in S that is not included in A.
FIGURE 4.3 The complement of an event, Ac
A
Ac
CO M B I N I N G E V E N T S
•
•
•
The union of two events, denoted A в€Є B, is the event consisting of all outcomes
in A or B.
The intersection of two events, denoted A ∩ B, is the event consisting of all
outcomes in A and B.
The complement of event A, denoted Ac, is the event consisting of all outcomes
in the sample space S that are not in A.
EXAMPLE 4.2
Recall that the snowboarder’s sample space from Example 4.1 is defined as S 5
{gold, silver, bronze, no medal}. Now suppose the snowboarder defines the following three events:
• A 5 {gold, silver, bronze}, that is, event A denotes earning a medal;
• B 5 {silver, bronze, no medal}, that is, event B denotes earning at most a silver medal; and
• C 5 {no medal}, that is, event C denotes failing to earn a medal.
a. Find A в€Є B and B в€Є C.
b. Find A ∩ B and A ∩ C.
c. Find Bc.
104
E S S E N T I A L S O F B U S I N E S S S TAT I S T I C S
jag20549_ch04_100-137.indd 104
CHAPTER 4
Introduction to Probability
23/11/12 5:20 PM
SOLUTION:
a. The union of A and B denotes all outcomes common to A or B; here, the event
A ∪ B 5 {gold, silver, bronze, no medal}. Note that there is no double counting of the outcomes “silver” or “bronze” in A∪B. Similarly, we have the event
B в€Є C 5 {silver, bronze, no medal}.
b. The intersection of A and B denotes all outcomes common to A and B; here,
the event A ∩ B 5 {silver, bronze}. The event A ∩ C 5 [, where [ denotes
the null (empty) set; no common outcomes appear in both A and C.
c. The complement of B denotes all outcomes in S that are not in B; here, the
event Bc 5 {gold}.
Assigning Probabilities
Now that we have described a valid sample space and the various ways in which we can
define events from that sample space, we are ready to assign probabilities. When we
arrive at a probability, we generally are able to categorize the probability as a subjective
probability, an empirical probability, or a classical probability. Regardless of the method
used, there are two defining properties of probability.
LO 4.2
Formulate
and explain
subjective,
empirical,
and classical
probabilities.
THE T WO DEFINING PROPERTIES OF PROBABILITY
1. The probability of any event A is a value between 0 and 1, that is, 0 # P(A) # 1.
2. The sum of the probabilities of any list of mutually exclusive and exhaustive
events equals 1.
Suppose the snowboarder from Example 4.1 believes that there is a 10% chance that she
will earn a gold medal, a 15% chance that she will earn a silver medal, a 20% chance that
she will earn a bronze medal, and a 55% chance that she will fail to earn a medal. She
has assigned a subjective probability to each of the simple events. She made a personal
assessment of these probabilities without referencing any data.
The snowboarder believes that the most likely outcome is failing to earn a medal since she
gives that outcome the greatest chance of occurring at 55%. When formally writing out the
probability that an event occurs, we generally construct a probability statement. Here, the probability statement might take the form: P({no medal}) 5 0.55, where P(“event”) represents the
probability that a given event occurs. Table 4.2 summarizes these events and their respective
subjective probabilities. Note that here the events are mutually exclusive and exhaustive.
TABLE 4.2 Snowboarder’s Subjective Probabilities
Event
Probability
Gold
0.10
Silver
0.15
Bronze
0.20
No medal
0.55
Reading from the table we can readily see, for instance, that she assesses that there is a
15% chance that she will earn a silver medal, or P({silver}) 5 0.15. We should note that
all the probabilities are between the values of zero and one, and they add up to one, thus
meeting the defining properties of probability.
Suppose the snowboarder wants to calculate the probability of earning a medal.
In Example 4.2 we defined “earning a medal” as event A, so the probability statement
takes the form P(A). We calculate this probability by summing the probabilities of the
outcomes in A, or equivalently,
P(A) 5 P({gold}) 1 P({silver}) 1 P({bronze}) 5 0.10 1 0.15 1 0.20 5 0.45.
4.1
jag20549_ch04_100-137.indd 105
Fundamental Probability Concepts
105
23/11/12 5:20 PM
EXAMPLE 4.3
Given the events in Example 4.2 and the probabilities in Table 4.2, calculate the
following probabilities.
a. P(B в€Є C)
b. P(A ∩ C)
c. P(Bc)
SOLUTION:
a. The probability that event B or event C occurs is
P(B в€Є C) 5 P({silver}) 1 P({bronze}) 1 P({no medal})
5 0.15 1 0.20 1 0.55 5 0.90.
b. The probability that event A and event C occur is
P(A ∩ C) 5 0; recall that there are no common outcomes in A and C.
c. The probability that the complement of B occurs is
P(Bc) 5 P({gold}) 5 0.10.
In many instances we calculate probabilities by referencing data based on the observed
outcomes of an experiment. The empirical probability of an event is the observed relative frequency with which an event occurs. The experiment must be repeated a large
number of times for empirical probabilities to be accurate.
EXAMPLE 4.4
The frequency distribution in Table 4.3 summarizes the ages of the richest
400 Americans. Suppose we randomly select one of these individuals.
a. What is the probability that the individual is at least 50 but less than 60 years old?
b. What is the probability that the individual is younger than 60 years old?
c. What is the probability that the individual is at least 80 years old?
TABLE 4.3 Frequency Distribution of Ages of 400 Richest Americans
Ages
Frequency
30 up to 40
7
40 up to 50
47
50 up to 60
90
60 up to 70
109
70 up to 80
93
80 up to 90
45
90 up to 100
9
SOURCE: http://www.forbes.com.
SOLUTION: In Table 4.3a, we first label each outcome with letter notation; for
instance, the outcome “30 up to 40” is denoted as event A. Next we calculate
the relative frequency of each event and use the relative frequency to denote the
probability of the event.
106
E S S E N T I A L S O F B U S I N E S S S TAT I S T I C S
jag20549_ch04_100-137.indd 106
CHAPTER 4
Introduction to Probability
23/11/12 5:20 PM
TABLE 4.3a Relative Frequency Distribution of Ages of 400 Richest Americans
Ages
Event
Frequency
Relative Frequency
30 up to 40
A
7
40 up to 50
B
47
0.1175
7/400 5 0.0175
50 up to 60
C
90
0.2250
60 up to 70
D
109
0.2725
70 up to 80
E
93
0.2325
80 up to 90
F
45
0.1125
90 up to 100
G
9
0.0225
a. The probability that an individual is at least 50 but less than 60 years old is
90 5 0.225.
P(C) 5 ____
400
b. The probability that an individual is younger than 60 years old is
7 1 47 1 90 5 0.360.
P(A в€Є B в€Є C) 5 ___________
400
c. The probability that an individual is at least 80 years old is
45 1 9 5 0.135.
P(F в€Є G) 5 ______
400
In a more narrow range of well-defined problems, we can sometimes deduce probabilities by reasoning about the problem. The resulting probability is a classical probability.
Classical probabilities are often used in games of chance. They are based on the assumption that all outcomes of an experiment are equally likely. Therefore, the classical
probability of an event is computed as the number of outcomes belonging to the event
divided by the total number of outcomes.
EXAMPLE 4.5
Suppose our experiment consists of rolling a six-sided die. Then we can define the
appropriate sample space as S 5 {1, 2, 3, 4, 5, 6}.
a. What is the probability that we roll a 2?
b. What is the probability that we roll a 2 or 5?
c. What is the probability that we roll an even number?
SOLUTION: Here we recognize that each outcome is equally likely. So with 6
possible outcomes, each outcome has a 1/6 chance of occurring.
a. The probability that we roll a 2, P({2}), is thus 1/6.
b. The probability that we roll a 2 or 5, P({2}) 1 P({5}), is 1/6 1 1/6 5 1/3.
c. The probability that we roll an even number, P({2}) 1 P({4}) 1 P({6}), is
1/6 1 1/6 1 1/6 5 1/2.
According to a famous law of large numbers, the empirical probability approaches the
classical probability if the experiment is run a very large number of times. Consider,
for example, flipping a fair coin 10 times. It is possible that the heads may not show up
exactly 5 times and, therefore, the relative frequency may not be 0.5. However, if we flip
the fair coin a very large number of times, the heads will show up approximately 1/2 of
the time.
4.1
jag20549_ch04_100-137.indd 107
Fundamental Probability Concepts
107
23/11/12 5:20 PM
E X E R C I S E S 4 .1
Mechanics
1. Determine whether the following probabilities are best
categorized as subjective, empirical, or classical probabilities.
a. Before flipping a fair coin, Sunil assesses that he has a
50% chance of obtaining tails.
b. At the beginning of the semester, John believes he has a
90% chance of receiving straight A’s.
c. A political reporter announces that there is a 40% chance
that the next person to come out of the conference room
will be a Republican, since there are 60 Republicans and
90 Democrats in the room.
2. A sample space S yields five equally likely events, A, B, C, D,
and E.
a. Find P(D).
b. Find P(Bc).
c. Find P(A в€Є C в€Є E).
3. You roll a die with the sample space S 5 {1, 2, 3, 4, 5, 6}.
You define A as {1, 2, 3}, B as {1, 2, 3, 5, 6}, C as {4, 6}, and
D as {4, 5, 6}. Determine which of the following events are
exhaustive and/or mutually exclusive.
a. A and B
b. A and C
c. A and D
d. B and C
4. A sample space, S, yields four simple events, A, B, C, and D,
such that P(A) 5 0.35, P(B) 5 0.10, and P(C ) 5 0.25.
a. Find P(D).
b. Find P(Cc).
c. Find P(A в€Є B).
Applications
5. Jane Peterson has taken Amtrak to travel from New York
to Washington, DC, on six occasions, of which three times
the train was late. Therefore, Jane tells her friends that the
probability that this train will arrive on time is 0.50. Would
you label this probability as empirical or classical? Why
would this probability not be accurate?
6. Survey data, based on 65,000 mobile phone subscribers, shows
that 44% of the subscribers use smartphones (Forbes, December
15, 2011). Based on this information, you infer that the
probability that a mobile phone subscriber uses a smartphone is
0.44. Would you consider this probability estimate accurate? Is it
a subjective, empirical, or classical probability?
7. Consider the following scenarios to determine if the
mentioned combination of attributes represents a union or
an intersection.
a. A marketing firm is looking for a candidate with a business
degree and at least five years of work experience.
b. A family has decided to purchase Toyota or Honda.
108
E S S E N T I A L S O F B U S I N E S S S TAT I S T I C S
jag20549_ch04_100-137.indd 108
CHAPTER 4
8. Consider the following scenarios to determine if the
mentioned combination of attributes represents a union or
an intersection.
a. There are two courses that seem interesting to you, and
you would be happy if you can take at least one of them.
b. There are two courses that seem interesting to you, and
you would be happy if you can take both of them.
9. You apply for a position at two firms. Let event A represent
the outcome of getting an offer from the first firm and
eventВ B represent the outcome of getting an offer from the
second firm.
a. Explain why events A and B are not exhaustive.
b. Explain why events A and B are not mutually exclusive.
10. An alarming number of U.S. adults are either overweight
or obese. The distinction between overweight and obese is
made on the basis of body mass index (BMI), expressed as
weight/height2. An adult is considered overweight if the BMI
is 25 or more but less than 30. An obese adult will have a BMI
of 30 or greater. According to a January 2012 article in the
Journal of the American Medical Association, 33.1% of the adult
population in the United States is overweight and 35.7% is
obese. Use this information to answer the following questions.
a. What is the probability that a randomly selected adult is
either overweight or obese?
b. What is the probability that a randomly selected adult is
neither overweight nor obese?
c. Are the events “overweight” and “obese” exhaustive?
d. Are the events “overweight” and “obese” mutually
exclusive?
11. Many communities are finding it more and more difficult
to fill municipal positions such as town administrators,
finance directors, and treasurers. The following table shows
the percentage of municipal managers by age group in the
United States for the years 1971 and 2006.
Age
1971
2006
Under 30
26%
1%
30 to 40
45%
12%
41 to 50
21%
28%
51 to 60
5%
48%
Over 60
3%
11%
SOURCE: The International City-County Management Association.
a. In 1971, what was the probability that a municipal
manager was 40 years old or younger? In 2006, what was
the probability that a municipal manager was 40 years
old or younger?
b. In 1971, what was the probability that a municipal manager
was 51 years old or older? In 2006, what was the probability
that a municipal manager was 51 years old or older?
c. What trends in ages can you detect from municipal
managers in 1971 versus municipal managers in 2006?
Introduction to Probability
23/11/12 5:20 PM
12. At four community health centers on Cape Cod,
Massachusetts, 15,164 patients were asked to respond to
questions designed to detect depression (The Boston Globe,
June 11, 2008). The survey produced the following results.
Diagnosis
Number
Mild
3,257
Moderate
1,546
Moderately Severe
Severe
975
773
No Depression
8,613
a. What is the probability that a randomly selected patient
suffered from mild depression?
b. What is the probability that a randomly selected patient
did not suffer from depression?
c. What is the probability that a randomly selected patient
suffered from moderately severe to severe depression?
d. Given that the national figure for moderately severe to
severe depression is approximately 6.7%, does it appear
that there is a higher rate of depression in this summer
resort community? Explain.
4.2 Rules of Probability
Once we have determined the probabilities of simple events, we have various rules to
calculate the probabilities of more complex events.
The Complement Rule
The complement rule follows from one of the defining properties of probability: The sum
of probabilities assigned to simple events in a sample space must equal one. Note that since
S is a collection of all possible outcomes of the experiment (nothing else can happen),
P(S) 5 1. Let’s revisit the sample space that we constructed when we rolled a six-sided
die: S 5 {1, 2, 3, 4, 5, 6}. Suppose event A is defined as an even-numbered outcome or
A 5 {2, 4, 6}. We then know that the complement of A, Ac, is the set consisting of {1, 3, 5}.
Moreover, we can deduce that P(A) 5 1Нћ2 and P(Ac) 5 1Нћ2, so P(A) 1 P(Ac) 5 1. Rearranging this equation, we obtain the complement rule: P(Ac) 5 1 2 P(A).
LO 4.3
Calculate and
interpret the
probability of the
complement of
an event and the
probability that at
least one of two
events will occur.
T H E CO M P L E M E N T R U L E
The complement rule states that the probability of the complement of an event, P(Ac),
is equal to one minus the probability of the event, that is, P(Ac) 5 1 2 P(A).
The complement rule is quite straightforward and rather simple, but it is widely used and
powerful.
EXAMPLE 4.6
According to the 2010 U.S. Census, 37% of women ages 25 to 34 have earned at
least a college degree as compared with 30% of men in the same age group.
a. What is the probability that a randomly selected woman between the ages of
25 to 34 does not have a college degree?
b. What is the probability that a randomly selected man between the ages of 25 to
34 does not have a college degree?
SOLUTION:
a. Let’s define A as the event that a randomly selected woman between the ages
of 25 and 34 has a college degree; thus P(A) 5 0.37. In this problem we are
interested in the complement of A. So P(Ac) 5 1 2 P(A) 5 1 2 0.37 5 0.63.
b. Similarly, we define B as the event that a randomly selected man between the ages
of 25 to 34 has a college degree, so P(B) 5 0.30. Thus, P(Bc) 5 1 2 P(B) 5
1 2 0.30 5 0.70.
4.2
jag20549_ch04_100-137.indd 109
Rules of Probability
109
23/11/12 5:20 PM
The Addition Rule
The addition rule allows us to find the probability of the union of two events. Suppose
we want to find the probability that either A occurs or B occurs, so in probability terms,
P(A в€Є B). We reproduce the Venn diagram, used earlier in Figure 4.1, to help in exposition.
Figure 4.4 shows a sample space S with the two events A and B. Recall that the union,
A ∪ B, is the portion in the Venn diagram that is included in either A or B . The intersection, A ∩ B, is the portion in the Venn diagram that is included in both A and B.
FIGURE 4.4 Finding the probability of the union, P(A в€Є B)
A
B
S
Aв€ЄB
If we try to obtain P(A в€Є B) by simply summing P(A) with P(B), then we overstate
the probability because we double-count the probability of the intersection of A and B,
P(A ∩ B). When implementing the addition rule, we sum P(A) and P(B) and then subtract
P(A ∩ B) from this sum.
THE ADDITION RULE
The addition rule states that the probability that A or B occurs, or that at least one
of these events occurs, is equal to the probability that A occurs, plus the probability
that B occurs, minus the probability that both A and B occur, or equivalently,
P(A ∪ B) 5 P(A) 1 P(B) 2 P(A ∩ B).
EXAMPLE 4.7
Anthony feels that he has a 75% chance of getting an A in Statistics and a 55%
chance of getting an A in Managerial Economics. He also believes he has a
40% chance of getting an A in both classes.
a. What is the probability that he gets an A in at least one of these courses?
b. What is the probability that he does not get an A in either of these courses?
SOLUTION:
a. Let P(AS) correspond to the probability of getting an A in Statistics and P(AM)
correspond to the probability of getting an A in Managerial Economics. Thus,
P(AS) 5 0.75 and P(AM) 5 0.55. In addition, there is a 40% chance that Anthony
gets an A in both classes, that is, P(AS ∩ AM) 5 0.40. In order to find the probability that he receives an A in at least one of these courses, we calculate:
P(AS ∪ AM) 5 P(AS) 1 P(AM) 2 P(AS ∩ AM) 5 0.75 1 0.55 2 0.40 5 0.90.
b. The probability that he does not receive an A in either of these two courses is
actually the complement of the union of the two events, that is, P((AS в€Є AM)c).
We calculated the union in part a, so using the complement rule we have
P((AS в€Є AM)c) 5 1 2 P(AS в€Є AM) 5 1 2 0.90 5 0.10.
110
E S S E N T I A L S O F B U S I N E S S S TAT I S T I C S
jag20549_ch04_100-137.indd 110
CHAPTER 4
Introduction to Probability
23/11/12 5:20 PM
An alternative expression that correctly captures the required probability is
P((AS ∪ AM)c) 5 P(AcS ∩ AcM). A common mistake is to calculate the probability
as P((AS ∩ AM)c) 5 1 2 P(AS ∩ AM) 5 1 2 0.40 5 0.60, which simply indicates
that there is a 60% chance that Anthony will not get an A in both courses. This is
clearly not the required probability that Anthony does not get an A in either course.
The Addition Rule for Mutually Exclusive Events
As mentioned earlier, mutually exclusive events do not share any outcome of an experiment. Figure 4.5 shows the Venn diagram for two mutually exclusive events; note that the
circles do not intersect.
FIGURE 4.5 Mutually exclusive events
A
B
S
For mutually exclusive events A and B, the probability of their intersection is zero, that is,
P(A ∩ B) 5 0. We need not concern ourselves with double-counting, and, therefore, the
probability of the union is simply the sum of the two probabilities.
T H E A D D I T I O N R U L E F O R M U T UA L LY E XC LU S I V E E V E N T S
If A and B are mutually exclusive events, then P(A ∩ B) 5 0 and, therefore, the
addition rule simplifies to P(A в€Є B) 5 P(A) 1 P(B).
EXAMPLE 4.8
Samantha Greene, a college senior, contemplates her future immediately after graduation. She thinks there is a 25% chance that she will join the Peace Corps and teach
English in Madagascar for the next few years. Alternatively, she believes there is a
35% chance that she will enroll in a full-time law school program in the United States.
a. What is the probability that she joins the Peace Corps or enrolls in law school?
b. What is the probability that she does not choose either of these options?
SOLUTION:
a. We can write the probability that Samantha joins the Peace Corps as P(A) 5 0.25
and the probability that she enrolls in law school as P(B) 5 0.35. Immediately after
college, Samantha cannot choose both of these options. This implies that these
events are mutually exclusive, so P(A ∩ B) 5 0. Thus, when solving for the probability that Samantha joins the Peace Corps or enrolls in law school, P(A ∪ B), we
can simply sum P(A) and P(B): P(A в€Є B) 5 P(A) 1 P(B) 5 0.25 1 0.35 5 0.60.
b. In order to find the probability that she does not choose either of these options,
we need to recognize that this probability is the complement of the union of the
two events, that is, P((A в€Є B)c). Therefore, using the complement rule, we have
P((A в€Є B)c) 5 1 2 P(A в€Є B) 5 1 2 0.60 5 0.40.
4.2
jag20549_ch04_100-137.indd 111
Rules of Probability
111
23/11/12 5:20 PM
LO 4.4
Calculate and
interpret a
conditional
probability
and apply the
multiplication
rule.
Conditional Probability
In business applications, the probability of interest is often a conditional probability. Examples include the probability that the housing market will improve conditional on the
Federal Reserve taking remedial actions; the probability of making a six-figure salary
conditional on getting an MBA; the probability that a company’s stock price will go up
conditional on higher-than-expected profits; the probability that sales will improve conditional on the firm launching a new innovative product.
Let’s use an example to illustrate the concept of conditional probability. Suppose
the probability that a recent business college graduate finds a suitable job is 0.80.
The probability of finding a suitable job is 0.90 if the recent business college graduate has prior work experience. This type of probability is called a conditional probability, where the probability of an event is conditional on the occurrence of another
event. If A represents “finding a job” and B represents “prior work experience,”
then P(A) 5 0.80 and the conditional probability is denoted as P(A | B) 5 0.90.
The vertical mark | means “given that” and the conditional probability is typically
read as “the probability of A given B.” In the above example, the probability of
finding a suitable job increases from 0.80 to 0.90 when conditioned on prior work
experience. In general, the conditional probability, P(A | B), is greater than the
unconditional probability, P(A), if B exerts a positive influence on A. Similarly,
P(A | B) is less than P(A) when B exerts a negative influence on A. Finally, if B exerts
no influence on A, then P(A | B) equals P(A).
As we will see later, it is important that we write the event that has already occurred
after the vertical mark, since in most instances P(A | B) Гћ P(B | A). In the above example
P(B | A) would represent the probability of prior work experience conditional on having
found a job.
We again rely on the Venn diagram in Figure 4.6 to explain the conditional probability.
FIGURE 4.6 Finding the conditional probability, P(A | B)
A
B
S
Since P(A | B) represents the probability of A conditional on B (B has occurred), the
original sample space S reduces to B. The conditional probability P(A | B) is based on the
portion of A that is included in B. It is derived as the ratio of the probability of the intersection of A and B to the probability of B.
C A LC U L AT I N G A CO N D I T I O N A L P R O B A B I L I T Y
Given two events A and B, each with a positive probability of occurring, the probability that A occurs given that B has occurred (A conditioned on B) is equal to
P(A ∩ B)
. Similarly, the probability that B occurs given that A has occurred
P(A | B) 5 ______
P(B)
P(A ∩ B)
(B conditioned on A) is equal to P(B | A) 5 _______
.
P(A)
112
E S S E N T I A L S O F B U S I N E S S S TAT I S T I C S
jag20549_ch04_100-137.indd 112
CHAPTER 4
Introduction to Probability
23/11/12 5:20 PM
EXAMPLE 4.9
Economic globalization is defined as the integration of national economies into the
international economy through trade, foreign direct investment, capital flows, migration, and the spread of technology. Although globalization is generally viewed
favorably, it also increases the vulnerability of a country to economic conditions of
the other country. An economist predicts a 60% chance that country A will perform
poorly and a 25% chance that country B will perform poorly. There is also a 16%
chance that both countries will perform poorly.
a. What is the probability that country A performs poorly given that country B
performs poorly?
b. What is the probability that country B performs poorly given that country A
performs poorly?
c. Interpret your findings.
SOLUTION: We first write down the available information in probability terms.
Defining A as “country A performing poorly” and B as “country B performing poorly,”
we have the following information: P(A) 5 0.60, P(B) 5 0.25, and P(A ∩ B) 5 0.16.
P(A ∩ B)
0.16 5 0.64.
a. P(A | B) 5 ________ 5 ____
P(B)
0.25
P(A ∩ B)
0.16 5 0.27.
b. P(B | A) 5 ________ 5 ____
P(A)
0.60
c. It appears that globalization has definitely made these countries vulnerable
to the economic woes of the other country. The probability that country A
performs poorly increases from 60% to 64% when country B has performed
poorly. Similarly, the probability that country B performs poorly increases
from 25% to 27% when conditioned on country A performing poorly.
Independent and Dependent Events
Of particular interest to researchers is whether or not two events influence one another.
Two events are independent if the occurrence of one event does not affect the probability
of the occurrence of the other event. Let’s revisit the earlier example where the probability
of finding a job is 0.80 and the probability of finding a job given prior work experience is
0.90. Prior work experience exerts a positive influence on finding a job because the conditional probability, P(A | B) 5 0.90, exceeds the unconditional probability, P(A) 5 0.80.
Now consider the probability of finding a job given that your neighbor has bought a red
car. Obviously, your neighbor’s decision to buy a red car has no influence on your probability of finding a job, which remains at 0.80.
Events are considered dependent if the occurrence of one is related to the probability of the occurrence of the other. We generally test for the independence of two
events by comparing the conditional probability of one event, for instance P(A | B), to
its unconditional probability, P(A). If these two probabilities are the same, we say that
the two events, A and B, are independent; if the probabilities differ, the two events are
dependent.
LO 4.5
Distinguish
between
independent
and
dependent
events.
INDEPENDENT VERSUS DEPENDENT EVENTS
Two events, A and B, are independent if P(A | B) 5 P(A) or, equivalently, P(B | A)
5 P(B). Otherwise, the events are dependent.
4.2
jag20549_ch04_100-137.indd 113
Rules of Probability
113
23/11/12 5:20 PM
EXAMPLE 4.10
Suppose that for a given year there is a 2% chance that your desktop computer will
crash and a 6% chance that your laptop computer will crash. Moreover, there is a
0.12% chance that both computers will crash. Is the reliability of the two computers
independent of each other?
SOLUTION: Let event D represent the outcome that your desktop crashes and event L
represent the outcome that your laptop crashes. Therefore, P(D) 5 0.02, P(L) 5 0.06,
and P(D ∩ L) 5 0.0012. The reliability of the two computers is independent because
P(D ∩ L)
0.0012 5 0.02 5 P(D).
P(D | L) 5 ________ 5 ______
P(L)
0.06
In other words, if your laptop crashes, it does not alter the probability that your
desktop also crashes. Equivalently,
P(D ∩ L)
0.0012 5 0.06 5 P(L).
P(L | D) 5 ________ 5 ______
P(D)
0.02
The Multiplication Rule
In some situations, we are interested in finding the probability that two events, A and
B, both occur, that is, P(A ∩ B). In order to obtain this probability, we can rearrange
the formula for conditional probability to derive P(A ∩ B). For instance, from P(A | B) 5
P(A ∩ B)
______
, we can easily derive P(A ∩ B) 5 P(A | B)P(B). Similarly, from P(B | A) 5
P(B)
P(A ∩ B)
______
, we derive P(A ∩ B) 5 P(B | A)P(A). Since we calculate the product of two probP(A)
abilities to find P(A ∩ B), we refer to it as the multiplication rule for probabilities.
T H E M U LT I P L I C AT I O N R U L E
The multiplication rule states that the probability that A and B both occur is equal
to the probability that A occurs given that B has occurred times the probability that
B occurs, that is, P(A ∩ B) 5 P(A | B)P(B). Equivalently, we can also arrive at this
probability as P(A ∩ B) 5 P(B | A)P(A).
EXAMPLE 4.11
A stockbroker knows from past experience that the probability that a client owns
stocks is 0.60 and the probability that a client owns bonds is 0.50. The probability
that the client owns bonds if he/she already owns stocks is 0.55.
a. What is the probability that the client owns both of these securities?
b. Given that the client owns bonds, what is the probability that the client owns stocks?
SOLUTION:
a. Let A correspond to the event that a client owns stocks and B correspond to the
event that a client owns bonds. Thus, the unconditional probabilities that the client owns stocks and that the client owns bonds are P(A) 5 0.60 and P(B) 5 0.50,
respectively. The conditional probability that the client owns bonds given that
he/she owns stocks is P(B | A) 5 0.55. We calculate the probability that the client
owns both of these securities as P(A ∩ B) 5 P(B | A)P(A) 5 0.55 3 0.60 5 0.33.
b. We need to calculate the conditional probability that the client owns stocks given
that he/she owns bonds, or P(A | B). Using the formula for conditional probability
P(A ∩ B)
0.33
5 ___
5 0.66.
and the answer from part a, we find P(A | B) 5 _______
P(B)
0.50
114
E S S E N T I A L S O F B U S I N E S S S TAT I S T I C S
jag20549_ch04_100-137.indd 114
CHAPTER 4
Introduction to Probability
23/11/12 5:20 PM
The Multiplication Rule for Independent Events
We know that two events, A and B, are independent if P(A | B) 5 P(A). With independent
events, the multiplication rule P(A ∩ B) 5 P(A | B)P(B) simplifies to P(A ∩ B) 5 P(A)
P(B). We can use this rule to determine whether or not two events are independent.
That is, two events are independent if the probability P(A ∩ B) equals the product of their unconditional probabilities, P(A)P(B). In Example 4.10, we were given
the probabilities P(D) 5 0.02, P(L) 5 0.06, and P(D ∩ L) 5 0.0012. Consistent with
the earlier result, events D and L are independent because P(D ∩ L) 5 0.0012 equals
P(D)P(L) 5 0.02 3 0.06 5 0.0012.
T H E M U LT I P L I C AT I O N R U L E F O R I N D E P E N D E N T E V E N T S
The multiplication rule for independent events states that the probability ofВ A
and B equals the product of the unconditional probabilities of A and B, that is,
P(A ∩ B) 5 P(A)P(B).
EXAMPLE 4.12
The probability of passing the Level 1 CFA (Chartered Financial Analyst) exam is
0.50 for John Campbell and 0.80 for Linda Lee. The prospect of John’s passing the
exam is completely unrelated to Linda’s success on the exam.
a. What is the probability that both John and Linda pass the exam?
b. What is the probability that at least one of them passes the exam?
SOLUTION:
We can write the unconditional probabilities that John passes the exam and that
Linda passes the exam as P(J) 5 0.50 and P(L) 5 0.80, respectively.
a. Since we are told that John’s chances of passing the exam are not influenced by
Linda’s success at the exam, we can conclude that these events are independent,
so P(J) 5 P(J | L) 5 0.50 and P(L) 5 P(L | J) 5 0.80. Thus, when solving for the
probability that both John and Linda pass the exam, we calculate the product of
the unconditional probabilities, so P(J ∩ L) 5 P(J) 3 P(L) 5 0.50 3 0.80 5 0.40.
b. We calculate the probability that at least one of them passes the exam as:
P(J ∪ L) 5 P(J) 1 P(L) 2 P(J ∩ L) 5 0.50 1 0.80 2 0.40 5 0.90.
EXERCISES 4.2
Mechanics
13. Let P(A) 5 0.65, P(B) 5 0.30, and P(A | B) 5 0.45.
a. Calculate P(A ∩ B).
b. Calculate P(A в€Є B).
c. Calculate P(B | A).
14. Let P(A) 5 0.55, P(B) 5 0.30, and P(A ∩ B) 5 0.10.
a. Calculate P(A | B).
b. Calculate P(A в€Є B).
c. Calculate P((A в€Є B)c).
15. Let A and B be mutually exclusive with P(A) 5 0.25 and
P(B) 5 0.30.
a. Calculate P(A ∩ B).
b. Calculate P(A в€Є B).
c. Calculate P(A | B).
16. Let A and B be independent with P(A) 5 0.40 and
P(B) 5 0.50.
a. Calculate P(A ∩ B).
b. Calculate P((A в€Є B)c).
c. Calculate P(A | B).
17. Let P(A) 5 0.65, P(B) 5 0.30, and P(A | B) 5 0.45.
a. Are A and B independent events? Explain.
b. Are A and B mutually exclusive events? Explain.
c. What is the probability that neither A nor B takes
place?
18. Let P(A) 5 0.15, P(B) 5 0.10, and P(A ∩ B)5 0.05.
a. Are A and B independent events? Explain.
b. Are A and B mutually exclusive events? Explain.
c. What is the probability that neither A nor B takes place?
4.2
jag20549_ch04_100-137.indd 115
Rules of Probability
115
23/11/12 5:20 PM
19. Consider the following probabilities: P(A) 5 0.25,
P(Bc) 5 0.40, and P(A ∩ B) 5 0.08. Find:
a. P(B)
b. P(A | B)
c. P(B | A)
20. Consider the following probabilities: P(Ac) 5 0.30,
P(B) 5 0.60, and P(A ∩ Bc) 5 0.24. Find:
a. P(A | Bc)
b. P(Bc | A)
c. Are A and B independent events? Explain.
21. Consider the following probabilities: P(A) 5 0.40,
P(B) 5 0.50, and P(Ac ∩ Bc) 5 0.24. Find:
a. P(Ac | Bc)
b. P(Ac в€Є Bc)
c. P(A в€Є B)
Applications
22. Survey data, based on 65,000 mobile phone subscribers, shows
that 44% of the subscribers use smartphones (Forbes, DecemberВ 15, 2011). Moreover, 51% of smartphone users are women.
a. Find the probability that a mobile phone subscriber is a
woman who uses a smartphone.
b. Find the probability that a mobile phone subscriber is a
man who uses a smartphone.
23. Twenty percent of students in a college ever go to their
professor during office hours. Of those who go, 30% seek
minor clarification and 70% seek major clarification.
a. What is the probability that a student goes to the
professor during her office hours for a minor clarification?
b. What is the probability that a student goes to the
professor during her office hours for a major clarification?
24. The probabilities that stock A will rise in price is 0.40 and
that stock B will rise in price is 0.60. Further, if stock B rises in
price, the probability that stock A will also rise in price is 0.80.
a. What is the probability that at least one of the stocks will
rise in price?
b. Are events A and B mutually exclusive? Explain.
c. Are events A and B independent? Explain.
25. Despite government bailouts and stimulus money,
unemployment in the United States had not decreased
significantly as economists had expected (US News and World
Report, July 2, 2010). Many analysts predicted only an 18%
chance of a reduction in U.S. unemployment. However, if
Europe slipped back into a recession, the probability of a
reduction in U.S. unemployment would drop to 0.06.
a. What is the probability that there is not a reduction in
U.S. unemployment?
b. Assume there is an 8% chance that Europe slips back
into a recession. What is the probability that there is not
a reduction in U.S. unemployment and that Europe slips
into a recession?
26. Dr. Miriam Johnson has been teaching accounting for over
20 years. From her experience she knows that 60% of her
116
E S S E N T I A L S O F B U S I N E S S S TAT I S T I C S
jag20549_ch04_100-137.indd 116
CHAPTER 4
students do homework regularly. Moreover, 95% of the students
who do their homework regularly generally pass the course. She
also knows that 85% of her students pass the course.
a. What is the probability that a student will do homework
regularly and also pass the course?
b. What is the probability that a student will neither do
homework regularly nor will pass the course?
c. Are the events “pass the course” and “do homework
regularly” mutually exclusive? Explain.
d. Are the events “pass the course” and “do homework
regularly” independent? Explain.
27. Records show that 5% of all college students are foreign
students who also smoke. It is also known that 50% of
all foreign college students smoke. What percent of the
students at this university are foreign?
28. An analyst estimates that the probability of default on a sevenyear AA-rated bond is 0.06, while that on a seven-year A-rated
bond is 0.13. The probability that they will both default is 0.04.
a. What is the probability that at least one of the bonds
defaults?
b. What is the probability that neither the seven-year AA-rated
bond nor the seven-year A-rated bond defaults?
c. Given that the seven-year AA-rated bond defaults, what
is the probability that the seven-year A-rated bond also
defaults?
29. In general, shopping online is supposed to be more
convenient than going to stores. However, according
to a recent Harris Interactive poll, 87% of people have
experienced problems with an online transaction (The Wall
Street Journal, October 2, 2007). Forty-two percent of people
who experienced a problem abandoned the transaction or
switched to a competitor’s website. Fifty-three percent of
people who experienced problems contacted customerservice representatives.
a. What percentage of people did not experience problems
with an online transaction?
b. What percentage of people experienced problems with
an online transaction and abandoned the transaction or
switched to a competitor’s website?
c. What percentage of people experienced problems with
an online transaction and contacted customer-service
representatives?
30. Mike Danes has been delayed in going to the annual sales event
at one of his favorite apparel stores. His friend has just texted
him that there are only 20 shirts left, of which 8 are in size M,
10 in size L, and 2 in size XL. Also 3 of the shirts are white, 5 are
blue, and the remaining are of mixed colors. Mike is interested
in getting a white or a blue shirt in size L. Define the events A =
Getting a white or a blue shirt and B = Getting a shirt in size L.
a. Find P(A), P(Ac) , and P(B).
b. Are the events A and B mutually exclusive and
exhaustive? Explain.
c. Would you describe Mike’s preference by the events A∪B
or A∩B?
Introduction to Probability
23/11/12 5:20 PM
31. A manufacturing firm just received a shipment of 20 assembly
parts, of slightly varied sizes, from a vendor. The manager
knows that there are only 15 parts in the shipment that would
be suitable. He examines these parts one at a time.
a. Find the probability that the first part is suitable.
b. If the first part is suitable, find the probability that the
second part is also suitable.
c. If the first part is suitable, find the probability that the
second part is not suitable.
32. Despite the repeated effort by the government to reform
how Wall Street pays its executives, some of the nation’s
biggest banks are continuing to pay out bonuses nearly
as large as those in the best years before the crisis (The
Washington Post, January 15, 2010). It is known that 10 out
of 15 members of the board of directors of a company were
in favor of the bonus. Suppose two members were randomly
selected by the media.
a. What is the probability that both of them were in favor
of the bonus?
b. What is the probability that neither of them was in favor
of the bonus?
33. Apple products have become a household name in America
with 51 percent of all households owning at least one Apple
product (CNN, March 19, 2012). The likelihood of owning an
Apple product is 61 percent for households with kids and
48В percent for households without kids. Suppose there are
1,200 households in a representative community of which
820 are with kids and the rest are without kids.
a. Are the events “household with kids” and “household
without kids” mutually exclusive and exhaustive? Explain.
b. What is the probability that a household is without kids?
c. What is the probability that a household is with kids and
owns an Apple product?
d. What is the probability that a household is without kids
and does not own an Apple product?
34. According to the Census’s Population Survey, the percentage
of children with two parents at home is the highest for Asians
and lowest for blacks (USA TODAY, February 26, 2009). It is
reported that 85% of Asian, 78% of white, 70%В of Hispanic,
and 38% of black children have two parents at home. Suppose
there are 500 students in a representative school of which 280
are white, 50 are Asian, 100 are Hispanic, and 70 are black.
a. Are the events “Asians” and “black” mutually exclusive
and exhaustive? Explain.
b. What is the probability that a given child is not white?
c. What is the probability that a child is white and has both
parents at home?
d. What is the probability that a child is Asian and does not
have both parents at home?
35. Christine Wong has asked Dave and Mike to help her move
into a new apartment on Sunday morning. She has asked
them both in case one of them does not show up. From past
experience, Christine knows that there is a 40% chance that
Dave will not show up and a 30% chance that Mike will not
show up. Dave and Mike do not know each other and their
decisions can be assumed to be independent.
a. What is the probability that both Dave and Mike will
show up?
b. What is the probability that at least one of them will
show up?
c. What is the probability that neither Dave nor Mike will
show up?
36. According to a recent survey by two United Nations agencies
and a nongovernmental organization, two in every three
women in the Indian capital of New Delhi are likely to face
some form of sexual harassment in a year (BBC World News,
July 9, 2010). The study also reports that women who use
public transportation are especially vulnerable. Suppose the
corresponding probability of harassment for women who
use public transportation is 0.82. It is also known that 28% of
women use public transportation.
a. What is the probability that a woman takes public
transportation and also faces sexual harassment?
b. If a woman is sexually harassed, what is the probability
that she had taken public transportation?
37. Since the fall of 2008, millions of Americans have lost jobs
due to the economic meltdown. A recent study shows that
unemployment has not impacted white-collar and bluecollar workers equally (Newsweek, April 20, 2009). According
to the Bureau of Labor Statistics report, while the national
unemployment rate is 8.5%, it is only 4.3% for those with a
college degree. It is fair to assume that 27% of people in the
labor force are college educated. You have just heard that
another worker in a large firm has been laid off. What is the
probability that the worker is college educated?
38. A recent study challenges the media narrative that
foreclosures are dangerously widespread (New York
Times, March 2, 2009). According to this study, 62% of all
foreclosures were centered in only four states, namely,
Arizona, California, Florida, and Nevada. The national average
rate of foreclosures in 2008 was 0.79%. What percent of the
homes in the United States were foreclosed in 2008 and also
centered in Arizona, California, Florida, or Nevada?
39. According to results from the Spine Patient Outcomes
Research Trial, or SPORT, surgery for a painful, common
back condition resulted in significantly reduced back pain
and better physical function than treatment with drugs and
physical therapy (The Wall Street Journal, February 21, 2008).
SPORT followed 803 patients, of whom 398 ended up getting
surgery. After two years, of those who had surgery, 63% said
they had a major improvement in their condition, compared
with 29% among those who received nonsurgical treatment.
a. What is the probability that a patient had surgery? What
is the probability that a patient did not have surgery?
b. What is the probability that a patient had surgery and
experienced a major improvement in his or her condition?
c. What is the probability that a patient received
nonsurgical treatment and experienced a major
improvement in his or her condition?
4.2
jag20549_ch04_100-137.indd 117
Rules of Probability
117
23/11/12 5:20 PM
4.3 Contingency Tables and Probabilities
LO 4.6
Calculate
and interpret
probabilities
from a
contingency
table.
We learned in Chapter 2 that, when organizing qualitative data, it is often useful to construct a frequency distribution. A frequency distribution is a useful tool when we want to
sort one variable at a time. However, in many instances we want to examine or compare
two qualitative variables. On these occasions, a contingency table proves very useful.
Contingency tables are widely used in marketing and biomedical research, as well as in
the social sciences.
A CO N T I N G E N C Y TA B L E
A contingency table generally shows frequencies for two qualitative (categorical)
variables, x and y, where each cell represents a mutually exclusive combination of
the pair of x and y values.
Table 4.4, first presented in the introductory case study of this chapter, is an example of a
contingency table where the qualitative variables of interest, x and y, are Age Group and
Brand Name, respectively. Age Group has two possible categories: (1) under 35 years and
(2) 35 years and older; Brand Name, has three possible categories: (1) Under Armour,
(2) Nike, and (3) Adidas.
TABLE 4.4 Purchases of Compression Garments Based on Age and Brand Name
Brand Name
Age Group
Under Armour
Nike
Adidas
174
132
90
54
72
78
Under 35 years
35 years and older
Each cell in Table 4.4 represents a frequency; for example, there are 174 customers under
the age of 35 who purchase an Under Armour product, whereas there are 54В customers
at least 35 years old who purchase an Under Armour product. Recall that we estimate
anВ empirical probability by calculating the relative frequency of the occurrence of the
event. To make calculating these probabilities less cumbersome, it is often useful to
denote each event with letter notation and calculate totals for each column and row as
shown in Table 4.4a.
TABLE 4.4a A Contingency Table Labeled Using Event Notation
Brand Name
B1
B2
B3
Total
A
174
132
90
396
Ac
54
72
78
204
Total
228
204
168
600
Age Group
Thus, let events A and Ac correspond to “under 35 years” and “35 years and older,”
respectively; similarly, let events B1, B2, and B3 correspond to “Under Armour,” “Nike,”
and “Adidas,” respectively. In addition, after calculating row totals, it is now easier to
recognize that 396 of the customers are under 35 years old and 204 of the customers are
atВ least 35 years old. Similarly, column totals indicate that 228 customers purchase Under
Armour, 204 purchase Nike, and 168 purchase Adidas. Finally, the frequency corresponding to the cell in the last column and the last row is 600. This value represents the
sample size, that is, the total number of customers in the sample. We arrive at this value
by either summing the values in the last column (396 1 204) or summing the values in
the last row (228 1 204 1 168).
The following example illustrates how to calculate probabilities when the data are
presented in the form of a contingency table.
118
E S S E N T I A L S O F B U S I N E S S S TAT I S T I C S
jag20549_ch04_100-137.indd 118
CHAPTER 4
Introduction to Probability
23/11/12 5:20 PM
EXAMPLE 4.13
Using the information in Table 4.4a, answer the following questions.
a. What is the probability that a randomly selected customer is younger than
35В years old?
b. What is the probability that a randomly selected customer purchases an Under
Armour garment?
c. What is the probability that a customer is younger than 35 years old and purchases an Under Armour garment?
d. What is the probability that a customer is either younger than 35 years old or
purchases an Under Armour garment?
e. What is the probability that a customer is under 35 years of age, given that the
customer purchases an Under Armour garment?
SOLUTION:
396
a. P(A) 5 ___
5 0.66; there is a 66% chance that a randomly selected customer is
600
less than 35 years old.
228
b. P(B1) 5 ___
5 0.38; there is a 38% chance that a randomly selected customer
600
purchases an Under Armour garment.
174
c. P(A ∩ B1) 5 ___
5 0.29; there is a 29% chance that a randomly selected cus600
tomer is younger than 35 years old and purchases an Under Armour garment.
174 1 132 1 90 1 54
450
d. P(A в€Є B1) 5 _______________
5 ___
5 0.75; there is a 75% chance that a
600
600
randomly selected customer is either younger than 35 years old or purchases an
Under Armour garment. Alternatively, we can use the addition rule to solve this
problem as P(A ∪ B1) 5 P(A) 1 P(B1) 2 P(A ∩ B1) 5 0.66 1 0.38 2 0.29 5 0.75.
e. We wish to calculate the conditional probability, P(A | B1). When the information
is in the form of a contingency table, calculating a conditional probability is rather
straightforward. We are given the information that the customer purchases an
Under Armour garment, so the sample space shrinks from 600 customers to 228
customers. We can ignore all customers that make Nike or Adidas purchases,
or all outcomes in events B2 and B3. Thus, of the 228 customers who make an
Under Armour purchase, 174 of them are under 35 years of age. Therefore, the
probability that a customer is under 35 years of age given that the customer
174
5 0.76.
makes an Under Armour purchase is calculated as P(A | B1) 5 ___
228
Alternatively, we can use the conditional probability formula to solve the probP(A ∩ B )
1
174/600
174
lem as P(A | B1) 5 _______
5 ______
5 ___
5 0.76.
P(B )
228/600
228
1
Arguably, a more convenient way of calculating relevant probabilities is to convert the
contingency table to a joint probability table. The frequency in each cell is divided by
the number of outcomes in the sample space, which in this example is 600 customers.
Table 4.4b shows the results.
TABLE 4.4b Converting a Contingency Table to a Joint Probability Table
Brand Name
B1
B2
B3
Total
A
0.29
0.22
0.15
0.66
c
A
0.09
0.12
0.13
0.34
Total
0.38
0.34
0.28
1.00
Age Group
4.3
jag20549_ch04_100-137.indd 119
Contingency Tables and Probabilities
119
23/11/12 5:20 PM
The values in the interior of the table represent the probabilities of the intersection
of two events, also referred to as joint probabilities. For instance, the probability
that a randomly selected person is under 35 years of age and makes an Under Armour
purchase, denoted P(A ∩ B1), is 0.29. Similarly, we can readily read from this table
that 12% of the customers purchase a Nike garment and are at least 35 years old, or
P(Ac ∩ B2) 5 0.12.
The values in the margins of Table 4.4b represent unconditional probabilities. These
probabilities are also referred to as marginal probabilities. For example, the probability
that a randomly selected customer is under 35 years of age, P(A), is simply 0.66. Also, the
probability of purchasing a Nike garment, P(B2), is 0.34.
Note that the conditional probability is basically the ratio of a joint probability to an
P(A ∩ B )
1
unconditional probability. Since P(A | B1) 5 _______
, the numerator is the joint probabilP(B )
1
ity, P(A ∩ B1), and the denominator is the unconditional probability, P(B1). Let’s refer
back to the probability that we calculated earlier; that is, the probability that a customer is
under 35 years of age, given that the customer purchases an Under Armour product. This
P(A ∩ B1) ____
5 0.29 5 0.76.
conditional probability is easily computed as P(A | B1) 5 ________
P(B1)
0.38
EXAMPLE 4.14
Given the information in Table 4.4b, what is the probability that a customer purchases an Under Armour product, given that the customer is under 35 years of age?
SOLUTION: Now we are solving for P(B1 | A). So
P(A ∩ B1) ____
5 0.29 5 0.44.
P(B1 | A) 5 ________
P(A)
0.66
Note that P(B1 | A) 5 0.44 Гћ P(A | B1) 5 0.76.
EXAMPLE 4.15
Determine whether the events “under 35 years old” and “Under Armour” are
independent.
SOLUTION: In order to determine whether two events are independent, we compare
an event’s conditional probability to its unconditional probability; that is, events
A and B are independent if P(A | B) 5 P(A). In the Under Armour example, we have
already found that P(A | B1) 5 0.76. In other words, there is a 76% chance that a
customer is under 35 years old given that the customer purchases an Under Armour
product. We compare this conditional probability to its unconditional probability,
P(A) 5 0.66. Since these probabilities differ, the events “under 35 years old” and
“Under Armour” are not independent events. We could have compared P(B1 | A) to
P(B1) and found that 0.44 Гћ 0.38, which leads us to the same conclusion that the
events are dependent. As discussed in the preceding section, an alternative approach
is to compare the joint probability with the product of the two unconditional
probabilities. Events are independent if P(A ∩ B1) 5 P(A)P(B1). In the above
example, P(A ∩ B1) 5 0.29 does not equal P(A)P(B1) 5 0.66 3 0.38 5 0.25, so the
two events are not independent.
It is important to note that the conclusions about independence, such as the one made
in Example 4.15, are informal since they are based on empirical probabilities computed
from given sample information. In the above example, these probabilities will change if
a different sample of 600 customers is used. Formal tests of independence are discussed
in Chapter 11.
120
E S S E N T I A L S O F B U S I N E S S S TAT I S T I C S
jag20549_ch04_100-137.indd 120
CHAPTER 4
Introduction to Probability
23/11/12 5:20 PM
SYNOPSIS OF INTRODUCTORY CASE
After careful analysis of the contingency table representing customer purchases of compression garments based on age and
brand name, several interesting remarks can be made. From a
sample of 600 customers, it appears that the majority of the customers who purchase these products tend to be younger: 66%
of the customers were younger than 35 years old, whereas 34%
were at least 35 years old. It is true that more customers chose
to purchase Under Armour garments (with 38% of purchases) as
compared to Nike or Adidas garments (with 34% and 28% of purchases, respectively). However, given that Under Armour was the
pioneer in the compression-gear market, this company should be
concerned with the competition posed by Nike and Adidas. Further inspection of the contingency table reveals that if a customer was under 35 years old, the chances of the customer
purchasing an Under Armour garment rises to about 44%. This result indicates that the age
of a customer seems to influence the brand name purchased. In other words, 38% of the
customers choose to buy Under Armour products, but as soon as the attention is confined
to those customers who are under 35 years old, the likelihood of a purchase from Under Armour rises to about 44%. The information that the Under Armour brand appeals to younger
customers is relevant not only for Under Armour and how the firm may focus its advertising efforts, but also to competitors and retailers in the compression garment market.
EXERCISES 4.3
e. Given that B2 has occurred, what is the probability that A
occurs?
f. Given that A has occurred, what is the probability that B4
occurs?
Mechanics
40. Consider the following contingency table.
B
Bc
A
26
34
c
14
26
A
Applications
a. Convert the contingency table into a joint probability
table.
b. What is the probability that A occurs?
c. What is the probability that A and B occur?
d. Given that B has occurred, what is the probability that A
occurs?
e. Given that Ac has occurred, what is the probability that B
occurs?
f. Are A and B mutually exclusive events? Explain.
g. Are A and B independent events? Explain.
41. Consider the following joint probability table.
a.
b.
c.
d.
B1
B2
B3
B4
A
0.09
0.22
0.15
0.20
Ac
0.03
0.10
0.09
0.12
What is the probability that A occurs?
What is the probability that B2 occurs?
What is the probability that Ac and B4 occur?
What is the probability that A or B3 occurs?
42. According to an online survey by Harris Interactive for job
site CareerBuilder.com, more than half of IT (information
technology) workers say they have fallen asleep at work
(InformationWeek, September 27, 2007). Sixty-four percent
of government workers admitted to falling asleep on
the job. Consider the following contingency table that is
representative of the survey results.
Job Category
IT
Professional
Government
Professional
Yes
155
256
No
145
144
Slept on the Job?
a. Convert the contingency table into a joint probability table.
b. What is the probability that a randomly selected worker
is an IT professional?
c. What is the probability that a randomly selected worker
slept on the job?
d. If a randomly selected worker slept on the job, what is
the probability that he/she is an IT professional?
4.3
jag20549_ch04_100-137.indd 121
Contingency Tables and Probabilities
121
23/11/12 5:20 PM
e. If a randomly selected worker is a government professional,
what is the probability that he/she slept onВ the job?
f. Are the events “IT Professional” and “Slept on the Job”
independent? Explain using probabilities.
43. A recent poll asked 16- to 21-year-olds whether or not they
are likely to serve in the U.S. military. The following table,
cross-classified by gender and race, reports the percentage
of those polled who responded that they are likely or very
likely to serve in the active-duty military.
Race
Gender
Hispanic
Black
White
Male
33.5%
20.5%
16.5%
Female
14.5%
10.5%
4.5%
SOURCE: Defense Human Resources Activity telephone poll of 3,228 Americans
conducted October through December 2005.
a. What is the probability that a randomly selected
respondent is female?
b. What is the probability that a randomly selected
respondent is Hispanic?
c. Given that a respondent is female, what is the probability
that she is Hispanic?
d. Given that a respondent is white, what is the probability
that the respondent is male?
e. Are the events “Male” and “White” independent? Explain
using probabilities.
44. A recent report suggests that business majors spend the least
amount of time on course work than all other college students
(The New York Times, November 17, 2011). A provost of a
university decides to conduct a survey where students are asked
if they study hard, defined by spending at least 20В hours per
week on course work. Of 120 business majors included in the
survey, 20 said that they studied hard as compared to 48 out
of 150 nonbusiness majors who said thatВ they studied hard.
a. Construct a contingency table that shows the
frequencies for the qualitative variables Major (business
or nonbusiness) and Study Hard (yes or no).
b. Find the probability that a business major spends less
than 20 hours per week on course work.
c. What is the probability that a student studies hard?
d. If a student spends at least 20 hours on course work,
what is the probability that he/she is a business major?
What is the corresponding probability that he/she is a
nonbusiness major?
45. According to a Michigan State University researcher,
Americans are becoming increasingly polarized on issues
pertaining to the environment. (http://news.msu.edu, April
19, 2011). It is reported that 70% of Democrats see signs of
global warming as compared to only 29% of Republicans
who feel the same. Suppose the survey was based on
400В Democrats and 400 Republicans.
a. Construct a contingency table that shows frequencies for
the qualitative variables Political Affiliation (Democrat or
Republican) and Global Warming (yes or no).
122
E S S E N T I A L S O F B U S I N E S S S TAT I S T I C S
jag20549_ch04_100-137.indd 122
CHAPTER 4
b. Find the probability that a Republican sees signs of
global warming.
c. Find the probability that a person does not see signs of
global warming.
d. If a person sees signs of global warming, what is the
probability that this person is a Democrat?
46. Merck & Co. conducted a study to test the promise of its
experimental AIDS vaccine (The Boston Globe, September 22,
2007). Volunteers in the study were all free of the human
immunodeficiency virus (HIV), which causes AIDS, at the
start of the study, but all were at high risk for getting the
virus. Volunteers were given either the vaccine or a dummy
shot; 24 of 741 volunteers who got the vaccine became
infected with HIV, whereas 21 of 762 volunteers who got the
dummy shot became infected with HIV. The following table
summarizes the results of the study.
Infected
Not Infected
Vaccinated
Dummy Shot
24
21
717
741
a. Convert the contingency table into a joint probability
table.
b. What is the probability that a randomly selected
volunteer got vaccinated?
c. What is the probability that a randomly selected
volunteer became infected with the HIV virus?
d. If the randomly selected volunteer was vaccinated, what
is the probability that he/she got infected?
e. Are the events “Vaccinated” and “Infected” independent?
Explain using probabilities. Given your answer, is it
surprising that Merck & Co. ended enrollment and
vaccination of volunteers in the study? Explain.
47. More and more households are struggling to pay utility
bills given a shaky economy and high heating costs (The
Wall Street Journal, February 14, 2008). Particularly hard
hit are households with homes heated with propane or
heating oil. Many of these households are spending twice
as much to stay warm this winter compared to those
who heat with natural gas or electricity. A representative
sample of 500 households was taken to investigate if the
type of heating influences whether or not a household
is delinquent in paying its utility bill. The following table
reports the results.
Type of Heating
Delinquent
in Payment?
Natural
Gas
Electricity
Heating
Oil
Propane
Yes
50
20
15
10
No
240
130
20
15
a. What is the probability that a randomly selected
household uses heating oil?
b. What is the probability that a randomly selected
household is delinquent in paying its utility bill?
Introduction to Probability
23/11/12 5:20 PM
c. What is the probability that a randomly selected
household uses heating oil and is delinquent in paying
its utility bill?
d. Given that a household uses heating oil, what is the
probability that it is delinquent in paying its utility
bill?
e. Given that a household is delinquent in paying its utility
bill, what is the probability that the household uses
electricity?
f. Are the events “Heating Oil” and “Delinquent in Payment”
independent? Explain using probabilities.
48. The research team at a leading perfume company
is trying to test the market for its newly introduced
perfume. In particular the team wishes to look for gender
and international differences in the preference for this
perfume.В They sample 2,500 people internationally and
each person in the sample is asked to try the new perfume
and list his/her preference. The following table reports
theВ results.
Preference
Like it
Don’t like it
Gender
Men
America
Europe
Asia
210
150
120
Women
370
310
180
Men
290
150
80
Women
330
190
120
a. What is the probability that a randomly selected man
likes the perfume?
b. What is the probability that a randomly selected Asian
likes the perfume?
c. What is the probability that a randomly selected
European woman does not like the perfume?
d. What is the probability that a randomly selected
American man does not like the perfume?
e. Are the events “Men” and “Like Perfume” independent
in (i) America, (ii) Europe, (iii) Asia? Explain using
probabilities.
f. Internationally, are the events “Men” and “Like Perfume”
independent? Explain using probabilities.
4.4 The Total Probability Rule
and Bayes’ Theorem
In this section we present two important rules in probability theory: the total probability
rule and Bayes’ theorem. The total probability rule is a useful tool for breaking the
computation of a probability into distinct cases. Bayes’ theorem uses this rule to update
a probability of an event that has been affected by a new piece of evidence.
LO 4.7
Apply the total
probability rule and
Bayes’ theorem.
The Total Probability Rule
Sometimes the unconditional probability of an event is not readily apparent from the
given information. The total probability rule expresses the unconditional probability of
an event in terms of joint or conditional probabilities. Let P(A) denote the unconditional
probability of an event of interest. We can express P(A) as the sum of probabilities of the
intersections of A with some mutually exclusive and exhaustive events corresponding to
an experiment. For instance, consider event B and its complement Bc. Figure 4.7 shows
the sample space partitioned entirely into these two mutually exclusive and exhaustive
events. The circle, representing event A, consists entirely of its intersections with B and
Bc. According to the total probability rule, P(A) equals the sum of P(A ∩ B) and P(A ∩ Bc).
FIGURE 4.7 The total probability rule: P(A) 5 P(A ∩ B) 1 P(A ∩ Bc)
B
A
Bc
A∩B A∩Bc
4.4
jag20549_ch04_100-137.indd 123
The Total Probability Rule and Bayes’ Theorem
123
23/11/12 5:20 PM
Oftentimes the joint probabilities needed to compute the total probability are not
explicitly specified. Therefore, we use the multiplication rule to derive these probabilities from the conditional probabilities as P(A ∩ B) 5 P(A | B)P(B) and P(A ∩ Bc) 5
P(A | Bc)P(Bc).
T H E TOTA L P R O B A B I L I T Y R U L E CO N D I T I O N A L O N T W O E V E N T S
The total probability rule expresses the unconditional probability of an
event,В A, in terms of probabilities of the intersection of A with any mutually
exclusive and exhaustive events. The total probability rule based on two events,
B andВ Bc, is
P(A) 5 P(A ∩ B) 1 P(A ∩ Bc),
or equivalently,
P(A) 5 P(A | B)P(B) 1 P(A | Bc)P(Bc).
An intuitive way to express the total probability rule is with the help of a probability
tree. Whenever an experiment can be broken down into stages, with a different aspect of
the result observed at each stage, we can use a probability tree to represent the various
possible sequences of observations. We also use an alternative tabular method for computing the unconditional probability P(A). The following example illustrates the mechanics of a probability tree and the tabular method.
EXAMPLE 4.16
Even though a certain statistics professor does not require attendance as part of
a student’s overall grade, she has noticed that those who regularly attend class
have a higher tendency to get a final grade of A. The professor calculates that
there is an 80% chance that a student attends class regularly. Moreover, given
that a student attends class regularly, there is a 35% chance that the student receives an A grade; however, if a student does not attend class regularly, there is
only a 5% chance of an A grade. Use this information to answer the following
questions.
a. What is the probability that a student does not attend class regularly?
b. What is the probability that a student attends class regularly and receives an A
grade?
c. What is the probability that a student does not attend class regularly and receives an A grade?
d. What is the probability that a student receives an A grade?
SOLUTION: We first let A correspond to the event that a student receives an A grade
and RВ correspond to the event that a student attends class regularly. From theВ above
information, we then have the following probabilities: P(R) 5 0.80, P(A | R) 5 0.35,
and P(A | Rc) 5 0.05. Figure 4.8 shows a probability tree that consists of nodes
(junctions) and branches (lines) where the initial node O is called the origin. The
branches emanating from O represent the possible outcomes that may occur at the
first stage. Thus, at stage 1 we have events R and Rc originating from O. These
events become the nodes at the second stage. The sum of the probabilities coming
from any particular node is equal to one.
124
E S S E N T I A L S O F B U S I N E S S S TAT I S T I C S
jag20549_ch04_100-137.indd 124
CHAPTER 4
Introduction to Probability
23/11/12 5:20 PM
FIGURE 4.8 Probability tree for class attendance and
final grade in statistics.
Stage 1 Stage 2
Joint
Event
Probability
A
A∩ R
P(A ∩ R) = 0.28
Ac
Ac ∩ R
P(Ac ∩ R) = 0.52
A
A ∩ Rc
P(A ∩ Rc) = 0.01
Ac
Ac ∩ Rc
P(Ac ∩ Rc) = 0.19
R
O
Rc
a. Using the complement rule, if we know that there is an 80% chance that a stu-
dent attends class regularly, P(R) 5 0.80, then the probability that a student does
not attend class regularly is found as P(Rc) 5 1 2 P(R) 5 1 2 0.80 5 0.20.
In order to arrive at a subsequent stage, and deduce the corresponding probabilities, we use the information obtained from the previous stage. For instance,
given that a student attends class regularly, there is a 35% chance that the student
receives an A grade, that is, P(A | R) 5 0.35. Given that a student regularly attends
class, the likelihood of not receiving an A grade is 65% because P(Ac | R) 5
1 2 P(A | R) 5 0.65. Similarly, given P(A | Rc) 5 0.05, we compute P(Ac | Rc) 5
1 2 P(A | Rc) 5 1 2 0.05 5 0.95. Any path through branches of the tree from the
origin to a terminal node defines the intersection of the earlier two events. Thus,
following the top branches, we arrive at the event A ∩ R, meaning that a student
attends class regularly and receives an A grade. The probability of this event is
the product of the probabilities attached to the branches forming that path; here
we are simply applying the multiplication rule. Now we are prepared to answer
parts b and c.
b. Multiplying the probabilities attached to the top branches we obtain
P(A ∩ R) 5 P(A | R)P(R) 5 0.35 3 0.80 5 0.28; there is a 28% chance
that a student attends class regularly and receives an A grade.
c. In order to find the probability that a student does not attend class regularly
and receives an A grade, we compute P(A ∩ Rc) 5 P(A | Rc)P(Rc) 5
0.05 3 0.20 5 0.01.
d. The unconditional probability that a student receives an A grade, P(A), is not
explicitly given in Example 4.16. However, we can sum the relevant joint probabilities in parts b and c to obtain this unconditional probability:
P(A) 5 P(A ∩ R) 1 P(A ∩ Rc) 5 0.28 1 0.01 5 0.29.
An alternative method uses a tabular representation of probabilities. Table 4.5 contains all
relevant probabilities that are directly or indirectly specified in Example 4.16.
TABLE 4.5 Tabular Method for Computing P(A)
Unconditional Probability
Conditional Probability
P(R) 5 0.80
P(A | R) 5 0.35
P(A ∩ R) 5 P(A | R) P(R) 5 0.28
P(Rc) 5 0.20
P(A | Rc) 5 0.05
P(A ∩ Rc) 5 P(A | Rc) P(Rc) 5 0.01
P(R) 1 P(Rc) 5 1
Joint Probability
P(A) 5 P(A ∩ R) 1 P(A ∩ Rc) 5 0.29
4.4
jag20549_ch04_100-137.indd 125
The Total Probability Rule and Bayes’ Theorem
125
23/11/12 5:20 PM
As we saw earlier, each joint probability is computed as a product of its conditional
probability and the corresponding unconditional probability; that is, P(A ∩ R) 5
P(A | R)P(R) 5 0.35 3 0.80 5 0.28. Similarly, P(A ∩ Rc) 5 P(A | Rc)P(Rc) 5 0.05 3
0.20 5 0.01. Therefore, P(A) 5 P(A ∩ R) 1 P(A ∩ Rc) 5 0.29.
Bayes’ Theorem
The total probability rule is also needed to derive Bayes’ theorem, developed by the Reverend Thomas Bayes (1702–1761). Bayes’ theorem is a procedure for updating probabilities
based on new information. The original probability is an unconditional probability called
a prior probability in the sense that it reflects only what we know now before the arrival
of any new information. On the basis of new information, we update the prior probability
to arrive at a conditional probability called a posterior probability.
Suppose we know that 99% of the individuals who take a lie detector test tell the truth.
Therefore, the prior probability of telling the truth is 0.99. Suppose an individual takes the lie
detector test and the results indicate that the individual lied. Bayes’ theorem updates a prior
probability to compute a posterior probability, which in the above example is essentially a
conditional probability based on the information that the lie detector has detected a lie.
Let P(B) denote the prior probability and P(B | A) the posterior probability. Note that
the posterior probability is conditional on event A, representing new information. Recall
the conditional probability formula from Section 4.2:
P(A ∩ B)
P(B | A) 5 ________.
P(A)
In some instances we may have to evaluate P(B | A), but we do not have explicit information
on P(A ∩ B) or P(A). However, given information on P(B), P(A | B) and P(A | Bc), we can use
the total probability rule and the multiplication rule to find P(B | A) as follows:
P(A | B)P(B)
P(A ∩ B)
P(A ∩ B)
5 ________________________.
P(B | A) 5 ________ 5 __________________
P(A)
P(A ∩ B) 1 P(A ∩ Bc) P(A | B)P(B) 1 P(A | Bc)P(Bc)
B AYE S’ T H E O R E M
The posterior probability P(B | A) can be found using the information on the prior
probability P(B) along with the conditional probabilities P(A | B) and P(A | Bc) as:
P(A | B)P(B)
P(A ∩ B)
P(A ∩ B)
________________________
.
P(B | A) 5 ________ 5 __________________
c 5
P(A)
P(A ∩ B) 1 P(A ∩ B ) P(A | B)P(B) 1 P(A | Bc)P(Bc)
In the above formula, we have used Bayes’ theorem to update the prior probability P(B)
to the posterior probability P(B | A). Equivalently, we can use Bayes’ theorem to update
the prior probability P(A) to derive the posterior probability P(A | B) by interchanging the
events A and B in the above formula.
EXAMPLE 4.17
In a lie-detector test, an individual is asked to answer a series of questions while connected to a polygraph (lie detector). This instrument measures and records several
physiological responses of the individual on the basis that false answers will produce
distinctive measurements. Assume that 99% of the individuals who go in for a polygraph test tell the truth. These tests are considered to be 95% reliable. In other words,
there is a 95% chance that the test will detect a lie if an individual actually lies. Let
there also be a 0.5% chance that the test erroneously detects a lie even when the individual is telling the truth. An individual has just taken a polygraph test and the test has
detected a lie. What is the probability that the individual was actually telling the truth?
126
E S S E N T I A L S O F B U S I N E S S S TAT I S T I C S
jag20549_ch04_100-137.indd 126
CHAPTER 4
Introduction to Probability
23/11/12 5:20 PM
SOLUTION: First we define some events and their associated probabilities. Let D and
T correspond to the events that the polygraph detects a lie and that an individualВ is
telling the truth, respectively. We are given that P(T) 5 0.99, implying that P(T c)В 5
1 2 0.99 5 0.01. In addition, we formulate P(D | T c) 5 0.95 and P(D | T ) 5 0.005.
We need to find P(T | D ) when we are not explicitly given P(D ∩ T) and P(D). We
can use Bayes’ theorem to find:
P(D | T)P(T)
P(D ∩ T )
P(D ∩ T)
5 ________________________.
P(T | D) 5 ________ 5 ___________________
P(D)
P(D ∩ T ) 1 P(D ∩ T c) P(D | T)P(T) 1 P(D | T c)P(Tc)
Although we can use this formula to solve the problem directly, it is often easier to
solve it systematically with the help of the following table.
TABLE 4.6 Computing Posterior Probabilities for Example 4.17
Prior Probability
Conditional Probability
Joint Probability
Posterior
Probability
P(T ) 5 0.99
P(D | T ) 5 0.005
P(D ∩ T ) 5 0.00495
P(T | D) 5 0.34256
P(T c) 5 0.01
P(D | T c) 5 0.95
P(D ∩ T c) 5 0.00950
P(T c | D) 5 0.65744
P(D) 5 0.01445
P(T | D) 1 P(T c | D) 5 1
P(T ) 1 P(T c) 5 1
The first column presents prior probabilities and the second column shows related conditional probabilities. We first compute the denominator of Bayes’ theorem by using the
total probability rule, P(D) 5 P(D ∩ T ) 1 P(D ∩ T c). Joint probabilities are calculated
as products of conditional probabilities with their corresponding prior probabilities. For
instance, in Table 4.6, in order to obtain P(D ∩ T ), we multiply P(D | T ) with P(T ),
which yields P(D ∩ T ) 5 0.005 3 0.99 5 0.00495. Similarly, we find P(D ∩ T c) 5
0.95 3 0.01 5 0.00950. Thus, according to the total probability rule, P(D) 5 0.00495 1
P(D ∩ T )
0.00495
5 ______
5 0.34256. The
0.00950 5 0.01445. Finally, P(T | D) 5 _______________
P(D ∩ T) 1 P(D ∩ T c)
0.01445
prior probability of an individual telling the truth is 0.99. However, given the new
information that the polygraph detected the individual telling a lie, the posterior probability of this individual telling the truth is now revised downward to 0.34256.
So far we have used the total probability rule as well as Bayes’ theorem based on two
mutually exclusive and exhaustive events, namely, B and Bc. We can easily extend the
analysis to include n mutually exclusive and exhaustive events, B1, B2, . . . , Bn.
E X T E N S I O N S O F T H E TOTA L P R O B A B I L I T Y R U L E
A N D B AYE S’ T H E O R E M
If B1, B2, . . . Bn represent n mutually exclusive and exhaustive events, then the total
probability rule extends to:
P(A) 5 P(A ∩ B1) 1 P(A ∩ B2) 1 ? ? ? 1 P(A ∩ Bn),
or equivalently,
P(A) 5 P(A | B1)P(B1) 1 P(A | B2)P(B2) 1 ? ? ? 1 P(A | Bn)P(Bn).
Similarly, Bayes’ theorem, for any i 5 1, 2, . . . , n, extends to:
P(A ∩ Bi)
,
P(Bi | A) 5 ___________________________________
P(A ∩ B1) 1 P(A ∩ B2) 1 ? ? ? 1 P(A ∩ Bn)
or equivalently,
P(A | Bi)P(Bi)
P(Bi | A) 5 ____________________________________________.
P(A | B1)P(B1) 1 P(A | B2)P(B2) 1 ? ? ? 1 P(A | Bn)P(Bn)
4.4
jag20549_ch04_100-137.indd 127
The Total Probability Rule and Bayes’ Theorem
127
23/11/12 5:20 PM
EXAMPLE 4.18
Scott Myers is a security analyst for a telecommunications firm called Webtalk.
Although he is optimistic about the firm’s future, he is concerned that its stock price
will be considerably affected by the condition of credit flow in the economy. He believes that the probability is 0.20 that credit flow will improve significantly, 0.50 that it
will improve only marginally, and 0.30 that it will not improve at all. He also estimates
that the probability that the stock price of Webtalk will go up is 0.90 with significant
improvement in credit flow in the economy, 0.40 with marginal improvement in credit
flow in the economy, and 0.10 with no improvement in credit flow in the economy.
a. Based on Scott’s estimates, what is the probability that the stock price of
Webtalk goes up?
b. If we know that the stock price of Webtalk has gone up, what is the probability
that credit flow in the economy has improved significantly?
SOLUTION: As always, we first define the relevant events and their associated
probabilities. Let S, M, and N denote significant, marginal, and no improvement
in credit flow, respectively. Then P(S) 5 0.20, P(M) 5 0.50, and P(N) 5 0.30. In
addition, if we allow G to denote an increase in stock price, we formulate P(G | S) 5
0.90, P(G | M) 5 0.40, and P(G | N) 5 0.10. We need to calculate P(G) in part aВ and
P(S | G) in part b. Table 4.7 aids in assigning probabilities.
TABLE 4.7 Computing Posterior Probabilities for Example 4.18
Conditional
Probability
Joint
Probability
Posterior Probability
P(S ) 5 0.20
P(G | S ) 5 0.90
P(G ∩ S) 5 0.18
P(S | G) 5 0.4390
P(M) 5 0.50
P(G | M) 5 0.40
P(G ∩ M) 5 0.20
P(M | G) 5 0.4878
P(N) 5 0.30
P(G | N) 5 0.10
P(G ∩ N) 5 0.03
P(N | G) 5 0.0732
Prior Probability
P(S ) 1 P(M ) 1 P(N) 5 1
P(G) 5 0.41
P(S | G) 1 P(M | G) 1 P(N | G) 5 1
a. In order to calculate P(G), we use the total probability rule, P(G) 5 P(G ∩ S) 1
P(G ∩ M) 1 P(G ∩ N). The joint probabilities are calculated as a product
of conditional probabilities with their corresponding prior probabilities.
For instance, in Table 4.7, P(G ∩ S) 5 P(G | S)P(S) 5 0.90 3 0.20 5 0.18.
Therefore, the probability that the stock price of Webtalk goes up equals
P(G) 5 0.18 1 0.20 1 0.03 5 0.41.
P(G ∩ S)
P(G ∩ S)
_______________________.
b. According to Bayes’ theorem, P(S | G) 5 ______
5 P(G
P(G)
∩ S) 1 P(G ∩ M) 1 P(G ∩ N )
We use the total probability rule in the denominator to find P(G) 5 0.18 1
P(G ∩ S)
0.18
0.20 1 0.03 5 0.41. Therefore, P(S | G) 5 ______
5 ___
5 0.4390. Note
P(G)
0.41
that the prior probability of a significant improvement in credit flow is revised
upward from 0.20 to a posterior probability of 0.4390.
EXERCISES 4.4
Mechanics
49. Let P(A) 5 0.70, P(B | A) 5 0.55, and P(B | Ac) = 0.10. Use a
probability tree to calculate the following probabilities:
a. P(Ac)
b. P(A ∩ B) and P(Ac ∩ B)
c. P(B)
d. P(A | B)
128
E S S E N T I A L S O F B U S I N E S S S TAT I S T I C S
jag20549_ch04_100-137.indd 128
CHAPTER 4
50. Let P(B) 5 0.60, P(A | B) 5 0.80, and P(A | Bc) 5 0.10. Calculate
the following probabilities:
a. P(Bc)
b. P(A ∩ B) and P(A ∩ Bc)
c. P(A)
d. P(B | A)
Introduction to Probability
23/11/12 5:20 PM
51. Complete the following probability table.
Prior
Probability
Conditional
Probability
Joint
Probability
P(B) 5 0.85
P(A | B) 5 0.05
P(A ∩ B ) 5
P(B | A) 5
P(A ∩ B ) 5
P(B c | A) 5
P(A) 5
Total 5
c
P(B ) 5
c
P(A | B ) 5 0.80
Total 5
c
Posterior
Probability
52. Let a sample space be partitioned into three mutually
exclusive and exhaustive events, B1, B2, and B3. Complete
the following probability table.
Prior
Probabilities
Conditional
Probabilities
Joint
Probabilities
Posterior
Probabilities
P(B1) 5 0.10
P(A | B1) 5 0.40
P(A ∩ B1) 5
P(B1 | A) 5
P(B2) 5
P(A | B2) 5 0.60
P(A ∩ B2) 5
P(B2 | A) 5
P(B3) 5 0.30
P(A | B3) 5 0.80
P(A ∩ B3) 5
P(B3 | A) 5
P(A) 5
Total 5
Total 5
Applications
53. Christine has always been weak in mathematics. Based on her
performance prior to the final exam in Calculus, there is a 40%
chance that she will fail the course if she does not have a tutor.
With a tutor, her probability of failing decreases to 10%. There is
only a 50% chance that she will find a tutor at such short notice.
a. What is the probability that Christine fails the course?
b. Christine ends up failing the course. What is the
probability that she had found a tutor?
54. An analyst expects that 20% of all publicly traded companies
will experience a decline in earnings next year. The analyst has
developed a ratio to help forecast this decline. If the company is
headed for a decline, there is a 70% chance that this ratio will be
negative. If the company is not headed for a decline, there is a
15% chance that the ratio will be negative. The analyst randomly
selects a company and its ratio is negative. What is the posterior
probability that the company will experience a decline?
55. The State Police are trying to crack down on speeding on a
particular portion of the Massachusetts Turnpike. To aid in this
pursuit, they have purchased a new radar gun that promises
greater consistency and reliability. Specifically, the gun advertises
6 one-mile-per-hour accuracy 98% of the time; that is, there is
a 0.98 probability that the gun will detect a speeder, if the driver
is actually speeding. Assume there is a 1% chance that the gun
erroneously detects a speeder even when the driver is below
the speed limit. Suppose that 95% of the drivers drive below the
speed limit on this stretch of the Massachusetts Turnpike.
a. What is the probability that the gun detects speeding
and the driver was speeding?
b. What is the probability that the gun detects speeding
and the driver was not speeding?
c. Suppose the police stop a driver because the gun
detects speeding. What is the probability that the driver
was actually driving below the speed limit?
March 19, 2012). It is estimated that 90% of older teens (aged
14 to 17) and 60% of younger teens (aged 12 to 13) own a cell
phone. Suppose 70 percent of all teens are older teens.
a. What is the implied probability that a teen owns a cell
phone?
b. Given that a teen owns a cell phone, what is the
probability that he/she is an older teen?
c. Given that the teen owns a cell phone, what is the
probability that he/she is a younger teen?
57. According to data from the National Health and Nutrition
Examination Survey, 33% of white, 49.6% of black, 43%
of Hispanic, and 8.9% of Asian women are obese. In a
representative town, 48% of women are white, 19% are
black, 26% are Hispanic, and the remaining 7% are Asian.
a. Find the probability that a given woman in this town is
obese.
b. Given that a woman is obese, what is the probability that
she is white?
c. Given that a woman is obese, what is the probability that
she is black?
d. Given that a woman is obese, what is the probability that
she is Asian?
58. A crucial game of the Los Angeles Lakers basketball team
depends on the health of their key player. According to his
doctor’s report, there is a 40% chance that he will be fully fit to
play, a 30% chance that he will be somewhat fit to play, and a
30% chance that he will not be able to play at all. The coach has
estimated the chances of winning at 80% if the player is fully
fit, 60% if he is somewhat fit, and 40% if he is unable to play.
a. What is the probability that the Lakers will win the game?
b. You have just heard that the Lakers won the game. What
is the probability that the key player had been fully fit to
play in the game?
59. An analyst thinks that next year there is a 20% chance that
the world economy will be good, a 50% chance that it will be
neutral, and a 30% chance that it will be poor. She also predicts
probabilities that the performance of a start-up firm, Creative
Ideas, will be good, neutral, or poor for each of the economic
states of the world economy. The following table presents
probabilities for three states of the world economy and the
corresponding conditional probabilities for Creative Ideas.
State of
the World
Economy
Performance
of Creative
Ideas
Conditional
Probability of
Creative Ideas
Good
0.20
Good
Neutral
Poor
0.60
0.30
0.10
Neutral
0.50
Good
Neutral
Poor
0.40
0.30
0.30
Poor
0.30
Good
Neutral
Poor
0.20
0.30
0.50
56. According to a recent study, cell phones are the main medium
for teenagers to stay connected with friends and family (CNN,
4.4
jag20549_ch04_100-137.indd 129
Probability
of Economic
State
The Total Probability Rule and Bayes’ Theorem
129
23/11/12 5:20 PM
a. What is the probability that the performance of the
world economy will be neutral and that of creative ideas
will be poor?
b. What is the probability that the performance of Creative
Ideas will be poor?
c. The performance of Creative Ideas was poor. What is the
probability that the performance of the world economy
had also been poor?
W R I T I N G W I T H S TAT I S T I C S
A University of Utah study examined 7,925 severely obese adults who had gastric bypass
surgery and an identical number of people who did not have the surgery (The Boston
Globe, August 23, 2007). The study wanted to investigate whether or not losing weight
through stomach surgery prolonged the lives of severely obese patients, thereby reducing
their deaths from heart disease, cancer, and diabetes.
Over the course of the study, 534 of the participants died. Of those who died, the
cause of death was classified as either a disease death (such as heart disease, cancer,
and diabetes) or a nondisease death (such as suicide or accident).
Lawrence Plummer, a research analyst, is handed Table 4.8, which
summarizes the study’s findings:
TABLE 4.8 Deaths Cross-Classified by Cause and
Method of Losing Weight
Method of Losing Weight
Cause of Death
Death from Disease
Death from Nondisease
No Surgery
Surgery
285
150
36
63
Lawrence wants to use the sample information to:
1. Calculate and interpret relevant probabilities for the cause of death and the method
of losing weight.
2. Determine whether the events “Death from Disease” and “No Surgery” are
independent.
Sample
Report—
Linking Cause
of Death with
the Method of
Losing Weight
130
Numerous studies have documented the health risks posed to severely obese people—
those people who are at least 100 pounds overweight. Severely obese people, for
instance, typically suffer from high blood pressure and are more likely to develop diabetes. A University of Utah study examined whether the manner in which a severely
obese person lost weight influenced a person’s longevity. The study followed 7,925 patients who had stomach surgery and an identical number who did not have the surgery.
Of particular interest in this report are the 534 participants who died over the course of
the study.
The deceased participants were cross-classified by the method in which they lost
weight and by the cause of their death. The possible outcomes for the method of losing
weight were either “no surgery” or “surgery,” and the possible outcomes for the cause
of death were either “disease death” (such as heart disease, cancer, or diabetes) or a
“nondisease death” (such as suicide or accident). Table 4.A shows the joint probability
table.
E S S E N T I A L S O F B U S I N E S S S TAT I S T I C S
jag20549_ch04_100-137.indd 130
CHAPTER 4
Introduction to Probability
23/11/12 5:20 PM
TABLE 4.A Joint Probability Table of Deaths Cross-Classified by
Cause and Method of Losing Weight
Method of Losing Weight
Cause of Death
Total
No Surgery
Surgery
Death from Disease
0.53
0.28
0.81
Death from Nondisease
0.07
0.12
0.19
Total
0.60
0.40
1.00
The unconditional probabilities reveal that 0.60 of the deceased participants in the study
did not have surgery, while 0.40 of those who died had opted for the stomach surgery.
Of the 534 participants that died, the vast majority, 0.81, died from disease, whereas the
cause of death for the remainder was from a nondisease cause.
Joint probabilities reveal that the probability that a deceased participant had no surgery
and died from disease was 0.53; yet the probability that a deceased participant had surgery and died from disease was only 0.28. Using the unconditional probabilities and the
joint probabilities, it is possible to calculate conditional probabilities. For example, given
that a participant’s cause of death was from disease, the probability that the participant
did not have surgery was 0.65 (5 0.53Нћ0.81). Similarly, of those participants who opted
for no surgery, the likelihood that their death was from disease was 0.88 (5 0.53Нћ0.60).
A comparison of the conditional probabilities with the unconditional probabilities can
reveal whether or not the events “Death from Disease” and “No Surgery” are independent.
For instance, there is an 81% chance that a randomly selected obese person dies from disease. However, given that an obese person chooses to lose weight without surgery, the likelihood that he/she dies from disease jumps to 88%. Thus, this initial research appears to
suggest that a participant’s cause of death is associated with his/her method of losing weight.
Conceptual Review
LO 4.1
Describe fundamental probability concepts.
In order to assign the appropriate probability to an uncertain event, it is useful to establish some terminology. An experiment is a process that leads to one of several possible
outcomes. A sample space, denoted S, of an experiment contains all possible outcomes
of the experiment. An event is any subset of outcomes of an experiment, and is called
a simple event if it contains a single outcome. Events are exhaustive if all possible
outcomes of an experiment belong to the events. Events are mutually exclusive if they
do not share any common outcome of an experiment.
A probability is a numerical value that measures the likelihood that an event occurs.
It assumes a value between zero and one where a value zero indicates an impossible
event and a value one indicates a definite event. The two defining properties of a
probability are (1) the probability of any event A is a value between 0 and 1, 0 # P(A)
# 1, and (2) the sum of the probabilities of any list of mutually exclusive and exhaustive events equals 1.
LO 4.2
Formulate and explain subjective, empirical, and classical probabilities.
A subjective probability is calculated by drawing on personal and subjective judgment. An empirical probability is calculated as a relative frequency of occurrence.
A classical probability is based on logical analysis rather than on observation or personal judgment.
Conceptual Review
jag20549_ch04_100-137.indd 131
131
23/11/12 5:20 PM
LO 4.3
Calculate and interpret the probability of the complement of an event
and the probability that at least one of two events will occur.
Rules of probability allow us to calculate the probabilities of more complex events.
The complement rule states that the probability of the complement of an event can
be found by subtracting the probability of the event from one: P(Ac) 5 1 2 P(A). We
calculate the probability that at least one of two events occurs by using the addition
rule: P(A ∪ B) 5 P(A) 1 P(B) 2 P(A ∩ B). Since P(A ∩ B) 5 0 for mutually exclusive
events, the addition rule then simplifies in these instances to P(A в€Є B) 5 P(A) 1 P(B).
LO 4.4
Calculate and interpret a conditional probability and the multiplication rule.
The probability of event A, denoted P(A), is an unconditional probability. It is the
probability that A occurs without any additional information. The probability that A occurs given that B has already occurred, denoted P(A | B), is a conditional probability.
P(A ∩ B)
. We rearrange the condiA conditional probability is computed as P(A | B) 5 ______
P(B)
tional probability formula to arrive at the multiplication rule. When using this rule we
find the probability that two events, A and B, both occur, that is, P(A ∩ B) 5 P(A | B)
P(B) 5 P(B | A)P(A).
LO 4.5
Distinguish between independent and dependent events.
Two events, A and B, are independent if P(A | B) 5 P(A) , or if P(B | A) 5 P(B). Otherwise, the events are dependent. For independent events, the multiplication rule simplifies to P(A ∩ B) 5 P(A)P(B).
LO 4.6
Calculate and interpret probabilities from a contingency table.
A contingency table generally shows frequencies for two qualitative (categorical)
variables, x and y, where each cell represents a mutually exclusive combination of x-y
values. Empirical probabilities are easily calculated as the relative frequency of the
occurrence of the event.
LO 4.7
Apply the total probability rule and Bayes’ theorem.
The total probability rule expresses the unconditional probability of an event A in
terms of probabilities of the intersection of A with two mutually exclusive and exhaustive events, B and Bc:
P(A) 5 P(A ∩ B) 1 P(A ∩ Bc) 5 P(A | B)P(B) 1 P(A | Bc)P(Bc).
We can extend the above rule where the sample space is partitioned into n mutually
exclusive and exhaustive events, B1, B2, . . . , Bn. The total probability rule is:
P(A) 5 P(A ∩ B1) 1 P(A ∩ B2) 1 ? ? ? 1 P(A ∩ Bn), or equivalently,
P(A) 5 P(A | B1)P(B1) 1 P(A | B2)P(B2) 1 ? ? ? 1 P(A | Bn)P(Bn).
Bayes’ theorem provides a procedure for updating probabilities based on new information. Let P(B) be the prior probability and P(B | A) be the posterior probability based
on new information provided by A. Then:
P(A | B)P(B)
P(A ∩ B)
5 ________________________.
P(B | A) 5 __________________
P(A ∩ B) 1 P(A ∩ Bc) P(A | B)P(B) 1 P(A | Bc)P(Bc)
For the extended case, Bayes’ theorem, for any i 5 1, 2, . . . , n, is:
P(A ∩ Bi)
P(Bi | A) 5 ___________________________________
, or
P(A ∩ B1) 1 P(A ∩ B2) 1 ? ? ? 1 P(A ∩ Bn)
P(A | Bi)P(Bi)
equivalently, P (Bi | A) 5 ____________________________________________.
P(A | B1)P(B1) 1 P(A | B2)P(B2) 1 ? ? ? 1 P(A | Bn)P(Bn)
132
E S S E N T I A L S O F B U S I N E S S S TAT I S T I C S
jag20549_ch04_100-137.indd 132
CHAPTER 4
Introduction to Probability
23/11/12 5:20 PM
Additional Exercises and Case Studies
60. According to a global survey of 4,400 parents of children
between the ages of 14 to 17, 44% of parents spy on their
teen’s Facebook account (http://msnbc.com, April 25, 2012).
Assume that American parents account for 10% of all parents
of teens with Facebook accounts, of which 60% spy on their
teen’s Facebook account. Suppose a parent is randomly
selected, and the following events are defined: A = selecting
an American parent and B = selecting a spying parent.
a. Based on the above information, what are the
probabilities that can be established? Would you label
them as subjective, empirical, or classical?
b. Are the events A and B mutually exclusive and/or
exhaustive? Explain.
c. Are the events A and B independent? Explain.
d. What is the probability of selecting an American parent
given that she/he is a spying parent?
61. According to a recent study, cell phones, especially text
messaging, is the main medium for teenagers to stay
connected with friends and family (CNN, March 19, 2012).
It is found that only 23% of teens don’t own a cell phone.
Of those who own a cell phone, only one in four uses
a smartphone. What proportion of all teenagers use a
smartphone?
62. Henry Chow is a stockbroker working for Merrill Lynch.
He knows from past experience that there is a 70% chance
that his new client will want to include U.S. equity in her
portfolio and a 50% chance that she will want to include
foreign equity. There is also a 40% chance that she will want
to include both U.S. equity and foreign equity in her portfolio.
a. What is the probability that the client will want to
include U.S. equity if she already has foreign equity in
her portfolio?
b. What is the probability that the client decides to include
neither U.S. equity nor foreign equity in her portfolio?
63. The following frequency distribution shows the ages of
India’s 40 richest individuals. One of these individuals is
selected at random.
Ages
Frequency
30 up to 40
3
40 up to 50
8
50 up to 60
15
60 up to 70
9
70 up to 80
5
SOURCE: http://www.forbes.com.
a. What is the probability that the individual is between
50 and 60 years of age?
b. What is the probability that the individual is younger
than 50 years of age?
c. What is the probability that the individual is at least
60 years of age?
64. Anthony Papantonis, owner of Nauset Construction, is
bidding on two projects, A and B. The probability that he
wins project A is 0.40 and the probability that he wins
project B is 0.25. Winning Project A and winning Project B
are independent events.
a. What is the probability that he wins project A or
project B?
b. What is the probability that he does not win either
project?
65. Since the fall of 2008, millions of Americans have lost jobs
due to the economic meltdown. A recent study shows that
unemployment has not impacted males and females in
the same way (Newsweek, April 20, 2009). According to a
Bureau of Labor Statistics report, 8.5% of those who are
eligible to work are unemployed. The unemployment rate
is 8.8% for eligible men and only 7.0% for eligible women.
Suppose 52% of the eligible workforce in the U.S. consists
of men.
a. You have just heard that another worker in a large firm
has been laid off. What is the probability that this worker
is a man?
b. You have just heard that another worker in a large firm
has been laid off. What is the probability that this worker
is a woman?
66. How much you smile in your younger days can predict
your later success in marriage (http://msnbc.com, April 16,
2009). The analysis is based on the success rate in marriage
of people over age 65 and their smiles when they were
only 10 years old. Researchers found that only 11% of the
biggest smilers had been divorced, while 31% of the biggest
frowners had experienced a broken marriage.
a. Suppose it is known that 2% of the people are the
biggest smilers at age 10 and divorced in later years.
What percent of people are the biggest smilers?
b. If 25% of people are considered to be the biggest
frowners, calculate the probability that a person is the
biggest frowner at age 10 and divorced later in life.
67. A professor of management has heard that eight students
in his class of 40 have landed an internship for the summer.
Suppose he runs into two of his students in the corridor.
a. Find the probability that neither of these students has
landed an internship.
b. Find the probability that both of these students have
landed an internship.
68. Wooden boxes are commonly used for the packaging
and transportation of mangoes. A convenience store in
Morganville, New Jersey, regularly buys mangoes from a
wholesale dealer. For every shipment, the manager randomly
inspects two mangoes from a box containing 20 mangoes
for damages due to transportation. Suppose the chosen box
contains exactly 3 damaged mangoes.
a. Find the probability that the first mango is not damaged.
Additional Exercises and Case Studies
jag20549_ch04_100-137.indd 133
133
23/11/12 5:20 PM
b. Find the probability that none of the mangoes is
damaged.
c. Find the probability that both mangoes are damaged.
69. According to the CGMA Economic Index, which measures
executive sentiment across the world, 18% of all respondents
expressed optimism about the global economy (http://www
.aicpa.org, March 29, 2012). Moreover, 22% of the
respondents from the United States and 9% from Asia felt
optimistic about the global economy.
a. What is the probability that an Asian respondent is not
optimistic about the global economy?
b. If 28% of all respondents are from the United States,
what is the probability that a respondent is from
the United States and is optimistic about the global
economy?
c. Suppose 22% of all respondents are from Asia. If a
respondent feels optimistic about the global economy,
what is the probability that the respondent is from Asia?
70. At a local bar in a small Midwestern town, beer and wine are
the only two alcoholic options. The manager noted that of all
male customers who visited over the weekend, 150 ordered
beer, 40 ordered wine, and 20 asked for soft drinks. Of female
customers, 38 ordered beer, 20 ordered wine, and 12 asked
for soft drinks.
a. Construct a contingency table that shows frequencies
for the qualitative variables Gender (male or female) and
Drink Choice (beer, wine, or soft drink).
b. Find the probability that a customer orders wine.
c. What is the probability that a male customer orders wine?
d. Are the events “Wine” and “Male” independent? Explain
using probabilities.
71. It has generally been believed that it is not feasible for men
and women to be just friends (The New York Times, April 12,
2012). Others argue that this belief may not be true anymore
since gone are the days when men worked and women
stayed at home and the only way they could get together
was for romance. In a recent survey, 186 heterosexual college
students were asked if it was feasible for men and women
to be just friends. Thirty-two percent of females and 57% of
males reported that it was not feasible for men and women
to be just friends. Suppose the study consisted of 100 female
and 86 male students.
a. Construct a contingency table that shows frequencies
for the qualitative variables Gender (men or women) and
Feasible (yes or no).
b. Find the probability that a student believes that men and
women can be friends.
c. If a student believes that men and women can be
friends, what is the probability that this student is a
male? Find the corresponding probability that this
student is a female.
72. A recent study in the Journal of the American Medical
Association (February 20, 2008) found that patients who go
into cardiac arrest while in the hospital are more likely to
134
E S S E N T I A L S O F B U S I N E S S S TAT I S T I C S
jag20549_ch04_100-137.indd 134
CHAPTER 4
die if it happens after 11 pm. The study investigated 58,593
cardiac arrests that occurred during the day or evening. Of
those, 11,604 survived to leave the hospital. There were
28,155 cardiac arrests during the shift that began at 11 pm,
commonly referred to as the graveyard shift. Of those,
4,139 survived for discharge. The following contingency
table summarizes the results of the study.
Survived for Did not Survive
Discharge
for Discharge
Day or Evening Shift
Graveyard Shift
11,604
46,989
58,593
4,139
24,016
28,155
15,743
71,005
86,748
a. What is the probability that a randomly selected patient
experienced cardiac arrest during the graveyard shift?
b. What is the probability that a randomly selected patient
survived for discharge?
c. Given that a randomly selected patient experienced
cardiac arrest during the graveyard shift, what is the
probability the patient survived for discharge?
d. Given that a randomly selected patient survived
for discharge, what is the probability the patient
experienced cardiac arrest during the graveyard shift?
e. Are the events “Survived for Discharge” and “Graveyard
Shift” independent? Explain using probabilities. Given
your answer, what type of recommendations might you
give to hospitals?
73. It has been reported that women end up unhappier than
men later in life, even though they start out happier (Yahoo
News, August 1, 2008). Early in life, women are more likely
to fulfill their family life and financial aspirations, leading
to greater overall happiness. However, men report a higher
satisfaction with their financial situation and family life,
and are thus happier than women in later life. Suppose
the results of the survey of 300 men and 300 women are
presented in the following table.
Response to the question “Are you satisfied with your financial
and family life?”
Age
Response by Women
20 to 35
35 to 50
Over 50
Yes
73
36
32
No
67
54
38
Age
Response by Men
20 to 35
35 to 50
Over 50
Yes
58
34
38
No
92
46
32
a. What is the probability that a randomly selected woman
is satisfied with her financial and family life?
b. What is the probability that a randomly selected man is
satisfied with his financial and family life?
Introduction to Probability
23/11/12 5:20 PM
c. For women, are the events “Yes” and “20 to 35”
independent? Explain using probabilities.
d. For men, are the events “Yes” and “20 to 35” independent?
Explain using probabilities.
74. An analyst predicts that there is a 40% chance that the U.S.
economy will perform well. If the U.S. economy performs
well, then there is an 80% chance that Asian countries will
also perform well. On the other hand, if the U.S. economy
performs poorly, the probability of Asian countries
performing well goes down to 0.30.
a. What is the probability that both the U.S. economy and
the Asian countries will perform well?
b. What is the unconditional probability that the Asian
countries will perform well?
c. What is the probability that the U.S. economy will
perform well, given that the Asian countries perform
well?
75. Apparently, depression significantly increases the risk of
developing dementia later in life (BBC News, July 6, 2010).
In a recent study it was reported that 22% of those who had
depression went on to develop dementia, compared to only
17% of those who did not have depression. Suppose 10% of
all people suffer from depression.
a. What is the probability of a person developing
dementia?
b. If a person has developed dementia, what is the
probability that the person suffered from depression
earlier in life?
76. According to data from the National Health and Nutrition
Examination Survey, 36.5% of adult women and 26.6% of
adult men are at a healthy weight. Suppose 50.52% of the
adult population consists of women.
a. What proportion of adults is at a healthy weight?
b. If an adult is at a healthy weight, what is the probability
that the adult is a woman?
c. If an adult is at a healthy weight, what is the probability
that the adult is a man?
77. Suppose that 60% of the students do homework regularly.
It is also known that 80% of students who had been doing
homework regularly, end up doing well in the course (get
a grade of A or B). Only 20% of students who had not been
doing homework regularly, end up doing well in the course.
a. What is the probability that a student does well in the
course?
b. Given that the student did well in the course, what is the
probability that the student had been doing homework
regularly?
78. According to the Census’s Population Survey, the percentage of
children with two parents at home is the highest for Asians and
lowest for blacks (USA TODAY, February 26, 2009). It is reported
that 85% of Asian children have two parents at home versus
78% of white, 70% of Hispanic, and 38% of black. Suppose
there are 500 students in a representative school of which 280
are white, 50 are Asian, 100 are Hispanic, and 70 are black.
a. What is the probability that a child has both parents at
home?
b. If both parents are at home, what is the probability the
child is Asian?
c. If both parents are at home, what is the probability the
child is black?
CASE STUDIES
Case Study 4.1
Ever since the introduction of New Coke failed miserably in the 1980s, most food and
beverage companies have been cautious about changing the taste or formula of their signature offerings. In an attempt to attract more business, Starbucks recently introduced a
new milder brew, Pike Place Roast, as its main drip coffee at the majority of its locations
nationwide. The idea was to offer a more approachable cup of coffee with a smoother
finish. However, the strategy also downplayed the company’s more established robust
roasts; initially, the milder brew was the only option for customers after noon. Suppose
on a recent afternoon, 100 customers were asked whether or not they would return in
the near future for another cup of Pike Place Roast. The following contingency table
(cross-classified by type of customer and whether or not the customer will return) lists
the results:
Data for Case Study 4.1
Customer Type
Return in Near Future?
First-time Customer
Established Customer
Yes
35
10
No
5
50
Additional Exercises and Case Studies
jag20549_ch04_100-137.indd 135
135
23/11/12 5:20 PM
In a report, use the sample information to:
1. Calculate and interpret unconditional probabilities.
2. Calculate the probability that a customer will return given that the customer is an
established customer.
3. Determine whether the events “Customer will Return” and “Established Customer”
are independent. Shortly after the introduction of Pike Place Roast, Starbucks decided to offer its bolder brew again in the afternoon at many of its locations. Do your
results support Starbucks’ decision? Explain.
Case Study 4.2
It is common to ignore the thyroid gland of women during pregnancy (New York
Times, April 13, 2009). This gland makes hormones that govern metabolism, helping
to regulate body weight, heart rate, and a host of other factors. If the thyroid malfunctions, it can produce too little or too much of these hormones. Hypothyroidism,
caused by an untreated underactive thyroid in pregnant women, carries the risk of
impaired intelligence in the child. According to one research study, 62 out of 25,216
pregnant women were identified with hypothyroidism. Nineteen percent of the children born to women with an untreated underactive thyroid had an I.Q. of 85 or lower,
compared with only 5% of those whose mothers had a healthy thyroid. It was also reported that if mothers have their hypothyroidism treated, their children’s intelligence
would not be impaired.
In a report, use the sample information to:
1. Find the likelihood that a woman suffers from hypothyroidism during pregnancy and
later has a child with an I.Q. of 85 or lower.
2. Determine the number of children in a sample of 100,000 that are likely to have an
I.Q. of 85 or lower if the thyroid gland of pregnant women is ignored.
3. Compare and comment on your answer to part b with the corresponding number if
all pregnant women are tested and treated for hypothyroidism.
Case Study 4.3
Enacted in 1998, the Children’s Online Privacy Protection Act requires firms to obtain
parental consent before tracking the information and the online movement of children;
however, the act applies to those children ages 12 and under. Teenagers are often oblivious to the consequences of sharing their lives online. Data reapers create huge libraries
of digital profiles and sell these profiles to advertisers, who use it to detect trends and
micro-target their ads back to teens. For example, a teen searching online for ways to lose
weight could become enticed by an ad for dietary supplements, fed into his/her network
by tracking cookies. As a preliminary step in gauging the magnitude of teen usage of
social networking sites, an economist surveys 200 teen girls and 200 teen boys. Of teen
girls, 166 use social networking sites; of teen boys, 156 use social networking sites.
In a report, use the sample information to:
1. Construct a contingency table that shows frequencies for the qualitative variables
Gender (male or female) and Use of Social Networking Sites (Yes or No).
2. What is the probability that a teen uses social networking sites?
3. What is the probability that a teen girl uses a social networking site?
4. A bill before Congress would like to extend the Children’s Online Privacy Protection
Act to apply to 15-year-olds. In addition, the bill would also ban Internet companies
from sending targeted advertising to children under 16 and give these children and
their parents the ability to delete their digital footprint and profile with an “eraser
button” (The Boston Globe, May 20, 2012). Given the probabilities that you calculated with respect to teen usage of social networking sites, do you think that this
legislation is necessary? Explain.
136
E S S E N T I A L S O F B U S I N E S S S TAT I S T I C S
jag20549_ch04_100-137.indd 136
CHAPTER 4
Introduction to Probability
23/11/12 5:20 PM
Case Study 4.4
In 2008, it appeared that rising gas prices had made Californians less resistant to offshore
drilling. A Field Poll survey showed that a higher proportion of Californians supported
the idea of drilling for oil or natural gas along the state’s coast than in 2005 (The Wall
Street Journal, July 17, 2008). Assume that random drilling for oil only succeeds 5% of
the time.
An oil company has just announced that it has discovered new technology for detecting oil. The technology is 80% reliable. That is, if there is oil, the technology will signal
“oil” 80% of the time. Let there also be a 1% chance that the technology erroneously
detects oil, when in fact no oil exists.
In a report, use the above information to:
1. Prepare a table that shows the relevant probabilities.
2. Find the probability that, on a recent expedition, oil actually existed but the technology detected “no oil” in the area.
Additional Exercises and Case Studies
jag20549_ch04_100-137.indd 137
137
23/11/12 5:20 PM
© Copyright 2026 Paperzz