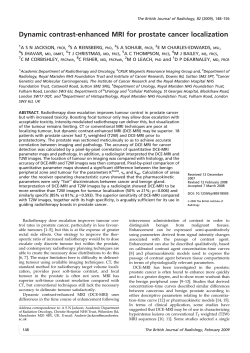
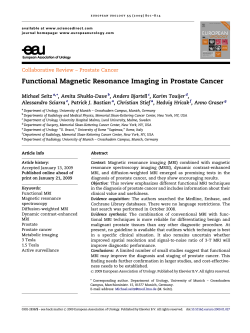
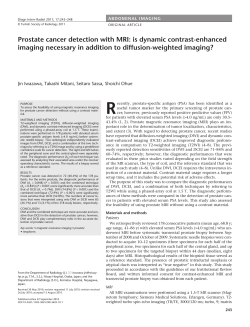
10_06_1329_Ocak.fm — 9/27/07 Ocak et al. MRI Diagnosis of Prostate Cancer Based on Pharmacokinetic Parameters Genitourinar y Imaging • Original Research Dynamic Contrast-Enhanced MRI of Prostate Cancer at 3 T: A Study of Pharmacokinetic Parameters Iclal Ocak1,2 Marcelino Bernardo3 Greg Metzger4 Tristan Barrett1 Peter Pinto5 Paul S. Albert6 Peter L. Choyke1 Ocak I, Bernardo M, Metzger G, et al. Keywords: dynamic contrast-enhanced MRI, genitourinary imaging, MRI, pharmacokinetics, prostate cancer DOI:10.2214/AJR.06.1329 Received October 18, 2006; accepted after revision April 23, 2007. Funded in part with federal funds from the National Cancer Institute, National Institutes of Health, under contract N01CO-12400; and by the Intramural Research Program of the National Institutes of Health, National Cancer Institute, Center for Cancer Research. The content of this publication does not necessarily reflect the views or policies of the Department of Health and Human Services, nor does mention of trade names, commercial products, or organizations imply endorsement of the U.S. government. 1Molecular Imaging Program, Center for Cancer Research, National Cancer Institute, Bethesda, MD 20892. 2Present address: Department of Radiology, University of Pittsburgh Medical Center, 200 Lothrop St., Pittsburgh, PA 15213-2582. Address correspondence to I. Ocak ([email protected]). 3NCI Molecular Imaging Program and Research Technology Program, SAIC-Frederick, Inc., Frederick, MD. 4Center for Magnetic Resonance Research, University of Minnesota, Minneapolis, MN. 5Urologic Oncology Branch, National Cancer Institute, Bethesda, MD. 6Biometric Research Branch, Division of Cancer Treatment and Diagnosis, National Cancer Institute, Bethesda, MD. WEB This is a Web exclusive article. AJR 2007; 189:W192–W201 0361–803X/07/1894–W192 © American Roentgen Ray Society W192 OBJECTIVE. The objectives of our study were to determine whether dynamic contrast-enhanced MRI performed at 3 T and analyzed using a pharmacokinetic model improves the diagnostic performance of MRI for the detection of prostate cancer compared with conventional T2-weighted imaging, and to determine which pharmacokinetic parameters are useful in diagnosing prostate cancer. SUBJECTS AND METHODS. This prospective study included 50 consecutive patients with biopsy-proven prostate cancer who underwent imaging of the prostate on a 3-T scanner with a combination of a sensitivity-encoding (SENSE) cardiac coil and an endorectal coil. Scans were obtained at least 5 weeks after biopsy. T2-weighted turbo spin-echo images were obtained in three planes, and dynamic contrast-enhanced images were acquired during a single-dose bolus injection of gadopentetate dimeglumine (0.1 mmol/kg). Sensitivity, specificity, positive predictive value (PPV), and negative predictive value (NPV) were estimated for T2-weighted and dynamic contrast-enhanced MRI. The following pharmacokinetic modeling parameters were determined and compared for cancer, inflammation, and healthy peripheral zone: Ktrans (forward volume transfer constant), kep (reverse reflux rate constant between extracellular space and plasma), ve (the fractional volume of extracellular space per unit volume of tissue), and the area under the gadolinium concentration curve (AUGC) in the first 90 seconds after injection. RESULTS. Pathologically confirmed cancers in the peripheral zone of the prostate were characterized by their low signal intensity on T2-weighted scans and by their early enhancement, early washout, or both on dynamic contrast-enhanced MR images. The overall sensitivity, specificity, PPV, and NPV of T2-weighted imaging were 94%, 37%, 50%, and 89%, respectively. The sensitivity, specificity, PPV, and NPV of dynamic contrast-enhanced MRI were 73%, 88%, 75%, and 75%, respectively. Ktrans, kep, and AUGC were significantly higher (p < 0.001) in cancer than in normal peripheral zone. The ve parameter was not significantly associated with prostate cancer. CONCLUSION. MRI of the prostate performed at 3 T using an endorectal coil produces high-quality T2-weighted images; however, specificity for prostate cancer is improved by also performing dynamic contrast-enhanced MRI and using pharmacokinetic parameters, particularly Ktrans and kep, for analysis. These results are comparable to published results at 1.5 T. rostate cancer is the most prevalent noncutaneous cancer in men and is the second leading cause of cancer-related deaths in American men. In 2006, the American Cancer Society estimated that 234,460 American men would be diagnosed with prostate cancer and that 27,350 men would die from the disease [1]. The incidence of prostate cancer has been increasing because of improved diagnosis, higher prevalence in an aging population, and increases in potential environmental carcinogens [2]. Most of these newly detected tumors are confined to the prostate gland; however, P existing imaging methods fail to localize the site of prostate cancer in 25–30% of the cases [1, 3]. Moreover, endorectal sonography and MRI using a conventional endorectal coil lack specificity for prostate cancer [4]. The ability of MRI to localize and stage prostate cancer could assist in the management of newly diagnosed prostate cancer. There are several methods that can improve the localization of prostate cancer using T2weighted MRI. One method is to perform MRI at higher field strengths, thus improving the signal-to-noise ratio (SNR). Another method is to use additional imaging tech- AJR:189, October 2007 10_06_1329_Ocak.fm — 9/27/07 MRI Diagnosis of Prostate Cancer Based on Pharmacokinetic Parameters niques. Dynamic contrast-enhanced MRI is a well-established method for detecting and quantifying tumor angiogenesis and is independent of T2 relaxation and MR spectroscopic characteristics. The results of dynamic contrast-enhanced MRI are usually interpreted quantitatively using pharmacokinetic modeling that allows transfer rate constants, such as Ktrans (forward volume transfer constant) and kep (reverse reflux rate constant between extracellular space and plasma), to be determined. These constants are known to be elevated in many cancers [4, 5]; therefore, quantitative dynamic contrast-enhanced MRI based on pharmacokinetic analysis is a potential method for improving the localization of prostate cancers on MRI. However, angiogenesis is not a constant feature of all tumors, especially small ones, and not all angiogenesis is due to cancer but can also be caused by inflammatory conditions. Therefore, the specificity of dynamic contrast-enhanced MRI must be determined in clinical trials. The results of previous studies performed at 1.5 T suggest that dynamic contrast-enhanced MRI can improve the specificity of MRI over conventional T2-weighted MRI for the detection of prostate cancer [6–8]. Few studies of dynamic contrast-enhanced MRI have been conducted at 3 T, which offers a higher SNR and improved temporal and spatial resolution that would be expected to improve the localization of prostate cancer relative to imaging at lower field strengths [9, 10]. In this study, we investigated the additional value of dynamic contrast-enhanced MRI in identifying prostate cancers compared with T2-weighted MRI at 3 T. Furthermore, we investigated which pharmacokinetic parameters are predictive of prostate cancer. Subjects and Methods Study Design This study was approved by the local institutional review board and was compliant with the Health Insurance Portability and Accountability Act, informed consent was obtained from each patient. Fifty consecutive patients were enrolled in the study between February 2005 and May 2006. All patients had biopsyproven prostate cancer and underwent imaging of the prostate using T2-weighted MRI and dynamic contrast-enhanced MRI at 3 T (Intera, Philips Medical Systems). The mean age of the patients was 61 years (range, 53–77 years), and the median prostate-specific antigen (PSA) level was 15 ng/mL (range, 0.6–270 ng/mL). The Gleason score ranged from 4 to 10. Inclusion criteria included MRI performed 5 weeks–6 months after endorectal biopsy from AJR:189, October 2007 which at least one of six biopsy samples was positive for prostate cancer and the location of each specimen was known. If the specimens and mapping were adequate, biopsies performed at outside institutions were accepted, but if not, they were repeated at our institution. All biopsy specimens were assessed by a board-certified genitourinary pathologist with extensive experience in prostate cancer. Patients underwent MRI at least 5 weeks after the biopsy was performed. Exclusion criteria included a history of distant metastatic disease, previous prostate radiation therapy, and a prior or concurrent history of androgen ablative hormonal therapy (i.e., orchidectomy, antiandrogens). Patients with contraindications to endorectal coil insertion (e.g., anorectal surgery, severe hemorrhoids) and those with contraindications to MRI (e.g., patients with cardiac pacemakers, cerebral aneurysm clips, shrapnel injury) were also excluded. MRI Technique All imaging examinations were performed using an endorectal coil (BPX-15, Medrad) tuned to 127.8 MHz and combined with a 6-channel cardiac coil (sensitivity-encoding [SENSE], Philips Medical Systems). Prior bowel preparation was not a requirement. After digital rectal examination was performed, the endorectal coil was inserted while the patient was lying in the lateral decubitus position and was inflated using perfluorocarbon (3 mol/L [Fluorinert, 3M]) to a volume of approximately 60 mL to reduce susceptibility artifacts induced by air in the coil’s balloon. Three-plane scout views of the prostate were obtained to confirm correct positioning of the endorectal coil. Multisection T2-weighted turbo spin-echo (TSE) images of the entire prostate were obtained in three planes (axial, coronal, and sagittal) at a resolution of 0.46 × 0.6 × 3.0 mm (field of view, 140 mm; matrix, 234 × 304; TR/TE, 8,852/120; flip angle, 90°; slice thickness, 3 mm). The axial images were positioned perpendicular to the rectal wall guided by the sagittal scout images, and the phase direction was left to right. Dynamic Contrast-Enhanced MRI Acquisition Dynamic contrast-enhanced images were acquired perpendicular to the long axis of the prostate, which approximates the axial plane, before, during, and after a single-dose injection of gadopentetate dimeglumine (Magnevist, Berlex Laboratories) at a dose of 0.1 mmol/kg through a peripheral vein at a rate of 3 mL/s via a mechanical injector (Spectris MR Injection System, Medrad). An unenhanced T1 map based on a dual flip angle was obtained before injection by acquiring an identical 3D acquisition with a flip angle of 5° to use along with data from the dynamic acquisition obtained at a flip angle of 15° [11]. The unenhanced T1 map allows subsequent changes in MR signal intensity during passage of the contrast agent to be converted into changes in gadopentetate dimeglumine concentration. The dynamic contrast-enhanced acquisition consisted of a 10-slice, 3D fast-field echo sequence (TR/TE, 5.5/2.1; 15° flip angle; 260-mm field of view; effective SENSE factor, 3; and resolution, 0.86 × 1.18 × 6.0 mm with a temporal resolution of 3.1 seconds). The phase direction was left to right and no fat saturation was applied. Six unenhanced sets (19 seconds) and approximately 94 contrastenhanced sets of images were acquired over the 5 minutes of scanning to monitor the time course of contrast agent uptake and clearance within the prostate. There was no delay between acquisitions. A total of approximately 1,000 images were obtained during dynamic contrast-enhanced MRI. The entire scanning protocol, combining conventional T2-weighted MRI with dynamic contrast-enhanced MRI, was performed in less than 1 hour. Dynamic Contrast-Enhanced MRI Analysis with a Two-Compartment Pharmacokinetic Model A pharmacokinetic model allows the quantitation of dynamic contrast-enhanced MRI data in terms of parameters that relate to the underlying vascular physiology [12]. The two-compartment pharmacokinetic model we use is based on the principles of Kety in which a low-molecular-weight contrast agent is presumed to diffuse from the vascular space into the extravascular, extracellular space and then leak slowly back into the vascular space [5, 12–14]. The rate of forward leakage, the rate of backward leakage, and the fractional volume of the extracellular space can be calculated from the two-compartment pharmacokinetic model. The archetype of this family of pharmacokinetic models is the two-compartment kinetic model described by Tofts et al. [15], which uses an arterial input function from a nearby artery to adjust for the injection rate and cardiac output and an unenhanced T1 map to generate time–gadolinium concentration plots. This general kinetic model was implemented in a proprietary programming environment (PRIDE software, Philips Medical Systems) using the interface data language (IDL, RSI). We normalized measurements of the gadolinium concentration–time curves to the arterial input function, which was obtained from the adjacent femoral artery [16], and acquired unenhanced T1 maps. To ensure standardization, we first measured individual arterial input function to minimize variations among patients caused by cardiac output and circulation times. Then, we produced the following dynamic contrast-enhanced MRI parameters: Ktrans; kep; ve, the fractional volume of extracellular space per unit volume of tissue; and the area under the gadolinium concentration curve (AUGC) in the W193 10_06_1329_Ocak.fm — 9/27/07 Ocak et al. A B C D E F Fig. 1—Utility of color map in identifying tumor in 52-year-old man with diffuse chronic prostatitis (prostate-specific antigen level = 4.7 ng/mL, Gleason score = 7). A, Transverse high-resolution T2-weighted turbo spin-echo MR image shows diffuse low signal intensity within entire peripheral zone. B and C, Transverse 3D fast-field echo T1-weighted images before (B) and after (C) contrast injection show early signal enhancement in tumor on left anterior peripheral zone. D, Pixel-by-pixel pharmacokinetic analysis was performed in region of interest (ROI) enclosed by white curve. kep (reverse reflux rate constant between extracellular space and plasma) map overlaid on T2-weighted image localizes lesion to left anterior peripheral zone. E and F, Comparison of gadopentetate dimeglumine concentration–versus–time curves obtained from right (E) and left (F) sides of peripheral zone, specified by green and red ROIs in (C), respectively, indicate that wash-in and washout processes were more rapid in tumor. first 90 seconds after injection. This last parameter is not strictly derived from pharmacokinetic analysis but can be readily obtained from the same software. Analysis was performed on a pixel-by-pixel basis and color maps based on these parameters were generated separately and overlaid on the T2weighted images. Image Assessment All scans were assessed by a uroradiologist with 6 years of experience in endorectal prostate MRI and two postdoctoral fellows with less than 1 year of experience. The reviewers were aware that patients had biopsy-proven prostate cancer but were blinded to the exact sextant involved in each case. On the basis of anatomic landmarks on the axial T2-weighted images and corresponding biopsy sites, the prostate gland was divided into the following sextants: left and right bases, middle gland, and apex. T2weighted images were evaluated blindly without knowledge of dynamic contrast-enhanced MR images to verify location, and the results were recorded. W194 Prostate cancer was diagnosed if a low-signal-intensity area in the peripheral zone had at least one of the following characteristics: irregular shape; inhomogeneous signal; or extension outside the capsule on T2-weighted imaging, except areas of postbiopsy hemorrhage, as defined by high signal intensity on unenhanced T1-weighted images, and postbiopsy changes in the gland. After interpretation of the T2weighted MR images, the dynamic contrast-enhanced MR images, obtained in cine mode and with kinetic mapping, were evaluated, and the results of the combined studies were recorded. Pharmacokinetic analysis was performed by a second radiologist who identified the regions of interest (ROIs) and performed the analysis. For pharmacokinetic analysis of dynamic contrast-enhanced MRI, arterial input function curves were obtained by drawing an ROI over the femoral artery included in the image. Another ROI was drawn that included the entire prostate gland, and pharmacokinetic analysis of the prostate gland was performed on a pixel-bypixel basis. After that analysis, each individual sex- tant ROI was drawn to obtain the pharmacokinetic parameters (Fig. 1). T2-weighted images and dynamic contrast-enhanced MRI findings in each sextant of the prostate gland were evaluated to determine the area most suspicious for prostate cancer before placement of ROIs. The mean ± 1 SD of each quantitative parameter was determined in these regions. The size and location of the ROIs were determined by one author using the T2-weighted and dynamic contrast-enhanced MRI scans for each sextant. Dynamic images were converted into color maps reflecting Ktrans, kep, ve, and AUGC, respectively, and the mean values of each parameter were calculated in each sextant. Approximately 45–60 minutes was required to fully analyze the dynamic contrast-enhanced MRI data in each case. Statistical Analysis Measures of diagnostic performance were estimated on a sextant-specific basis. We estimated sensitivity, specificity, positive predictive value (PPV), and negative predictive value (NPV). Ninety-five AJR:189, October 2007 10_06_1329_Ocak.fm — 9/27/07 MRI Diagnosis of Prostate Cancer Based on Pharmacokinetic Parameters TABLE 1: Statistical Analysis Results of T2-Weighted Imaging, Dynamic Contrast-Enhanced MRI, and Both Sequences Combined for the Detection of Prostate Cancer Sensitivity (%) Specificity (%) Positive Predictive Value (%) Negative Predictive Value (%) T2-weighted 94 (89–99) 37 (26–47) 50 (43–57) 89 (78–97) Dynamic contrast-enhanced 73 (62–82) 88 (80–95) 75 (65–85) 75 (68–82) Combined T2-weighted and dynamic contrast-enhanced 70 (59–80) 88 (80–95) 75 (64–84) 74 (67–81) MRI Sequence Evaluated Note—Data in parentheses are estimated 95% CIs using the bootstrap percentile method with 5,000 replicate samples. A B Fig. 2—Prostatitis and hemorrhage masking prostate cancer in right apex in 59-year-old man with Gleason score of 6 and prostate-specific antigen level of 4.5 ng/mL. Biopsy was performed 8 weeks before MRI. A, Transverse T2-weighted image shows diffuse low signal intensity in entire peripheral zone due to prostatitis and hemorrhage. B, Unenhanced transverse 3D fast-field echo T1-weighted image shows diffuse hemorrhage in peripheral zone. C, On this MR image obtained after contrast agent injection, tumor cannot be differentiated from hemorrhagic regions. D, kep (reverse reflux rate constant between extracellular space and plasma [min−1]) map also fails to delineate tumor. C D percent CIs were estimated using the bootstrap percentile method to account for potential correlation between sextants on the same individual. Ktrans, kep, ve, and AUGC were log-transformed. We performed two types of analyses. First, we compared the distribution of the continuous MRI variables (Ktrans, kep, ve, and AUGC) by cancer status at biopsy; this was done descriptively using box plots. Differences in mean levels were tested using a linear mixed model (with a random subject effect); this method accounted for the potential correlation in sextant-specific measurements across individuals. We also examined whether these measurements were influenced by hemorrhage and by PSA using linear mixed models. In the second analysis, we developed a predictor of cancer status based on the MRI variables. A logistic regression modeling approach, which accounts for correlation between sextant measurements on the same subject, was used. This technique is called “generalized estimating equations” (GEE) [17]. In developing this predictor, we included only MRI variables that have a univariate association with cancer with a significance of p < 0.10. We estimated the diagnostic performance of the predictor by estimating the receiver operating characteristic (ROC) curve. To avoid the inherent bias in validating a predictor on the data used to develop the predictor, we used a leave-one-out cross-validation method. In this case, we omitted an individual’s six measurements when predicting that individual’s cancer status. Probability values were adjusted for multiple comparisons. AJR:189, October 2007 Results The overall sensitivity, specificity, PPV, and NPV of T2-weighted images in patients with prostate cancer were 94%, 37%, 50%, and 89%, respectively, and the results for dynamic contrast-enhanced MRI were 73%, 88%, 75%, and 75%, respectively. Dynamic contrast-enhanced MR images interpreted in conjunction with T2-weighted MR images resulted in 70% sensitivity, 88% specificity, 75% PPV, and 74% NPV (Table 1). Dynamic contrast-enhanced MRI and color maps produced with quantitative analysis of dynamic contrast-enhanced MRI were found to be particularly useful in cases in which there was diffuse low signal intensity on T2-weighted images on peripheral zone (Fig. 1). Furthermore, in some cases, postbiopsy hemorrhage also led to a diagnostic challenge on T2-weighted scans and dynamic contrast-enhanced MR images, even though a 5- to 6-week waiting period was part of the protocol (Fig. 2). Hemorrhagic areas were low in W195 10_06_1329_Ocak.fm — 9/27/07 Ocak et al. gression including all variables that were significant in univariate models. The estimated predictor is shown in Appendix 1. Figure 5 provides the ROC curve (appropriately cross-validated) for the multivariate predictor. We see that for a threshold corresponding to a specificity of 80%, the sensitivity is approximately 75%. A B C D Fig. 3—Prostate cancer depicted on T2-weighted and dynamic contrast-enhanced MRI in 56-year-old man with prostate-specific antigen level of 4.8 ng/mL and histologically proven prostate cancer with Gleason score of 7. A, Transverse T2-weighted turbo spin-echo image shows low signal intensity in right apical peripheral zone. B and C, Three-dimensional fast-field echo T1-weighted images before (B) and after (C) contrast agent injection show earlier signal enhancement in tumor. D, Fusion of transverse T2-weighted image with color-encoded Ktrans (forward volume transfer constant) map delineates tumor area. signal on T2-weighted scans and tended to enhance abnormally, at least in part, on dynamic contrast-enhanced MRI, most likely due to the formation of granulation tissue. The pharmacokinetic variable Ktrans was significantly larger for those sextants that had cancer than for those with a healthy peripheral zone (mean difference on log scale = 0.236, p < 0.001). In Figure 3, a typical example of a prostate dynamic contrast-enhanced MR image, a high-resolution TSE T2-weighted MR image, and an image resulting from fusion of a transverse T2-weighted image with color-encoded Ktrans parametric map are illustrated. The variables kep and AUGC were also significantly larger for those sextants with cancer than those with a healthy peripheral zone (mean difference = 0.211, p < 0.001; mean difference = 0.04; p < 0.001, respectively). Figure 4 shows dynamic contrast-enhanced MRI, high-resolution TSE T2-weighted MRI, and a superimposed kep parametric map, along with the whole analysis of data by a pharmacokinetic analytic tool. The W196 variable ve did not differ significantly by cancer status (mean difference = –0.03, p = 0.33). Table 2 presents untransformed mean values by pathology. There was no significant association between elevations in PSA and any of the MRI variables. Furthermore, the differences in these variables by cancer status were not altered by baseline PSA measurements—that is, there was no interaction between cancer status and PSA in this series. We developed a predictor of cancer status based on multiple MRI variables. First, using GEE/logistic regression, we examined which variables had a univariate influence on the probability of cancer. Significant variables were T2-weighted images (p < 0.001), dynamic contrast-enhanced images (p < 0.001), log(Ktrans) (p = 0.007), log(AUGC) (p = 0.002), and log(kep) (p = 0.01). We developed a predictor based on using all four variables in a logistic regression model. Second, a prediction model was developed using GEE/logistic re- Discussion In this study we sought to determine whether dynamic contrast-enhanced MRI at 3 T improves diagnostic performance for the localization of prostate cancer compared with high-resolution T2-weighted MRI. Conventional MRI methods are generally limited in their ability to differentiate prostate cancer from other abnormalities within the peripheral zone. The results of our study show that the addition of dynamic contrast-enhanced MRI to conventional imaging methods improves the localization of prostate cancer in most cases and may improve diagnostic performance, with the pharmacokinetic parameters Ktrans, kep, and AUGC being significantly higher in prostate cancer than normal-appearing peripheral zone. In theory, 3-T MRI could have significant diagnostic advantages over imaging using lower-field-strength magnets. Contemporary fast acquisition techniques can give sufficiently high temporal resolution to sample the fast dynamics observed during contrast enhancement of the prostate gland; however, there may be compromises in SNR as the acquisition time decreases [18]. The higher field strength of 3-T MRI produces an approximately two times higher SNR compared with 1.5 T. This higher field strength allows higher-resolution T2-weighted images and faster dynamic images to be obtained with an SNR comparable to 1.5 T [19]. Some authors have even suggested that the higher field strength of 3-T MRI means that the endorectal coil is no longer necessary. Sosna et al. [20] found image quality at 3 T without an endorectal coil to be comparable to that at 1.5 T with an endorectal coil [20]. We sought to take advantage of the higher SNR by including the endorectal coil. We used Fluorinert to reduce susceptibility artifacts. Conventional MRI examinations of the prostate gland have long included T2weighted MR images for diagnosing prostate cancer. However, the reliability of T2weighted MRI protocols in discriminating prostate cancer from other causes of low signal intensity, such as inflammation, hemor- AJR:189, October 2007 10_06_1329_Ocak.fm — 9/27/07 MRI Diagnosis of Prostate Cancer Based on Pharmacokinetic Parameters A B C D Fig. 4—Prostate cancer depicted on both T2-weighted and dynamic contrast-enhanced MR images of 60-year-old man with prostate-specific antigen level of 7 ng/mL and tumor on left peripheral zone with Gleason score of 7. A, Transverse high-resolution turbo spin-echo T2-weighted image shows homogeneous low signal intensity on left peripheral zone. B and C, Three-dimensional fast-field echo T1-weighted images before (B) and after (C) contrast agent injection show earlier signal enhancement in tumor on left peripheral zone. D, Fusion of transverse T2-weighted image with color-encoded kep (reverse reflux rate constant between extracellular space and plasma) map detects tumor. TABLE 2: Quantitative Dynamic Contrast-Enhanced MRI Parameters of Tumor, Inflammation, and Peripheral Zone of Prostate Κtrans (min–1)a kep (min–1)a ve AUGC (mM Gd × min) 0.47 ± 0.57 1.40 ± 0.99 0.33 ± 0.20 0.19 ± 0.13 Inflammation 0.52 ± 0.43 1.36 ± 0.80 0.36 ± 0.20 0.19 ± 0.14 Normal peripheral zone 0.23 ± 0.25 0.80 ± 0.62 0.30 ± 0.18 0.12 ± 0.09 Prostatic Tissue Tumor Note—Data are mean ± SD. K trans = forward volume transfer constant, kep = reverse reflux rate constant between extracellular space and plasma, ve = the fractional volume of extracellular space per unit volume of tissue, AUGC = area under the gadolinium concentration curve in the first 90 seconds after injection, mM Gd = millimolar gadolinium. a K trans and k values were significantly larger for those sextants that had cancer than for normal peripheral ep zone. rhage, or hyperplasia, is low [21–25]. In our study population, the sensitivity of high-resolution T2-weighted images was 94% in the peripheral zone, but postbiopsy changes and chronic prostatitis resulted in a high falsepositive rate and that resulted in a specificity of only 37%. However, T2-weighted images used in conjunction with dynamic contrast- AJR:189, October 2007 enhanced MRI resulted in higher diagnostic performance, with specificity increasing from 37% to 88%, although sensitivity decreased. T2-weighted MRI is very sensitive for prostate cancer but is not specific. There are many false-positives, as the specificity of 37% implies. Dynamic contrast-enhanced MRI adds specificity because lesions that en- hance and washout rapidly are likely to be prostate cancer. It is not surprising, however, that dynamic contrast-enhanced MRI did not improve the sensitivity of T2-weighted MRI because the latter’s sensitivity was already very high (94%) and many prostate cancers do not enhance sufficiently. Therefore, dynamic contrast-enhanced MRI is mainly useful in determining whether a T2-weighted finding is more likely to be a tumor or a benign process. It was not useful in finding new lesions that were not detectable on T2weighted scans. Dynamic contrast-enhanced MRI is widely used for the diagnosis and staging of various kind of cancers, such as breast carcinoma and liver metastases, and is emerging as a promising method for monitoring tumor response to antiangiogenic treatment [26]. Dynamic contrast-enhanced MRI studies show potential for discriminating between cancer and normal prostatic tissue [27–30]. However, there still appears to be some overlap in the enhancement patterns between tumors and benign areas of the peripheral zone such as those affected by prostatitis, postbiopsy hemorrhage, and benign prostatic hyperplasia. Thus, clinical results of dynamic contrast-enhanced MRI at 1.5 T have been inconsistent, with sensitivities and specificities of detection or staging (or both) varying from 51% to 89% and from 67% to 87%, respectively [31]. The challenge for MRI is to find a means of overcoming these limitations. In our study, sensitivity and specificity of dynamic contrast-enhanced MRI were 73% and 88%, respectively, which fall within the mid range of the reported sensitivities and specificities at 1.5 T [32] (Table 3); however, comparison of our results with those of other studies is difficult because the severity of disease varies with the study population and both estimates of sensitivity and specificity are subject to sampling variation. Nevertheless, the increased specificity provided by performing dynamic contrast-enhanced MRI compared with T2-weighted imaging may be helpful in directing biopsies to high-risk lesions in patients with elevated PSA values but repeatedly negative biopsies. Although all imaging was performed at 3 T with an endorectal coil and a temporal resolution of 3.1 seconds was achieved, dynamic contrast-enhanced MRI still has diagnostic limitations because of the inherently heterogeneous nature of prostate cancer and the potential for multiple microscopic tumor foci within the gland that are beyond the resolution of MRI W197 10_06_1329_Ocak.fm — 9/27/07 Ocak et al. 1.0 Sensitivity 0.8 0.6 0.4 0.2 0.0 0.0 0.2 0.4 0.8 0.6 1.0 1 − Specificity Fig. 5—Diagram shows receiver operating characteristic (ROC) curve obtained by combining T2-weighted images with Ktrans (forward volume transfer constant), kep (reverse reflux rate constant between extracellular space and plasma), and AUGC (area under the gadolinium concentration curve in the first 90 seconds after injection) parameters computed from dynamic contrast-enhanced MRI. ROC curve shows diagnostic performance of generalized estimating equations and logistic regression predictor. Analysis of combination of these parameters yielded 80% specificity and 75% sensitivity; this corresponds to single point on estimated ROC curve. TABLE 3: Reported Prostate Cancer Detection Rates of T2-Weighted and Dynamic Contrast-Enhanced MRI at 1.5 and 3 T T2-Weighted MRI Study [reference no.] Field Strength (T) No. of Patients Sensitivity (%) Schlemmer et al. [38] 1.5 28 79 Futterer et al. [39] 1.5 6 83 83 Girouin et al. [40] 1.5 46 50–60 13–21 Hara et al. [41] 1.5 57 Ito et al. [42] 1.5 111 Specificity (%) 3 37 76 70 Kim et al. [9] 3 20 55 88 Futterer et al. [39] 3 6 100 100 Current study 3 50 94 37 W198 Sensitivity (%) Specificity (%) 68 Miao et al. [43] (Fig. 6). In our study population, patients underwent MRI after at least one positive transrectal sonographically guided biopsy regardless of tumor size. Trauma from this biopsy most likely produced significant morphologic changes in the prostate gland in certain patients. In addition, postbiopsy hemorrhage (even though imaging was delayed 5–6 weeks after the last biopsy) and benign prostatic hyperplasia were challenging issues in the differential diagnosis. Both of these benign entities resulted in an early enhancement pattern (high Ktrans), early washout (high kep), or both, thus Dynamic ContrastEnhanced MRI 78–81 32–56 92.9 96.3 87 74 73 77 73 88 mimicking prostate cancer. In some cases, postbiopsy hemorrhage rendered dynamic contrast-enhanced MRI studies nondiagnostic because the high signal intensity of subacute chronic hemorrhage on unenhanced T1weighted images made it difficult to observe enhancement differences within a tumor. Moreover, in some cases, hemorrhagic prostate regions showed hyperenhancement that was likely related to reparative granulation tissue. Thus, for some patients in our study population, the minimum 5- to 6-week waiting period after biopsy was insufficient for the resolution of either hemorrhage or angiogenesis related to tissue repair. Most patients, however, are unwilling to wait more than 6 weeks because their treatment must be delayed. Quantitative pharmacokinetic analysis of dynamic contrast-enhanced MRI provides information about a tumor’s vascular physiology (i.e., blood flow and permeability of leaky tumor microvessels), which reflects the characteristic rapid wash-in and washout in tumor. It has previously been shown that microvessel density, a marker of angiogenesis, correlates with pathologic staging of prostate cancer better than Gleason score of tumors [33]. Engelbrecht et al. [25] reported that the optimal parameter for discrimination of prostate cancer in the peripheral zone and central gland was relative peak enhancement. Noworolski et al. [34] showed significantly higher peak enhancement, faster enhancement slope, and faster washout slopes in abnormal, as compared with normal, peripheral zone. Barentsz et al. [28] showed that fast dynamic MRI of bladder cancer and most prostate cancer resulted in early enhancement and in some cases a steeper slope, higher maximal signal intensity, and washout as compared with normal tissue. They found differences in enhancement between malignant and other tissues, best seen on the early dynamic images—that is, the first-pass phase of contrast agent administration. Our results are similar to prior findings and show only a modest benefit to using dynamic contrast-enhanced MRI at 3 T versus 1.5 T. Differences between these studies are more likely to be related to patient selection and technical factors rather than to real differences caused by magnetic field strength. However, the results of our study clearly show the benefit of dynamic contrast-enhanced MRI when combined with T2-weighted MRI for the detection of prostate cancer. We also investigated the diagnostic value of quantitative analysis of dynamic contrastenhanced MRI as a means of improving diagnostic performance in prostate cancer. The mean values of quantitative parameters were higher in biopsy-proven cancer areas and there were statistically significant differences between normal tissue and prostate cancer for the parameters Ktrans, kep, and AUGC in concordance with these studies. Multivariate analysis showed that a combination of all parameters improved the overall sensitivity and specificity of the T2-weighted and dynamic contrast-enhanced MRI studies. Color maps produced from this analysis have AJR:189, October 2007 10_06_1329_Ocak.fm — 9/27/07 MRI Diagnosis of Prostate Cancer Based on Pharmacokinetic Parameters A B C D Fig. 6—65-year-old man with prostate-specific antigen level of 8 ng/mL and histologically proven prostate cancer in left base with Gleason score of 6. Normal enhancement within peripheral zone masks small prostate cancer. A and B, Coronal (A) and transverse (B) T2-weighted turbo spin-echo images show normal-appearing peripheral zone and no evidence of hemorrhage. C, Three-dimensional fast-field echo T1-weighted image obtained after contrast agent injection shows homogeneous enhancement in entire peripheral zone. D, Fusion of T2-weighted transverse image with color-encoded Ktrans (forward volume transfer constant) map is also normal. also been useful in the localization of tumors in the peripheral zone in cases with barely discernible contrast enhancement on dynamic contrast-enhanced MRI. Nevertheless, kinetic parameters in both malignant and benign peripheral zones still showed considerable overlap, which points to a high intrinsic interpatient variability in the vascular permeability and surface area, blood volume, and blood flow for both malignant and benign prostatic tissues. However, because the blood flow within the tumor tissue is heterogeneous, particularly in prostate cancer in which there is a high ratio of immature vessels, it is hard to determine an absolute cutoff value for these parameters. We developed a multivariate predictor based on T2-weighted and dynamic contrast-enhanced MRI and pharmacokinetic modeling parameters. A cross-validated assessment of diagnostic performance suggests that the predictor performs well in predicting sextant-specific AJR:189, October 2007 prostate cancer. The next step in validating this predictor is to assess its performance prospectively on an independent cohort of patients. The dynamic contrast-enhanced MRI appearances of chronic and acute prostatitis are yet to be fully documented in the literature. In this study, there were a total of 17 sextants with chronic or acute prostatitis. All showed diffuse low signal intensity on T2-weighted images. Nine (53%) of these 17 sextants showed early enhancement and early washout on dynamic contrast-enhanced MRI, resulting in false-positive interpretations. We also looked at the differences in the pharmacokinetic parameters of chronic and acute prostatitis. In both cases, values of Ktrans, kep, ve, and AUGC were very close to the results for prostate cancer, which means these benign prostate entities still remain a challenge for the differential diagnosis and guidance of therapy based on dynamic con- trast-enhanced MRI. Previous studies have also reported considerable overlap between prostatitis and prostate cancer when using MR spectroscopic imaging [35]. Therefore, a major limitation of MRI in the assessment of prostate cancer is its restricted ability to differentiate between prostatitis and cancer. Thus, regardless of the technique used, MRI will likely continue to falsely identify some benign disorders (e.g., prostatitis, benign prostatic hyperplasia) as prostate cancer. An important limitation of our study is that we used transrectal sonographically guided biopsy as the method of validation, which could have led to misinterpretation of the exact locations of tumors. Thus, sextants that were deemed normal in this study may actually have contained a tiny focus of cancer [36]. We used transrectal sonographically guided biopsy as the standard because many of our patients went on to receive treatment with radiation therapy and whole specimens were not obtained. Thus, by using biopsy material as the reference standard and including future radiation therapy–receiving patients as study subjects, we were able to include a more balanced group of patients than would have been possible if only surgical patients had been selected. In addition, even within 5 weeks of biopsy, there can still be considerable postbiopsy artifact on MRI. However, this is a practical limitation of such studies because it is unethical to delay treatment for longer periods of time for a research MRI study. Moreover, it would be highly inefficient to perform MRI before biopsy because many men who undergo prostate biopsy do not have prostate cancer. It is possible that a pulse sequence such as diffusion-weighted MRI or magnetization transfer may be less influenced by traumatic changes; however, this theory remains to be proven, and to date, all the most commonly performed MR sequences are subject to the effects of biopsy. We should also note that pathologists can differ in their interpretations of core biopsy specimens, although most disagreements are in assigning Gleason scores and not in determining whether cancer is present or not [37]. In this study variability was minimized by relying on a single experienced pathologist. In summary, the results of this study show that dynamic contrast-enhanced MRI performed at 3 T greatly increases the specificity of conventional MRI. Dynamic contrast-enhanced MRI–derived pharmacokinetic parameters are significantly associated with prostate cancer. The ROC curves based on W199 10_06_1329_Ocak.fm — 9/27/07 Ocak et al. these data suggest that optimally set points for multiparametric analysis result in a sensitivity of 78% and specificity of 88% for prostate cancer. This is in keeping with the experience of other studies at 1.5 T and points to an absolute “ceiling” for the detection of prostate cancer using dynamic contrast-enhanced MRI. Certainly for many patients, the combination of T2-weighted MRI and dynamic contrast-enhanced MRI yields improved results at 3 T, but not for all. It is hoped that the evolving field of molecular imaging may provide improved answers to the problem of localizing prostate cancer; the molecular targeting of imaging agents to specific cell surface markers overexpressed by cancer cells using PET, radionuclides, or MRI-targeted contrast agents may someday help localize prostate cancers. Acknowledgments We thank Yolanda McKinney, Jim Sedlacko, and Anurag K. Singh for their support in this research. References 1. Jemal A, Siegel R, Ward E, et al. Cancer statistics, 2006. CA Cancer J Clin 2006; 56:106–130 2. Yancik R. Epidemiology of cancer in the elderly: current status and projections for the future. Rays 1997; 22:3–9 3. Rogerson PA, Sinha G, Han D. Recent changes in the spatial pattern of prostate cancer in the U.S. Am J Prev Med 2006; 30[suppl 2]:S50–S59 4. van Dorsten FA, van der Graaf M, Engelbrecht MR, et al. Combined quantitative dynamic contrast-enhanced MR imaging and (1)H MR spectroscopic imaging of human prostate cancer. J Magn Reson Imaging 2004; 20:279–287 5. Knopp MV, Giesel FL, Marcos H, von TenggKobligk H, Choyke P. Dynamic contrast-enhanced magnetic resonance imaging in oncology. Top Magn Reson Imaging 2001; 14:301–308 6. Kim JK, Hong SS, Choi YJ, et al. Wash-in rate on the basis of dynamic contrast-enhanced MRI: usefulness for prostate cancer detection and localization. J Magn Reson Imaging 2005; 22:639–646 7. Li H, Sugimura K, Kaji Y, et al. Conventional MRI capabilities in the diagnosis of prostate cancer in the transition zone. AJR 2006; 186:729–742 8. Kiessling F, Lichy M, Grobholz R, et al. Simple models improve the discrimination of prostate cancers from the peripheral gland by T1-weighted dynamic MRI. Eur Radiol 2004; 14:1793–1801 9. Kim CK, Park BK, Kim B. Localization of prostate cancer using 3T MRI: comparison of T2-weighted and dynamic contrast-enhanced imaging. J Comput W200 Assist Tomogr 2006; 30:7–11 10. Rouviere O, Hartman RP, Lyonnet D. Prostate MR imaging at high-field strength: evolution or revolution? Eur Radiol 2006; 16:276–284 11. Deoni SC, Peters TM, Rutt BK. High-resolution T1 and T2 mapping of the brain in a clinically acceptable time with DESPOT1 and DESPOT2. Magn Reson Med 2005; 53:237–241 12. Choyke PL, Dwyer AJ, Knopp MV. Functional tumor imaging with dynamic contrast-enhanced magnetic resonance imaging. J Magn Reson Imaging 2003; 17:509–520 13. Brix G, Semmler W, Port R, Schad LR, Layer G, Lorenz WJ. Pharmacokinetic parameters in CNS Gd-DTPA enhanced MR imaging. J Comput Assist Tomogr 1991; 15:621–628 14. Furman-Haran E, Margalit R, Grobgeld D, Degani H. Dynamic contrast-enhanced magnetic resonance imaging reveals stress-induced angiogenesis in MCF7 human breast tumors. Proc Natl Acad Sci U S A 1996; 93:6247–6251 15. Tofts PS, Brix G, Buckley DL, et al. Estimating kinetic parameters from dynamic contrast-enhanced T(1)-weighted MRI of a diffusable tracer: standardized quantities and symbols. J Magn Reson Imaging 1999; 10:223–232 16. Rijpkema M, Kaanders JH, Joosten FB, van der Kogel AJ, Heerschap A. Method for quantitative mapping of dynamic MRI contrast agent uptake in human tumors. J Magn Reson Imaging 2001; 14:457–463 17. Liang KY, Zeger SL. Longitudinal data analysis using generalized linear models. Biometrika 1986; 73:12–22 18. Huisman HJ, Engelbrecht MR, Barentsz JO. Accurate estimation of pharmacokinetic contrast-enhanced dynamic MRI parameters of the prostate. J Magn Reson Imaging 2001; 13:607–614 19. Futterer JJ, Scheenen TW, Huisman HJ, et al. Initial experience of 3 Tesla endorectal coil magnetic resonance imaging and 1H-spectroscopic imaging of the prostate. Invest Radiol 2004; 39:671–680 20. Sosna J, Pedrosa I, Dewolf WC, Mahallati H, Lenkinski RE, Rofsky NM. MR imaging of the prostate at 3 Tesla: comparison of an external phased-array coil to imaging with an endorectal coil at 1.5 Tesla. Acad Radiol 2004; 11:857–862 21. Quint LE, Van Erp JS, Bland PH, et al. Carcinoma of the prostate: MR images obtained with body coils do not accurately reflect tumor volume. AJR 1991; 156:511–516 22. Quint LE, Van Erp JS, Bland PH. Prostate cancer: correlation of MR images with tissue optical density at pathologic examination. Radiology 1991; 179:837–842 23. Lovett K, Rifkin MD, McCue PA, Choi H. MR imaging characteristics of noncancerous lesions of the prostate. J Magn Reson Imaging 1992; 2:35–39 24. Schiebler ML, Tomaszewski JE, Bezzi M, et al. Prostatic carcinoma and benign prostatic hyperplasia: correlation of high-resolution MR and histopathologic findings. Radiology 1989; 172:131–137 25. Engelbrecht MR, Huisman HJ, Laheij RJ, et al. Discrimination of prostate cancer from normal peripheral zone and central gland tissue by using dynamic contrast-enhanced MR imaging. Radiology 2003; 229:248–254 26. Hayes C, Padhani AR, Leach MO. Assessing changes in tumour vascular function using dynamic contrast-enhanced magnetic resonance imaging. NMR Biomed 2002; 15:154–163 27. Jager GJ, Ruijter ET, van de Kaa CA, et al. Dynamic turboFLASH subtraction technique for contrast-enhanced MR imaging of the prostate: correlation with histopathologic results. Radiology 1997; 203:645–652 28. Barentsz JO, Engelbrecht M, Jager GJ, et al. Fast dynamic gadolinium-enhanced MR imaging of urinary bladder and prostate cancer. J Magn Reson Imaging 1999; 10:295–304 29. Jager GJ, Ruijter ET, van de Kaa CA, et al. Local staging of prostate cancer with endorectal MR imaging: correlation with histopathology. AJR 1996; 166:845–852 30. Liney GP, Turnbull LW, Knowles AJ. In vivo magnetic resonance spectroscopy and dynamic contrast enhanced imaging of the prostate gland. NMR Biomed 1999; 12:39–44 31. Yu KK, Hricak H. Imaging prostate cancer. Radiol Clin North Am 2000; 38:59–85, viii 32. Coakley FV, Kurhanewicz J, Lu Y. Prostate cancer tumor volume: measurement with endorectal MR and MR spectroscopic imaging. Radiology 2002; 223:91–97 33. Brawer MK, Deering RE, Brown M, Preston SD, Bigler SA. Predictors of pathologic stage in prostatic carcinoma: the role of neovascularity. Cancer 1994; 73:678–687 34. Noworolski SM, Henry RG, Vigneron DB, Kurhanewicz J. Dynamic contrast-enhanced MRI in normal and abnormal prostate tissues as defined by biopsy, MRI, and 3D MRSI. Magn Reson Med 2005; 53:249–255 35. Shukla-Dave A, Hricak H, Eberhardt SC, et al. Chronic prostatitis: MR imaging and 1H MR spectroscopic imaging findings—initial observations. Radiology 2004; 231:717–724 36. Wefer AE, Hricak H, Vigneron DB, et al. Sextant localization of prostate cancer: comparison of sextant biopsy, magnetic resonance imaging and magnetic resonance spectroscopic imaging with step section histology. J Urol 2000; 164:400–404 37. Lessells AM, Burnett RA, Howatson SR. Observer variability in the histopathological reporting of needle biopsy specimens of the prostate. Hum Pathol 1997; 28:646–649 AJR:189, October 2007 10_06_1329_Ocak.fm — 9/27/07 MRI Diagnosis of Prostate Cancer Based on Pharmacokinetic Parameters 38. Schlemmer HP, Merkle J, Grobholz R. Can preoperative contrast-enhanced dynamic MR imaging for prostate cancer predict microvessel density in prostatectomy specimens? Eur Radiol 2004; 14:309–317 39. Futterer JJ, Heijmink SW, Scheenen TW. Prostate cancer: local staging at 3-T endorectal MR imaging—early experience. Radiology 2006; 238:184–191 40. Girouin N, Mège-Lechevallier F, Tonina Senes A, et al. Prostate dynamic contrast-enhanced MRI with simple visual diagnostic criteria: is it reasonable? Eur Radiol 2007; 17:1498–1509 41. Hara N, Okuizumi M, Kawaguchi M, Bilim V. Dynamic contrast-enhanced magnetic resonance imaging (DCE-MRI) is a useful modality for the precise detection and staging of early prostate cancer. Prostate 2005; 62:140–147 42. Ito H, Kamoi K, Yokoyama K, Yamada K, Nishimura T. Visualization of prostate cancer using dynamic contrast-enhanced MRI: comparison with transrectal power Doppler ultrasound. Br J Radiol 2003; 76:617–624 43. Miao H, Fukatsu H, Ishigaki T. Prostate cancer detection with 3-T MRI: comparison of diffusionweighted and T2-weighted imaging. Eur J Radiol 2007; 61:297–302 APPENDIX 1: Logistic Regression Model We developed a predictor of cancer status based on using all four variables in a logistic regression model. The estimated predictor is as follows: trans exp { – 2.2 + 1.19T2WI + 2.24DCE – 0.56 log ( K ) + 1.88 log ( AUGC + 0.5 ) + 0.68 log ( k ep ) } P ( Cancer ) = -------------------------------------------------------------------------------------------------------------------------------------------------------------------------------------------------------------------------------------------------------------trans [ 1 + exp { – 2.2 + 1.19T2WI + 2.24DCE – 0.56 log ( K ) + 1.88 log ( AUGC + 0.5 ) + 0.68 log ( k ep ) } ] where P(Cancer) is prostate cancer, exp is exponent, T2WI is T2-weighted MRI, DCE is dynamic contrast-enhanced MRI, Ktrans is forward volume transfer constant (min−1), AUGC is area under the gadolinium concentration curve in the first 90 seconds after injection, and kep is reverse reflux rate constant between extracellular space and plasma (min–1). The variables T2-weighted MRI, dynamic contrast-enhanced MRI, log(Ktrans), and log(kep) were all statistically significant in the multivariate model (p = 0.03, p < 0.001, p = 0.01, and p = 0.05, respectively), suggesting that the predictive ability of the multivariate model improves over what can be achieved with a single pharmacokinetic parameter. AJR:189, October 2007 W201
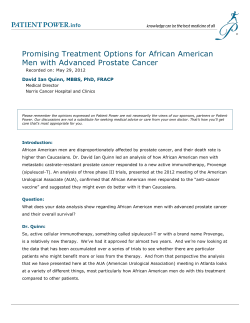
© Copyright 2026 Paperzz