SPM short course
Functional integration and connectivity
Christian Büchel
Karl Friston
The Wellcome Department of Cognitive Neurology, UCL
London UK http//:www.fil.ion.ucl.ac.uk/spm
Data analysis
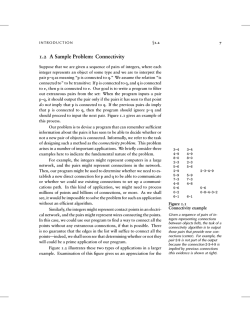
fMRI time-series
Kernel
p <0.05
Design matrix
Inference with Gaussian
field theory
Realignment
Smoothing
General linear model
Normalisation
Adjusted regional data
Template
Parameter estimates
spatial modes and
effective connectivity
Functional brain architectures
Functional segregation
Univariate analyses of regionally
specific effects
Functional connectivity
“the temporal correlation between
neurophysiological events”
an operational definition
Functional integration
Multivariate analyses of
regional interactions
Effective connectivity
“the influence one neuronal system
exerts over another”
a model-dependent definition
Issues in functional integration
• Functional Connectivity
Eigenimage analysis and PCA
• Effective Connectivity
Psychophysiological Interactions
State space Models (Variable parameter regression)
Structural Equation Modelling
Volterra series
Effective vs. functional connectivity
Model:
A = V1 fMRI time-series
B = 0.5 * A + e1
C = 0.3 * A + e2
Correlations:
B
0.49
A
Correct
model
-0.02
2=0.5, ns.
0.31
C
A
1
0.49
0.30
B
C
1
0.12
1
Eigenimages - the basic concept
A time-series of 1D images
128 scans of 40 “voxels”
Expression of 1st 3 “eigenimages”
Eigenvalues and spatial “modes”
The time-series ‘reconstituted’
Eigenimages and SVD
V1
voxels
V2
U1
Y
(DATA)
=
s1
V3
U2
APPROX.
OF Y
+ s2
U3
APPROX.
OF Y
+ s3
APPROX.
OF Y
time
Y = USVT = s1U1V1T + s2U2V2T + ...
+ ...
An example from PET
Eigenimage analysis of a
PET word generation study
Word generation G
Word repetition R
R G R G R G.........
Dynamic changes in effective connectivity
Attentional modulation of V5 responses to visual motion
• Psychophysiological interactions
Attentional modulation of V2 to V5 connections
• State space models and variable parameter regression
Attentional modulation of V5 to PPC connections
• Models of effective connectivity
The mediating role of posterior parietal cortex
in attentional modulation
Structural Equation modelling
Volterra formulation
The fMRI study
Stimuli
250 radially moving dots at 4.7 degrees/s
Pre-Scanning
5 x 30s trials with 5 speed changes (reducing to 1%)
Task - detect change in radial velocity
Scanning (no speed changes)
6 normal subjects, 4 100 scan sessions;
each session comprising 10 scans of 4 different condition
e.g. F A F N F A F N S .................
F - fixation point only
A - motion stimuli with attention (detect changes)
N - motion stimuli without attention
S - no motion
Psychophysiological
interactions:
Attentional modulation of
V2 -> V5 influences
V5 activity
SPM{Z}
Attention
V2
V5
V5 activity
time
attention
no attention
V2 activity
Attention
Fixation
No attention
bt
regression coefficient
Regression with time-varying coefficients
0.8
0.5
Fixed regression model (one coefficient for entire time-series)
y = x*b + e
Time varying regression model (coefficient changes over time)
yt = xt.bt + et
bt = bt-1+ht
Coefficient b of the explanatory variable (V5) is modelled
as a time-varying random walk. Estimation by Kalman filter.
Time (scans)
x = V5
y = PP
The source of modulatory afferents
“Modulatory” sources
identified as regions
correlated with bt
Anterior cingulate
Dorsolateral prefrontal cortex
R
R
p<0.05 corrected
Structural equation modelling (SEM)
Minimise the difference between the observed (S) and implied () covariances by adjusting the path
coefficients (a, b, c)
The implied covariance structure:
x
= x.B + z
x
= z.(I - B)-1
x : matrix of time-series of regions U, V and W
B: matrix of unidirectional path coefficients (a,b,c)
Variance-covariance structure:
xT . x =
= (I-B)-T. C.(I-B)-1
where C
= zT z
u
v
a
U
V
c
b
W
w
xT.x is the implied variance covariance structure
C contains the residual variances (u,v,w) and covariances
The free parameters are estimated by minimising a [maximum likelihood] function of S and
Attention - No attention
0.43
0.75
0.47
0.76
No attention
Attention
The use of moderator or interaction variables
2 =11, p<0.01
PP
V1
0.14
V5
=
V1xPP
Modulatory influence of parietal cortex on V1 to V5
V5
Hierarchical architectures
PP
0.2
V5
2=13.6, p<0.01
2=5.9, p<0.01
0.1
V1
LGN
PFC
Changes in effective connectivity over time: Learning
• Paired associates learning
• Pairing
– Object (Snodgrass) with
– Location
• fMRI, 48 axial slices, TR 4.1s, 8 scans/cond
• 8 cycles (E)ncoding (C)ontrol (R)etrieval
• 3 sessions (each with new objects & locations)
E
PP
ITp
LP
DE
V1
ITp
V1
R
E
R
ITa
C
C
C
SEM: Encoding Early vs. Late
PP
0.41
0.61
LP
0.15
V1
0.45
LP
DE
DE
0.57
PP
0.37
0.59
2 =6.3
p<0.05
diff. = 0.16
-0.03
0.46
Early
0.26
0.35
ITa
Single subjects:
+0.27*, +0.21, +0.37*,
+0.24*, +0.19, +0.31*
* p < 0.05
Late
V1
0.38
ITp
0.13
ITp
0.27
ITa
Changes in effective connectivity predict
learning
0.4
% correct
learning rate k
1
r = 0.64
k = .35
k = .60
k = .63
k=.95
k = .71
k =.44
learning block
1
2
3
4
5
6
7
Length of EARLY (in learning blocks) that maximised the
EARLY vs. LATE difference in connectivity (PP -> ITP)
input[s] u(t)
[u(t)]
response y(t)
Regional activities
kernels (h)
Volterra series - a general nonlinear input-output model
y(t)
n[u(t)]
= 1[u(t)] + 2[u(t)] + .... + n[u(t)] + ....
= .... hn(t1,..., tn)u(t - t1) .... u(t - tn)d t1 .... d tn
estimate
Volterra series approximation
• Trying to explain activity in region A by
– past and present activity in other regions (1st order)
• direct effects (eg. effect of B on A)
– past and present activity in other regions (pairwise = 2nd order)
• non-linear (eg. effect of B2 on A)
• modulatory (eg. effect of AB on A)
– A = a1B + a2C + a3AA + a4BB + a5CC + a6AB + a7AC + a8BC
– All terms can be seen as regressors and their impact can be tested with the general linear
model
– direct effect of B on A : B and BB as covariates of interests, others confounds
– modulatory effect of B on A : AB and BC as covariates of interest, others confounds
PPC
IFS
V3a
PPC
FEF
V5
areas showing attentional effects
PPC
V1/V2
V5
Pul
regional interactions examined
Changes in V5 response to V2
inputs with PPC activity
i.e. a modulatory (activity-dependent)
component of V5 responses
PPC activity = 1
SPM{F}
PPC activity = 0
© Copyright 2026 Paperzz