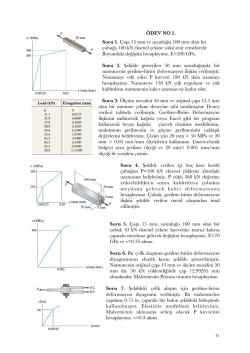
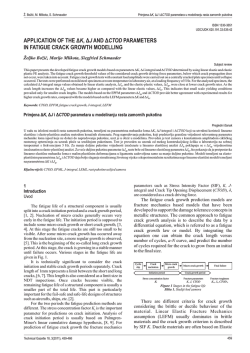
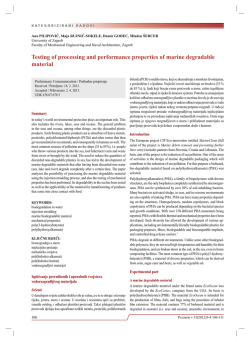
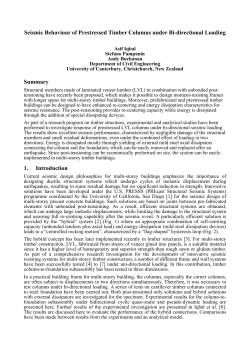
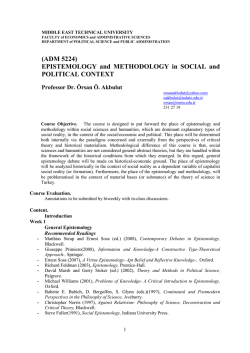
...... Merhar, Gornik Bučar, Bučar: Mode I Critical Stress Intensity Factor of Beech Wood... Miran Merhar, Dominika Gornik Bučar, Bojan Bučar†1 Mode I Critical Stress Intensity Factor of Beech Wood (Fagus Sylvatica) in a TL Configuration: A Comparison of Different Methods Faktor kritičnog intenziteta naprezanja (I. mod) bukovine (Fagus sylvatica) u TL presjeku: usporedba različitih metoda Original scientific paper - Izvorni znanstveni rad Received – prispjelo: 17. 12. 2012. Accepted – prihvaćeno: 21. 6. 2013. UDK: 630*812.7; 674.031.632.22 doi:10.5552/drind.2013.1253 ABSTRACT • The paper presents a comparison between various methods of mode I critical stress intensity factor KIC calculations of beech wood in the TL configuration. The first method is the stress intensity factor extrapolation to the distance of 0 mm from the crack tip; the second method is the use of the J integral; and the third method is based on the differences in deformation energies from which the strain energy release rate per unit of crack propagation length was obtained. The fourth method is the calculation of material deformation around the crack or the displacement of the triangle element node; and the fifth method uses a generally known equation for the CT specimen for plane-strain conditions in isotropic material. Using the finite element method, it was found that the J integral was least sensitive to the size and shape of the elements. It was used to calculate the critical stress intensity factor KIC for beech wood in a TL configuration. The average value is 0.56 MPa√m with a standard deviation of 0.047 MPa√m. Keywords: fracture toughness, mode I critical stress intensity factor, fracture mechanics, beech wood SAŽETAK • Rad donosi usporedbu različitih metoda izračuna faktora kritičnog intenziteta naprezanja (mod I.) KIC za bukovo drvo na tangencijalno-longitudinalnom (TL) presjeku. Prva je metoda ekstrapolacija faktora intenziteta naprezanja na udaljenosti 0 mm od vrha pukotine, druga je primjena, J integrala a treća se metoda temelji na razlikama energija deformacije iz kojih je dobivena brzina oslobađanja energije deformacije po jedinici duljine širenja pukotine. Četvrta metoda temelji se na izračunu deformacije materijala oko pukotine ili pomaka vrhova elementa trokuta, a peta se koristi općepoznatom jednadžbom za CT uzorak za deformaciju u ravnini izotropnog materijala. Koristeći se metodom konačnih elemenata, utvrđeno je da je metoda J integrala najmanje osjetljiva na veličinu i oblik elemenata. Ta je metoda primijenjena za izračun faktora kritičnog naprezanja KIC za bukovo drvo na TL presjeku. Dobivena je prosječna vrijednost od 0,56 MPa·√m, sa standardnom devijacijom od 0,047 MPa·√m. Ključne riječi: lomna žilavost, faktor kritičnog intenziteta naprezanja (mod I.), mehanika loma, bukovina 1 Authors are assistant, assistant professor and associate professor† at Department of Wood Science and Technology, Biotechnical Faculty, University of Ljubljana, Ljubljana, Slovenia. 1 Autori su asistent, docentica i izvanredni profesor† Odjela za znanost o drvu i tehnologiju, Biotehnički fakultet, Sveučilište u Ljubljani, Ljubljana, Slovenija. DRVNA INDUSTRIJA 64 (3) 221-229 (2013) 221 Merhar, Gornik Bučar, Bučar: Mode I Critical Stress Intensity Factor of Beech Wood... 1 INTRODUCTION 1. UVOD Wood fracture has already been studied by several researchers. Porter (1964) measured critical strain energy release rate GIC by measuring the force and length of crack in white pine. The specimens were TL and RL-oriented, which means that he loaded them in tangential and radial directions, respectively, and the crack propagated in a longitudinal direction. He researched the influence of length, thickness, and height of the specimen, as well as the crack length. The method of determining the critical strain energy release rate GIC in pines was also studied by Stanzl-Tschegg et al. (1995). They calculated the strain energy release rate GI by integrating the energy or the area under the curve, which describes the force depending on the specimen mouth opening. The energy obtained was divided by the size of the newly formed surface. Thuvander and Berglund (2000) researched pine fracture in the TR orientation. They stated that KIC of silver fir wood in the TR orientation was between 30 % and 50 % higher than that in the TL direction, while in the case of pine and spruce the difference was supposed to be even greater. As the newly formed surface proved to be equal in the TR and TL orientations, i.e., in the RL plane, they wanted to know the reason for such great differences in KIC. Fresh specimens were used because in dry specimens they encountered the problem of stable fracture due to microcracks resulting from the drying process. According to them, a specimen that has been dried and humidified again has a more brittle fracture due to microcracks formed during the process of drying. Similar tests in the TR orientation were also performed by Frühman et. al. (2003). The influence of the moisture content of wood on KIC was also researched by many researchers (Ozyhar et. al. (2012), Reiterer and Tschegg (2002), Scheffler et.al. (2004), Vasić and Stanzl-Tschegg (2007), Yeh and Schniewind (1992)). They found that with increasing moisture content, the critical stress intensity factor in the RL and TR orientation decreases. Vasić and Stanzl-Tschegg (2007) report a value of 0.9 MPa·√m with 6 % moisture content of beech wood in the RL configuration, and the value of 0.62 MPa·√m with 12 % moisture content. In their work, Stanzl-Tschegg and Navi (2009) sum up their research of wood fracture in the RL configuration under various conditions such as moisture and density of wood, combined fracture modes I and II, and loading rate. They mention the work of Beikircher who thermally modified wood and found that thermal modification of beech decreases KIC for the TL configuration from 0.8 MPa·√m to 0.6 MPa·√m. Likewise, Stanzl-Tschegg and Navi (2009) state that KIC in the RL orientation is higher compared to the TL orientation because of the ’bridging’ effect that the parenchyma causes in a radial direction. Majano-Majano et.al. (2012) found 222 . ..... that KIC of thermally modified beech wood in RL and TL configuration decreases and found that the KIC for unmodified beech in TL configuration form ranged from 0.44 to 0.63 MPa·√m. To determine the fracture properties of wood, the majority of the aforementioned authors use the critical strain energy release rate GIC, determining the energy necessary for the formation of new surfaces on the basis of the force and mouth opening. A prerequisite for an experiment of this kind is a stable advance of the fracture, which means that the crack propagates in proportion to the crack mouth opening. However, the problem in the case of beech wood in the TL configuration is that after initiation the fracture process is distinctly unstable, during which the crack suddenly propagates to a certain unbalanced length. GIC does in fact express the energy to be put in per unit of the newly formed surface, but provides little information about the fracture initiation, which is of essential significance in cutting. Under certain conditions, the result can be a chip of type I, II, or III, as classified by Franz (Koch, 1985). Regarding the material which is turned into a chip, a type I chip is discontinued, formed by alternating fracture and bending failures (Merhar and Bučar, 2012). Whether the fracture under the chip will progress or the chip will break depends on the critical stress intensity factor for fracture mode I. It was, therefore, decided to determine the KIC of beech wood for the TL configuration in the manner enabling a direct determination of the value. First, the KIC was going to be determined on one specimen using the five most frequently used methods. The results obtained were going to be used to determine the most suitable method that yielded a satisfactory result in a simple manner. The method obtained in this way would be used to determine the fracture toughness of the remaining specimens. 2 MATERIAL AND METHODS 2.MATERIJALI I METODE Beech wood (Fagus sylvatica) specimens were taken from a peripheral part of one stem of 400 mm in diameter. The specimens moisture content was (9 ± 0.5) %, with a density of 630 kg/m3. A conventional compact tension CT specimen (Hertzberg, 1996) of 115 mm in length, 100 mm in height, and 10 mm thick was made. The specimens were TL-oriented, which means that load was applied in a tangential direction, and the crack propagated longitudinally. Since the board used to make specimens was only 80 mm thick, an additional 10 mm thick strip of wood was glued to each side of the specimen. The glued-on strip was obtained from the immediate vicinity of the specimen so that it had similar mechanical properties. The obtained CT specimen was modified to enable the mounting of the crack mouth opening displacement meter as shown in Figure 1a. DRVNA INDUSTRIJA 64 (3) 221-229 (2013) ...... Merhar, Gornik Bučar, Bučar: Mode I Critical Stress Intensity Factor of Beech Wood... a) b) Figure 1 a) Experiment, b) Modified CT specimen Slika 1. a) Skica eksperimenta, b) modificirani CT uzorak A cut of approximately 56 mm in length was made in the specimen (Figure 1b). Then a razor blade was used to make a further 1 mm to 2 mm deep cut to obtain a sharp tip of the cut. After fracturing, the initial crack length was measured on each specimen. The crack mouth opening displacement meter was made of two 1 mm thick and 90 mm long spring steel gauges. The length of the gauges was determined so as to make the meter measuring range of 10 mm, whereby the stress inside the gauge as a result of bending did not exceed 200-300 MPa. In this case each gauge was deformed by 5 mm. Strain gauges type 3/120LG11 produced by HBM, with the resistance of 120 W, were glued on the upper and lower side of both steel gauges, at the beginning or at the place of the maximum bending moment, and connected to the MES HPSC 3102 amplifier with full-bridge configuration. The displacement meter was calibrated by means of a reference dial gauge with the accuracy of 0.01 mm. The specimen was placed on the tensile testing machine where the loading force was measured by a dynamometer, and the crack mouth opening displacement was measured by the previously described displacement meter. Data were captured by means of a personal computer, NI PCI-6014 measurement card and LabView software by National Instruments. The data capturing rate was 200 Hz, and the mouth opening velocity 15 mm/min. The intersection of the measured data and a straight line with a 5 % smaller angle than the straight line representing a linear regression curve of the initial elastic part of the specimen loading, as laid down by the ASTM E 399 standard, was read from the measured data. At the same time the maximum force measured was read. When the maximum force was greater than the intersection of the measured data and straight line, or the difference between the value at the intersection and the maximum measured value was minimal, the DRVNA INDUSTRIJA 64 (3) 221-229 (2013) maximum force measured was taken into account for the calculation. The specimen was modelled by the finite element method using the Ansys program. The orthotropic properties of the wood were taken into consideration. The measured modulus of elasticity in a longitudinal direction, which has the greater influence on the KIC calculation, was used in the model, while the data for moduli of elasticity in other directions, shear moduli and Poisson’s ratios, which have minor influence on the KIC calculation, were taken from Kollmann and Cote (1984). Thus: EL = 14490 MPa, ET = 1140 MPa, ER = 2240 MPa, nLT = 0.518, nTR = 0.36, nLR = 0.45, GLT = 1055 MPa, GTR = 460 MPa, GLR = 1600 MPa. (1) Since the aim of the first part of the research was to investigate the accuracy of determining the mode I critical stress intensity factor KIC, the specimen was modelled with a linear elastic plane-strain state, where the modelled specimen thickness was 10. A PLANE183 higher-order 2D, 8-node brick element was used. The specimen had elements of 2mm and 1mm in size, with a combination of finer elements around the crack tip or special triangle elements for calculating the stress at the crack tip with an intermediate node at ¼ of the element’s length. The tip of the crack was surrounded by two rows of 12 triangle elements each, whereby the elements length was 0.1 mm or 1/1000 of the crack length. The ratio between the size of the first row and the second one was set as 1.5. 223 J = (Wd dy − T Γ ∂u ds ) ∂x Merhar, Gornik Bučar, Bučar: Mode I Critical Stress Intensity Factor of Beech Wood... . ..... Γ is integration path, and Wd is deformation energy per The mode I critical stress intensity factor KIC was calculated by five different and most frequently used methods of determining the critical stress intensity factor. The results of the comparison of these five methods were used to determine the most accurate and simple method, and this method was subsequently used to calculate the critical stress intensity factor for the remaining specimens. The first method used to calculate the critical stress intensity factor KIC was the stress intensity factor extrapolation to the distance of zero using equation 2 (Broek, 1989) K = lim 2 ⋅ π ⋅ r ⋅ s y r →0 1 Wd = σ ij ε ij , 2 T is stress vector acting perpendicularly on conT is stress vector perpendicularly on contour Γ, tour G, u is deformation vector, and acting ds is the G path differential. differential. (2) where r is the distance from the crack tip, and sy is stress in y direction as shown in Figure 2, and it is expressed as follows sy = 3q K q q ⋅ cos ⋅ 1 + sin ⋅ sin 2 2 2 2πr (5) (3) Figure 3 J integral Figure 3 J integral Slika 3. J integral Slika 3. J integral Figure 3 J integral The value of the J integral was calculated by means of the A Slika 3. JThe integral value of the J integral was calculated by means of the Ansys Γ contour nodes were defined. Γ value contour Thethat of nodes the Jwere integral was calculated by but due Since theSince specimen was TL-oriented, this means this means the specimen was TL-oriented, it was loaded in defined. a tangential direction, Since the specimen was modelled elastic, means of the Ansys programme so that its contour or Gas linearly that it was loaded in a tangential direction, but due to Since the specimen was modelled as linearly elastic, the va θ in equation 3 to tissue orientation the crack propagated in a longitudinal direction, the angle contour nodes defined.energy release rate G (Smith, 2003) withwere the elastic tissue orientation the crack propagated in a longitudi2003) withthe the elastic energy rate Gas(Smith, Since specimen wasrelease modelled linearly nal direction, the angle q in equation 3 equals 0. Only equals 0. Only stresses in nodes lying in the crack propagation plane were thus taken into account in elastic, the value of J integral can be equalled with the stresses in nodes lying in the crack propagation plane theinto calculation. elastic energy J release = G , rate G (Smith, 2003) were thus taken account in the calculation. J I = IGI , I J = GI (6) The followingI equation is also account The following equation is also takentaken into into account The following equation is also taken into account 2 2 K 2 KI GI G = I =I` , ` , G = K I (7) I E E E` where E` is an equivalent modulus of elasticity (Sih et where E`anisequivalent an equivalent modulus of elasticity (Sih al., 19 where E` is modulus of elasticity (Sih et al.,et1965) al., 1965) −1 / 2 −1 / 2 b bb b b b 2b 2+bb +b E = E =11 2211 22 22 +22 +12 1266 66 2 2 b11 b11 2b11 2b11 ` Figure 2 Stresses at the crack tip Slika 2. Naprezanja na vrhu pukotine Figure 2 Stresses at the crack tip Slika 2. Naprezanja na vrhu pukotine ` . . (8) constantsconstants depending on the type and bij are bij are compliance depending on the of materi andcompliance bij are compliance constants depending ontype the type of m and of material. In the case of the plane-strain condition, b constants must be calculated from coefficients aij condition, the ijcalculated bij constants must be calculated from coefficien condition, the the b constants must be from coefficients a ij ij The second method of the critical stress intensity factor calculation used the J integral ai3 aaj3 a The second method of the critical stress intensity i3 j3 ) , 6) , 1,26,..., according to equation 4 (Broek, 1989) and Figureb3ij =bijaij=−aij a−33 (i, j (=i,1j,2=,..., factor calculation used the J integral according to equaa33 tion 4 (Broek, 1989) and Figure 3 where where J = (Wd dy − T Γ ∂u ds ) ∂x (4) (4) G is integration path, and Wd is deformation energy per unit of volume, (9) a11 = ν 1 1 1 (10) . , a 22 = , a12 = a 21 = − 12 , a 66 = E11 E 22 E11 G12 The compliance coefficient values for the value of a11 Γ is integration path, and Wd is deformation energy per unit ofthevolume, were calculated from measured modulus ofofelasticThe compliance coefficient values for the value a11 were calculated from ity,ofwhich amounted to 14 490toMPa, while values elasticity, which amounted 14490 MPa,the while the values for other c 224 1 Wd = σ ij ε ij , 2 from Kollmann and Cote (1984) (equation 1). DRVNA INDUSTRIJA 64 (3) 221-229 (2013) (5) The third method of the critical stress intensity factor calculation u strain energies, from which the strain energy release rate per unit of crack p , a 22 1 , a12 = a 21 =ν − , a 66 =1 . a11 1= = E E, 22 G.12 , 11a 22 = a11 = a12 = a 21 = − 12 E, 11a 66 = E11 E 22 E11 G12 (10) (10) uB and uC are the displacements of nodes B and C in the uB and uC are the displacements of nodes B and C in the x direction, displacements of nodes B and C in the y direction. L1 is the len displacements of nodes B and C in the y direction. L1 is the length of triang The compliance coefficient values for the value of a11 are were calculated from equation the measured modulus complex zeros of The compliance coefficient values for the value a11 were calculated fromthe the measured modulus areof complex zeros of the equation ...... Merhar, Gornik Bučar, Bučar: Mode I Critical Stress Intensity Factor of Beech Wood... elasticity, whichKollmann amountedand to 14490 MPa, while the values for other coefficients were taken for other coefficientsofwere taken from of elasticity, which amounted to 14490 MPa, while the values for other coefficients were taken Cote (1984) (equation 1). from Kollmann and Cote (1984) (equation 1). 4 a3 11 s 4 − 2a16 s 3 + (22a12 + a 66 ) s 2 − 2a 26 s + a 22 = 0 The third method of the critical stress intensity from Kollmann and Cote (1984) (equation 1). a11 s − 2a16 s + (2a12 + a 66 ) s − 2a 26 s + a 22 = 0 (16) third method of enerthe critical stress intensity factor calculation used the differences of factor calculation used the The differences of strain The third method of the critical stress intensity factor calculation used the differences of gies, from which thestrain strain energies, energy release rate per unit from which the strain in energy release perform unitofofs j crack length in the = α +propagation iβ j A (j = 1,2).with A zero was with positive im zero theinform of srate j (j =j 1,2). the form s=j α = αj j++ofiiββcrack A zero with positive j (j = 1,2). of crack propagation length was obtained. Firstthe a crack strain energies, from which strain energy release rateofjper unit propagation length wasimaginary part positive part and ( β then ) pisand appropriate for obtained. First a crack withanotha measured length imaginary was modelled, with j > 0another qj area longer crack. for the solution,while j with a measured length was modelled, and then q for themodelled, solution,while j and j are the solution,while pj and are obtained. First a crack with a measured length was andpqthen another with a longer crack. j er with a longer crack. Differences in lengths the lengths of Differences in the of modelled cracks ranged from 0.05mm to 0.35mm. The deformation Differences the lengths of modelled to 0.35mm. The deformation modelled cracks ranged from in 0.05mm to 0.35mm. The cracks ranged from 0.05mm energy of each modelled crack length was calculated by After that, the p j =means a11 s 2j +of a12the − a16programme. sj 2 deformation energy of each modelled crack length was p j = a11 s jby + ameans j the programme. After that, the 12 − a16 sof energy of each modelled crack length was calculated (17) between the specimen with the longer in the dWAfter calculated by means difference of the programme. that, the d energies a crack. and the specimen with between the specimen withqa 22j the in the dWd energies = a12longer s j .+ 22crack − a 26 and the specimen with difference in the difference dWthe energies between the specimen d q j = a12 swas − a 26 bysthe measured crack was calculated. The difference difference in lengths da and j + divided j sj with the longer crack and the specimen with the meas-The difference was divided the measured crack was calculated. by the difference in lengths da and the thickness of the modelled specimen b. ured crack was calculated. The difference was divided In the case of plane-stress condition, the aij constants thickness by the difference the in lengths da of andthe themodelled thicknessspecimen of the b.are compliance In the case ofyielded plane-stress condition,10, the aij constants are coefficients by equation In the case of plane-stress condition, the aij constants are compliance modelled specimen b. and in the case ofequation plane-strain condition by equation 9. 10, and in the case of plane-strain condition by equati 1 dW equation 10, and in the case of plane-strain condition by equation 9. G I =1 −dW d (11) b d da GI = − (11) (11) b da Then the critical stress intensity factor was intensity calculated Then the critical stress factor was calculated considering equations 6 to 10. considering equations to critical 10. Then 6the stress intensity factor was calculated considering equations 6 to 10. The fourth method of critical stress intensity factor calculation was based on the deformation The fourth method of critical stress intensity facThe fourth method of critical stress intensity factor calculation was based on the deformation of material crack, i.e., by the displacement of triangle element nodes as shown in tor calculation was based on the surrounding deformationthe of mateof material surrounding the crack, of i.e., by the displacement of triangle element nodes as shown in rial surrounding the crack, i.e., by the displacement Figure 4, and using the following equation (Sauoma and Sikiotis, 1986). triangle element nodes as shown in Figure 4, and using Figure 4, and using the following equation (Sauoma and Sikiotis, 1986). the following equation (Sauoma and Sikiotis, 1986). K π K I I −1= [B ]−π1 [A] KI= K[BII ] [A−1] 2L π 2L1 [B] [A] 1 KI = K II The matrix (12) Figure 4 Triangle element with nodes Slika 4. Elementi trokuta s čvorovima 2L is given by is given by (12) (12) [B]−1 is The givenmatrix by [B ] −1 1 The matrix [B ] −1 −i 1 i [q 2 − q1 ] 1 [ p 2 − p1 ] Re Re is1 −[qs 22 − q1 ] 1 D Re −si1 − [sp2 2 − p1 ] 1 D , [B]−1 = Re [B]−1 = Re s1 −−si2 [s1q 2 − s 2Dq1 ] 1 Res1 − is 2 [s1 p 2 − s2 Dp1 ]1, − si1 − s 2 [s1q 2 − s 2 q1 ] 1 DRe is1 − [ss21 p 2 − s 2 p1 ] 1D Re − s 2matrix determinant D s1 − s 2 D [D ]iss1 the (13) (13) (13) [D] is the matrix determinant i [s1 p 2 − s 2 p1 ] Re i [ p 2 − p1 ] Re s s s s − − 1 2 , [D ] = det 1 2 i i [s1q 2 − s 2 q1 ] Re [q 2 − q1 ] Re s1 − s 2 s1 − s 2 and matrix [A] is 9 9 (14)(14) and matrix [A] is Since the calculation takes account of the material deformation on only one side of the crack, the (15) method can be used only for symmetric specimens . with a symmetric load application. In order for the cal-(15) 4v B − v C culation to be as accurate as possible, only half of the specimen was modelled and on the lower side the prouB and uC are the displacements of nodes B and C wasB set boundary in the x direction, and vB uandand vC are the displacements uC are the displacementsgramme of nodes anda C in the xcondition direction,that andthevBspeciand vC are the B men was symmetric. The crack tip was surrounded by of nodes B and C in the y direction. L1 is the length of y direction. L1 is the lengtheach, of triangle element,beand s1 and s2 displacements of nodes B and therows of 6 triangle elements the elements triangle element, and s1 and s2 are complex zeros of the C intwo ing around 0.1 mm or 1/1000 of the crack length long. equation are complex zeros of the equation The ratio between the size of the first row and the sec- 4u − u [A] = B 4uc B − uc 4[vAB] =−vC a11 s 4 − 2a16 s 3 + (2a12 + a 66 ) s 2 − 2a 26 s + a 22 = 0 DRVNA INDUSTRIJA 64 (3) 221-229 (2013) (16) 225 lower programme a boundary condition specimen symmetric. on on thethe lower sideside thethe programme waswas set set a boundary condition thatthat thethe specimen waswas symmetric. . ..... crack surrounded rows 6 triangle elements each, elements being around TheThe crack tip tip waswas surrounded by by twotwo rows of 6oftriangle elements each, thethe elements being around Merhar, Gornik Bučar, Bučar: Mode I Critical Stress Intensity Factor of Beech Wood... 1/1000 crack length long. ratio between 0.10.1 mmmm or or 1/1000 of of thethe crack length long. TheThe ratio between thethe sizesize of of thethe firstfirst rowrow andand thethe second one was set as 1.5. The results were used to calculate the deformation of nodes in directions second one was set as 1.5. The results were used to calculate deformation nodes in directions Figure 5 showsthe forces dependentofon the crack ond one was set as 1.5. The results were used to calcumouth opening displacement of the specimen x and ynodes , and todirections calculate stress intensity factor fracture mode IC for x and yof , and to calculate thexthe critical stress intensity factor KICKfor fracture mode I. I. used to late the deformation in andcritical y, and determine the critical stress intensity factor. The figure to calculate the critical stress intensity factor for stress fifth method the stress intensity factor calculation used a generally known IC critical TheThe fifth method of of theK critical intensity factor calculation used a generally shows instantaneous force drop as a consequence of known fracture mode I. crack propagation or an instable fracture.inThe equation 1989) applying the specimen plane-strain conditions in isotropic equation (Broek, 1989) applying to to thesudden CTCT specimen forfor plane-strain conditions isotropic The fifth method of (Broek, the critical stress intensity figure clearly shows the linear elastic part of force defactor calculation used a generally known equation material material pendence on mouth opening, shifting to the nonlinear (Broek, 1989) applying to the CT specimen for planepart just before the crack propagates. The continuous strain conditions in isotropic material F F f (a / W ) K I K= I = f (a / W ) B B WW 2 3 4 2 3 4 a /)W) a a − 13,32a a + 14,72a a − 5 ,6a a (2 +(2a+/ W = + f a W ( / ) 0 , 886 4 , 64 + 4,64 − 13,32 + 14,72 − 5,6 f (a / W ) = 0,886 3 / 2) 3/ 2 a /)W WW (1 −(1a−/ W W W W W W W (18)(18) (18) where a is the crack length, W is specimen length and B specimen thickness. where is the crack length, Wspecimen is specimen length B specimen thickness. where a isathe crack length, W is length andand B specimen thickness. line is a regression curve for the linear part of loading, The specimens moduli of elasticity EL in a longiin a longitudinal direction also measured. The specimens moduli of elasticity EinLinclination a longitudinal direction also measured. moduli of–130 elasticity ELthe while of the dashed line iswere bywere 5% smalltudinal direction wereThe also specimens measured. Specimens er than the continuous Since thetointersection of abending mm long, 10 Specimens mm wide, and 6 mm high –10 were Specimens –130 long, 10 mm wide, and 6 mm high – one. were subjected a four-point bending –130 mmmm long, mmsubwide, and 6 mm high – were subjected atofour-point straight line with a 5 % smaller inclination and the jected to a four-point bending load on the tensile testload tensile testing machine. A measurements linear variable differential transformer used on on thethe tensile testing machine. A linear variable differential transformer waswas used to to were practically equal to(LVDT) the(LVDT) maximum ing machine. load A linear variable differential transformer force, the maximum forces measured were used in the (LVDT) was measure used to measure the specimen displacemeasure specimen displacement during loading. thethe specimen displacement during loading. calculations. ment during loading. From graph the measurements force depending on linear thethe graph ofofof the measurements of of depending onof deformation, thethe linear Table 2force indicates the results thedeformation, critical stress From the graph From of the measurements force deintensity factor calculationbetween for five different methods. pending on deformation, thecurve linearcoefficient regression incurve regression the linear dependence force deformation regression curve coefficient in the areaarea of of linear dependence between force andand deformation waswas The results of calculations written in bold differ insigcoefficient in the area of linear dependence between determined by means the Excel programme. The equation describing displacement nificantlyThe from each other. Calculations using the J in- in in force and deformation was by determined by of means of the determined means of the Excel programme. equation describing thethe displacement thethe tegral (Figure 6) have been shown as the least sensitive Excel programme. The equation describing the dismiddle of the specimen depending the specimen geometric and loading force used middle of the specimen depending on on theto specimen datadata loading force waswas used to to the size ofgeometric elements and toand the range of integration. placement in the middle of the specimen depending on calculate the modulus of elasticity the specimencalculate geometric and loading force was thedata modulus of elasticity EL.EL. The calculation values were around 0.496 MPa·√m, regardless of the size of basic elements, the type of eleused to calculate the modulus of elasticity EL. ments surrounding the crack, and the distance of contour around the crack tip, up to the distance of 0.4 mm. 3 RESULTS AND DISCUSSION RESULTS AND DISCUSSION 3 RESULTS3AND DISCUSSION At this distance, the integration path included two 3. REZULTATI I3.RASPRAVA REZULTATI I RASPRAVA 3. REZULTATI I RASPRAVA types of triangle elements and at least one type of 8-node brick element. In the case of a shorter distance, Table 1 indicates the measured values of the however, it was demonstrated that a satisfactory result modulus of elasticity. The table shows that the specirequires at least two types of 8-node brick elements, as mens have an average modulus of elasticity EL of 11 11 is the case with 1 mm large elements around the crack 14 487 MPa, with standard deviation of 1 246 MPa. tip. In the case of two rows of triangle elements the acTable 1 Measured modulus of elasticity in longitudinal curacy of result is not satisfactory. In this case, at least direction EL one more row of 8-node brick elements is required. Tablica 1. Izmjereni modul elastičnosti u longitudinalnom smjeru EL 300 lin. reg. EL , MPa 250 1 2 3 4 5 6 7 8 9 10 14 975 200 Average / Prosjek 14 487 St. dev. 1 246 226 12 442 lin. reg. 5% Force Force NN Sila NN Sila Specimen / Uzorak 150 15 701 16 694 100 13 543 50 14 874 0 13 789 15 293 13 875 13 684 0 0,2 0,4 0,6 0,8 1 Crack mouth opening displacement mm Crack mouth opening displacement mm Pomak otvora pukotine mm Pomak otvora pukotine mm Figure 5 Force depending on crack mouth opening displacement with linear regression curves Slika 5. Prikaz ovisnosti sile o pomaku otvora pukotine linearnom regresijskom krivuljom DRVNA INDUSTRIJA 64 (3) 221-229 (2013) ...... Merhar, Gornik Bučar, Bučar: Mode I Critical Stress Intensity Factor of Beech Wood... Table 2 Critical stress intensity factor KIC calculation; R – refinement of elements around crack tip – 8 nodes brick elements; T – triangle elements around crack tip Tablica 2. Izračun faktora kritičnog intenziteta naprezanja KIC; R – usklađivanje elemenata oko vrha pukotine – osam čvorova elementa; T – element trokuta oko vrha pukotine El. Size Veličina elementa mm R T R T 1 2 KIC (MPa√m) calculated from / KIC (MPa√m) izračunan iz J integral (Eq. 4) GIC (Eq. 11) dist. from crack tip, mm crack length dif., mm Udaljenost od vrha pukotine, mm Razlika duljine pukotine, mm 0.2 0.4 1.6 6 0.1 0.15 0.25 0.35 0.497 (2el)* 0.496 (4el) 0.495 0.495 0.290 0.557 0.425 0.490 0.494 (3el) 0.495 0.496 0.495 0.496 0.497 0.499 0.468 (2el) 0.495 (2el) 0.495 0.495 0.445 (1el) 0.294 0.325 0.481 0.476 (2el) 0.489(0.8 3el) 0.493 0.496 0.512 0.507 0.508 0.491 Stand. (Eq. 18) Ekst. KI (Eq. 2) Node displ. (Eq.12) 0.520 0.494 0.494 - 0.492 0.495 * Values in brackets mean number of elements included in calculations. / Vrijednosti u zagradama označavaju broj elemenata uključenih u izračun. 0,5 40 K y = -0,0174x + 0,4941 R² = 0,9984 0,49 ss y 0,48 StressStress in y indirection MPa y direction MPa Naprezanje u yusmjeru MPa Naprezanje y smjeru MPa 0,5 Stress factor KI MPa(m)0,5 Stressintensity intensity factor KI MPa(m) 0,5 Faktor intenziteta deformacije KI MPa(m) Faktor intenziteta deformacije KI MPa(m)0,5 Figure 6 Meshed crack tip with J integral contour superimposed Slika 6. Preklapanje mreže oko vrha pukotine s konturama J integrala 35 30 0,47 0,46 25 0,45 20 0,44 15 0,43 10 0,42 5 0,41 0,4 0 0 0,5 1 1,5 2 2,5 3 Distance from crack tip tip mm mm Distance from crack Udaljenost of vrha pukotine mm Udaljenost of vrha pukotine mm Figure 7 Stresses in y direction sy and stress intensity factor KI with regression line as a consequence of distance from the crack tip Slika 7. Prikaz ovisnosti naprezanja u y smjeru sy i faktora intenziteta naprezanja KI o udaljenosti od vrha pukotine regresijskim krivuljama DRVNA INDUSTRIJA 64 (3) 221-229 (2013) Calculations based on difference of elastic deformation energy exhibit greater sensitivity to the size of elements as well as to the type of elements around the crack tip. The results are better in the case of triangle elements surrounding the tip. In the case of smaller elements, there is no deviation from the calculation using J integral and other two methods regardless of the size of the crack extension. When the crack is extended by 0.05 mm or 0.1% of the crack size, the results are no longer satisfactory whatever the size of the basic elements and type of elements surrounding the crack tip. In the case of 8-node brick elements where the refinement is made, the results are not satisfactory regardless of the size of elements. When elements of 2 mm in size were used and the crack was extended by 0.1mm, no calculation could be made because the elastic deformation energy decreased with an increased crack, which is contrary to other cases. The calculation based on the stress intensity factor extrapolation at various distances of the crack tip to the distance of zero yielded equal results regardless of the size of the basic elements. The tip was surrounded only by elements with 8 nodes, since during the refinement of elements in the crack propagation line the triangle elements turned into 8-node brick elements. Stresses in the y direction and stress intensity factors as a consequence of the crack tip distance together with regression curve are shown in Figure 7. It clearly shows the linear dependence of the stress intensity factor on distance. Likewise, the calculation based on the deformation of triangle element (Eq. 12) nodes was equal for both sizes of basic elements, while the triangle element size was the same in both cases, equalling 0.118 mm. The calculation of critical stress intensity factor by a generally known equation for an isotropic CT specimen (Eq. 18) yielded about 5 % higher results. In our case, the reason for that was probably the orthotropic material, which has significantly lower modulus of elasticity in radial and in tangential direction compared to the longitudinal one, but in the equation 12 only the modulus of elasticity in longitudinal direction is used. Another reason could also be the specimen 227 Merhar, Gornik Bučar, Bučar: Mode I Critical Stress Intensity Factor of Beech Wood... height-to-length ratio. This is to say that the equation assumes the mentioned ratio to be 1, while in our case it was less than 1. Since the calculation of the critical stress intensity factor by means of the J integral, in which the contour is sufficiently far from the tip, is satisfactory, and the calculation method simple, the J integral was used to calculate KIC for the remaining specimens. Table 3 shows the critical stress intensity factors calculated by means of the J integral. The integral contour was 6 mm away from the crack tip at the basic elements size of 2 mm and triangle elements around the crack tip. An average value of critical stress intensity factor is 0.56 MPa·√m with standard deviation of 0.047 MPa·√m, which represents less than 10 % of the mean value determined. A similar deviation can be found with the modulus of elasticity. Considering Vasić and Stanzl-Tschegg (2007), who stated the value of 0.62 MPa·√m for the RL orientation as the beech fracture toughness with a moisture content of 12 %, and the fact that fracture toughness in the TL configuration is lower than that of the RL configuration, as stated by Stanzl-Tschegg and Navi (2009), it can be ascertained that the values we obtained comply with their findings as well with Majano-Majano et. al. (2012). It should also be noted that the bigger specimens would probably give more representative KIC values, since they are dimension dependent as reported by Stanzl-Tschegg et. al. (1995). Table 3 Critical stress intensity factors KIC Tablica 3. Faktor kritičnog intenziteta naprezanja KIC Specimen Uzorak KIC, MPa·√m 1 0.49 2 0.63 3 0.53 4 0.62 5 0.57 6 0.58 7 0.52 8 0.57 9 0.53 Average Srednja vrijednost St. dev. Stand. devijacija 0.56 0.047 4 CONCLUSION 4. ZAKLJUČAK Comparing different methods for mode I critical stress intensity factor calculations, the J integral proves to be the most appropriate considering the simplicity and sensitivity to the size and shape of the elements. It was used to calculate the critical stress intensity factor for beech wood in a TL configuration, which means that the specimens were loaded in a tangential direction while the crack propagated in a longitudinal direction. The average value was 0.56 MPa·√m with a standard deviation of 0.047 MPa·√m. Comparing the results of Vasic and Stanzl-Tschegg (2007), who obtained KIC of 228 . ..... 0.62 MPa·√m in the RL configuration at 12 % wood moisture content, and the fact that the value in TL configuration is lower than the value in RL configuration, we find that the values obtained agree with research results of other authors like Majano-Majano et al. (2012), who stated the value for KIC in TL configuration in the range from 0.44 to 0.63 MPa√m and Ozyhar et. al. (2012), who determined KIC in TL configuration to be around 0.406. Likewise, it was found that researchers predominantly investigate the so-called ‘stable fracture’, which means that the crack propagates in proportion to the crack mouth opening displacement. Beech wood in the TL configuration, however, has shown to be a distinctly brittle material, since after the maximum load is achieved, the crack propagates instantaneously and at a great speed to a certain equilibrium length (Merhar and Bučar, 2012), which various authors consider to be an unstable fracture. However, the RL configuration is exhibited as a more stable one, and therefore several authors prefer to use it as a model for determining the critical stress intensity factor. 5 REFERENCES 5. LITERATURA 1. Broek, D., 1989: The practical use of fracture mechanics. Dordrecht, Kluwer Academic Publishers. 2. Frühmann, K.; Burgert, I.; Stanzl-Tschegg S. E.; Tschegg, E. K., 2003: Mode I Fracture Behaviour on the Growth Ring Scale and Cellular Level of Spruce (Picea abies [L.] Karst.) and Beech (Fagus sylvatica L.) Loaded in the TR Crack Propagation System. Holzforschung, 57(6):653-660. http://dx.doi.org/10.1515%2FHF.2003.098 3. Hertzberg, R., 1996: Deformation and Fracture Mechanics of Engineering materials. New York, Wiley. 4. Koch, P., 1985: Utilization of hardwoods growing on southern pine sites. Agriculture handbook no. 605. Washington, U.S. Department of Agriculture, Forest Service. 5. Kollmann, F. F. P.; Cote, W. A., 1984: Principles of Wood Science and Technology, Volume I: Solid Wood. Berlin, Heidelberg, New York, Springer-Verlag. 6. Le-Ngoc, L.; McCallion, H., 1997: On the fracture toughness of orthotropic materials. Eng. Fract. Mech., 58(4): 355-362. http://dx.doi.org/10.1016%2FS0013-7944%2897%2900119-7. 7. Majano-Majano, A.; Hughes, M.; Fernandez-Cabo, J. L., 2012.: The fracture toughness and properties of thermally modified beech and ash at different moisture contents. Wood. Sci. Technol., 46(1-3): 5-21. http://dx.doi.org/10.1007%2Fs00226-010-0389-4 8. Merhar, M.; Bučar, B., 2012: Cutting force variability as a consequence of exchangeable cleavage fracture and compressive breakdown of wood tissue. Wood Sci. Technol., 46(5): 965-977. http://dx.doi.org/10.1007%2Fs00226-011-0457-4 9. Ozyhar, T; Hering, S; Niemz, P., 2012: Moisture-dependent elastic and strength anisotropy of European beech wood in tension. J. Mater. Sci., 47(16): 6441-6450. http://dx.doi.org/10.1007%2Fs10853-012-6534-8 10.Porter, A. W., 1964: On mechanics of fracture in wood. Forest Prod. J., 14(8): 325-331. 11. Reiterer, A.; Tschegg, S., 2002: The influence of moisture content on the mode I fracture behaviour of sprucewood. J. Mater Sci., 37(20): 4487-4491. DRVNA INDUSTRIJA 64 (3) 221-229 (2013) ...... Merhar, Gornik Bučar, Bučar: Mode I Critical Stress Intensity Factor of Beech Wood... 12.Saouma, V. E.; Sikiotis, E. S., 1986: Stress intensity factors in anisotropic bodies using singular isoparametric elements. Eng. Fract. Mech., 25(1): 115-121. http://dx.doi.org/10.1016%2F0013-7944%2886%2990209-2 13.Scheffler, M.; Niemz, P.; Diener, M.; Lustig, V.; Hardtke, H. J., 2004: Fracture toughness from hardwood in mode I and II. Holz Roh Werkst., 62(2): 93-100. http://dx.doi.org/10.1016%2Fj.tsf.2012.08.031. 14.Sih, G. C.; Paris, P. C.; Irwin, G. R., 1965: On cracks in rectilinearly anisotropic bodies. Int. J. Fract. Mech., 1(3): 189-203. http://dx.doi.org/10.1007%2FBF00186854. 15.Smith, I.; Landis, E.; Gong, M., 2003: Fracture and Fatigue in Wood. New York, Chischester, Wiley. 16.Stanzl-Tschegg, S. E.; Tan, D. M.; Tschegg, E. K., 1995: New splitting method for wood fracture characterization. Wood Sci. Technol., 29: 31-50. http://dx.doi.org/10.1007%2FBF00196930. 17.Stanzl-Tschegg, S. E.; Navi, P., 2009: Fracture behaviour of wood and its composites. A review. COST Action E35 2004-2008: Wood machining - Micromechanics and fracture. Holzforschung, 63(2): 139-149. http://dx.doi.org/10.1515%2FHF.2009.012. DRVNA INDUSTRIJA 64 (3) 221-229 (2013) 18.Vasic, S.; Stanzl-Tschegg, S., 2007: Experimental and numerical investigation of wood fracture mechanisms at different humidity levels. Holzforschung, 61(4): 367374. http://dx.doi.org/10.1515%2FHF.2007.056. 19.Thuvander, F.; Berglund, L. A., 2000: In situ observations of fracture mechanisms for radial cracks in wood. J. Mater. Sci., 35(24): 6277-6283. 20.Yeh, B.; Schniewind, A. P., 1992: Elasto-plastic fracture mechanics of wood using the J integral method. Wood Fiber. Sci., 24(3): 364-376. Corresponding address: Assistant MIRAN MERHAR, Ph.D. University of Ljubljana Biotechnical Faculty Department of Wood Science and Technology Rožna dolina, C. VIII/34 1000 Ljubljana, SLOVENIA e-mail: [email protected] 229
© Copyright 2026 Paperzz