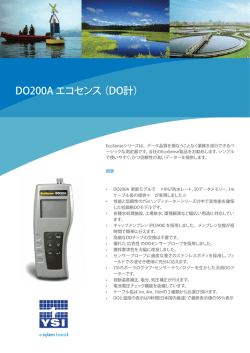
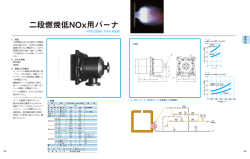
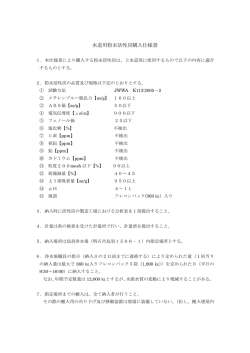
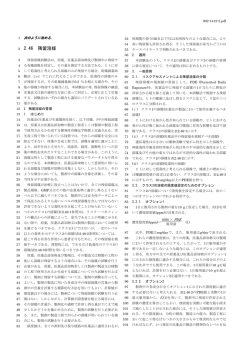
LESA Upgrade kit for surface analysis
Certified distributor of Advion Inc.
LESA
Liquid Extraction Surface Analysis
nano-ESI を用いた
平面サンプルから直接サンプル抽出しMS分析
k.k. L.E. Technologies
www.let.co.jp
LESA Upgrade kit
Liquid Extraction Surface Analysis
LESA Upgrade Kit は、TriVersaR NanoMate のアップグレードキットです。
TriVersaR NanoMate LESA では、従来では分析する事が出来なかった、平面サンプルから直
接、代謝物、化合部等を液抽出して、LC/MS へ直接 Infusion Spray する事が出来ます。
ESI‐ChipTM
Robotics Sample Probe
~2000kv
Mass Spectrometer
Q0 Q1 q2 Q3
Sample
Conductive Pipette Tip
サンプル抽出
TriVersaR NanoMate LESA は、予めスキャナーでサンプルの画像を取り込み、PC画面上で分析個所を特定する事が出来ます。
とけていされた分析個所へTriVersaR NanoMate LESA のハンドリングロボットが、抽出溶媒を取り、指定された分析場所へ移動し、
サンプル表面より少し距離を空け、抽出溶媒を少量(1μl 程度)サンプル上に出し、ピペットチップとの間に抽出溶媒の液適を作りま
す。液適が接触しているサンプル表面から抽出された目的物を Infusion mode で MSへスプレイし、分析を行います。
簡易イメージング
LESA-MS-SRM single organ profiling of brain 4 h post P.O. dose of 50 mg/kg terfenadine with parameter settings
optimized for 1 mm spatial resolution. Fexofenadine is distributed throughout the brain with low signal intensity, whereas
terfenadine is only detected in the border regions of brain and adjacent tissues. (A) Optical image of the mouse whole body
cryo-section with outline of the sampled area and annotation of the brain tissue. (B) LESA-MS-SRM analysis of terfenadine
and (C) LESA-MS-SRM analysis of fexofenadine. SRM intensity data is shown as topographic map with colors representing
the signal intensity in cps, please note that this graphical output does interpolate between data points (color changes between
cross sections), the spatial resolution on target is 1 mm as indicated by the white cross-sections.
Dried Blood Spots Analysis への応用
Intact Alpha, beta, gamma (foetal) and sickle Hb chains were successfully detected by direct surface sampling of Dried
Blood Spots. Multiply charged ion of intact alpha chains (in all samples), beta chains (in normal adult and infant subjects)
and gamma chains (in all neonates) were readily detectable without the need for selected ion monitoring, as shown .
LESA MS 半定量分析への応用
LESA TLC Semi-Quantitation for Strychnine in Canine
Stomach Contens XIC : m/z 335 > m/z 264
異なった濃度の2種類のサンプル(Reserpine )と内部標準(Verapamil )を交互に スプレイし、それぞれの濃度に応じた
分析結果を得ることが出来ました。
下記左図の5番目のスプレイでは、サンプルのイオン化が何らかの原因でスプレイに乱れが生じていますが、内部標準サンプル
(IS)も同じようにイオン化が行われ、全体としては、簡易定量分析が可能。下記右図では、MALDI Plate にアプライしたサンプ
ルを LESA mode で分析しました。サンプルの濃度とTICの高さがほぼ一致しています。
Reserpine 0.3 ppm & 1 ppm
IS: Verapamil 50 ppb
1.0 ppm
0.3ppm
30 ppm
1.0 ppm
0.3ppm
1.0 ppm
10 ppm
0.3ppm
3 ppm
0 ppm
0.1 ppm 0.3 ppm 1 ppm
トウモロコシの根から直接 BXD (1,4-benzoxazin-3-one
derivatives) を抽出しMS分析する事ができました。
マウス腎臓凍結切片から直接サンプル抽出
ACHQ/ACHQ‐d3
Before LESA‐MS/MS After LESA‐MS/MS
Cortex Medulla Analyzes area 2mm 間隔
mm across kidney
Spatial distribution of CHQ in the kidney from a CHQ-dosed animal (10 mg/kg; 2 h) tissue section. (a) Optical image of the kidney
tissue section prior to LESA-MS/MS analysis. The numbered blue circles were created using LESA software (1mm diameter with
2mm center-to-center spacing) and indicate selected LESA-MS/MS analysis points. (b) Optical image of kidney section after LESAMS/MS analysis illustrating the actual areas analyzed across the cortex and medulla (outlined by red dashes in (a) of the kidney). Each
analysis spot was approximately 1.5–2mm in diameter.
(c) Integrated SRM signals of CHQ normalized to the internal standard, CHQ-d4, are plotted versus distance in mm across the kidney
section. The numbered blue circles correlate with the numbered circles in (a) and indicate the intensity versus spatial location in the
cortex (circles 1, 2 and 8) and the medulla (circles 3–7).
LESA Point software
LESA
植物の根から直接サンプル抽出
マウス脳凍結切片からの脂質自動分析
1
PC
PC
(16:0/20:4) (18:1/20:4)
GalCer
(d18:1/24:2h)
4
PC
(16:0/18:1)
PC
(16:0/16:0)
782.6
GalCer
(d18:1/22:1h)
2
5
①: cerebellum
②: cerebral cortex (backward)
③: hippocampus
3
④: olfactory bulb
6
PC
(18:0/18:1)
⑤: cerebral cortex (onward)
⑥: thalamus
幅広いアプリケーションに対応
LESA と TriVersaTM NanoMate を使用する事で、下記のアプリケーションに対応することが可能となりました。
・Thin Tissue sections ( Cryostat tissue sample )
病理サンプルの凍結切片などは、スライドグラスに固定するだけで
切片内の指定された部位から直接サンプルを抽出し、MS分析可能。
・DBS / Dried Blood Spots on paper ( *1 )
従来のBD法と比べても殆ど変らない結果を得ることが出来ます。
LESA法は、従来のBD法と比べ前処理が無く、簡単にMS分析を行う事が可能。前処
・MALDI plates for complimentary information by ESI
MALDI –TOF/MS で使用したサンプルをそのまま、LESAでMS分析する事が可能です。
・TLC plate and other plan separation media . ( *2 )
まだ多くの研究者の方々に TLCプレートがサンプルの分離に使用されて います。
簡便な分離方法としてお使い頂いている TLC プレートも、簡単な前処理をするだけで、
MS分析が可能です。
・ 野菜の葉や茎
残留農薬等の分析を、野菜などの植物から直接サンプルイングを行いMS分析。
・ 果物の表面
果物などの比較的大きな物の表面からも残留農薬等の薬物を検出することも可能です。
・ 医薬品等のケースの内側
錠剤などを保存しているシートの内側の分析をすることで、シート内に長期間保存されている
錠剤に対する影響をMS分析でその原因物質等の分析も可能です。
・ 印刷物の分析
印刷物のインクやその他の薬剤等についても直接サンプリングして、MS分析を行う事が出来ます。
・ その他平面状のサンプル
LESAは、色々なサンプルのMS分析を可能にしました。完全な平面サンプルだけではなく、
コンタクトレンズの様な物の表面に付着しているタンパク質等の分析も可能です。
*1 : DBS では抽出溶媒が露紙に吸収される可能性があるので、ご注意ください。
*2 : TLC Plat では、抽出溶媒が広がってしまうので注意してください。
Advion Inc.
Exclusive Distributor in Japan
2013年12月2日
お客様各位へ
株式会社エル・イー・テクノロジーズは、米国 Advion
Inc. で製造された下記の製品について、日本における
唯一の販売代理店であることを証明します。
・ ロボットイオン源 TriVersaTM NanoMate 及びLESA
・ナノ・イオン源 Chip-MateTM
・これ等に関するアクセサリー及び消耗品
・上記製品に関するアフターサービス
Joseph M. Kiely
Executive Vice President, CFO
※価格についてはお問い合わせください。
※上記製品仕様及びカタログ内は予告無く変更される場合があります。詳しくは、お問い合わせください。
Advion Inc. 総輸入販売代理店
株式会社エル・イー・テクノロジーズ
本社:〒352‐0025
埼玉県新座市片山3丁目4-32
TEL 048‐478‐2540 FAX 048‐478‐2540
http://www.let.co.jp
製造元:
Advion Inc.
10 Brown Road Ithaca, NY 14850 : USA
TEL : +1- 607 – 266 – 0665
http://www.advion.com
取扱販売店
© Copyright 2026 Paperzz