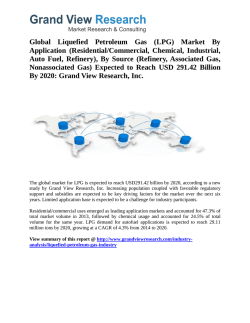
Transparency Market
Research
Liquefied Petroleum Gas Market for Residential/Commercial, Petrochemical and
Refinery, Industrial, Transportation and Other Applications - Global Industry Analysis,
Size, Share, Growth, Trends and Forecast 2014 - 2020
Published Date
2014-09-05
119 Page Report
Buy Now
Request Sample
Press Release
Global Liquefied Petroleum Gas Market is expected to reach USD
299.05 billion in 2020
Transparency Market Research
State Tower,
90, State Street, Suite 700.
Albany, NY 12207
United States
www.transparencymarketresearch.com
[email protected]
Liquefied Petroleum Gas Market
REPORT DESCRIPTION
Transparency Market Research has released a new market report titled “Liquefied Petroleum Gas (LPG) Market - Global
Industry Analysis, Size, Share, Growth, Trends and Forecast 2014 - 2020.” According to the report, the global LPG market
was valued at USD 233.83 billion in 2013 and is anticipated to reach USD 299.05 billion in 2020, expanding at a CAGR of
3.4% from 2014 to 2020.
Browse the full Liquefied Petroleum Gas Market report at http://www.transparencymarketresearch.com/liquefiedpetroleum-gas-market.html
Liquefied petroleum gas (LPG) is a mixture of propane and butane which finds applications in multiple end user segments.
LPG is primarily used by the residential and commercial segment. Within this segment, LPG is majorly used as a cooking
fuel, although other uses include heating and lighting. In 2013, the residential and commercial segment was the largest
consumer of LPG, accounting for over 60% of the global consumption. The Autogas segment is likely to be one of the
fastest growing end user markets of LPG within the forecast period. Attractive environmental benefits of using Autogas
coupled with smaller payback periods for adopters are resulting in rapid adoption of LPG as a transportation fuel. Another
attractive end user segment for LPG is likely to be the refinery and petrochemical segment. Large petrochemical
complexes being planned around the world are likely to contribute to increased LPG consumption in certain regions.
LPG is produced through refineries, non-associated gas, and associated gas. LPG production from crude oil refining
occupied the maximum market share at 41% in 2013. This was followed by the non-associated gas and associated gas
categories in that order. Amidst refinery shutdowns in Europe, the refinery sector in Asia-Pacific and Russia is likely to
contribute to the maximum growth in LPG production from this segment. The non-associated gas category is likely to
account for the fastest growth rates in LPG production within the forecast period. Rapid exploration and production
activities of gas wells both in the Middle East and Russia is likely to contribute further to this fact. LPG production from
shale gas has also been accounted for within the non-associated gas category, which is further enhancing growth in this
segment.
n terms of LPG production, the Middle East was the largest producer in 2013 with almost 33% of the global market share.
However in terms of LPG consumption, Asia-Pacific emerged as the market leader with over 35% of market share in
2013. Large populations in Asia-Pacific, Latin America and Africa are likely to contribute to the growth of LPG consumption
in the residential and commercial segments. Large petrochemical complexes planned in the Middle East are likely to
account for the maximum LPG consumption for the region in the future. A similar scenario is likely to be observed in China
which has large petrochemical capacity additions planned within the forecast horizon. For the Autogas segment, Europe
and certain countries in Asia-Pacific are likely to remain the most attractive markets. Opportunities such as the expansion
of the Panama Canal and a possible shale gas revolution in China by the end of 2016 can significantly alter the dynamics
Transparency Market Research
2
Liquefied Petroleum Gas Market
of the LPG industry. The report has analyzed companies responsible for LPG production as well as those involved in
distribution and retailing of LPG.
LPG Market: Source Analysis
Refinery
Associated Gas
Non-Associated Gas
LPG Market: End User Analysis
Residential/Commercial
Petrochemical and Refinery
Industrial
Transportation
Others
LPG Market: Regional Analysis
North America
Europe
Asia-Pacific
Middle East & Africa
South & Central America
Transparency Market Research
3
Liquefied Petroleum Gas Market
Chapter 1 Preface
1.1 Report Description
1.2 Research Scope
1.3 Market Segmentation
1.4 Research Methodology
Chapter 2 Executive Summary
2.1 Global LPG Market
Chapter 3 LPG Market – Industry Analysis
3.1 Introduction
3.2 Value Chain Analysis: LPG market
3.3 Market Drivers
3.3.1 Increasing consumption of Autogas globally resulting in higher LPG usage
3.3.1.1 Global Autogas vehicles fleet and fuel consumption
3.3.2 Large rural populations in the Asia-Pacific, Africa and Latin America using cheap and easily available LPG as a
fuel
3.3.2.1 Fuel consumption for cooking in rural India, by Fuel type, 2001 & 2013
3.4 Market Restraints
3.4.1 Volatility in crude oil prices leading to LPG price uncertainty
3.5 Market Opportunities
3.5.1 Expansion of Panama canal increasing trade opportunities
3.5.2 Possibility of shale gas production in the Asia-Pacific and Latin American regions
3.6 Porter’s five forces analysis: LPG Market
Transparency Market Research
4
Liquefied Petroleum Gas Market
3.6.1 Bargaining power of suppliers
3.6.2 Bargaining power of buyers
3.6.3 Threat from new entrants
3.6.4 Degree of competition
3.6.5 Threat from substitutes
3.7 Company market share analysis: LPG
3.7.1 LPG company market share analysis, 2013
3.8 Market attractiveness analysis of LPG market, by region, 2013
Chapter 4 Liquefied Petroleum Gas Market: Source Segment Analysis
4.1 Global Liquefied Petroleum Gas market: Source overview
4.1.1 Global Liquefied Petroleum Gas market, volume share by source segment, 2013 and 2020
4.2 Refineries
4.2.1 Global refinery production estimates and forecast, 2013 – 2020 (Million Tons) (USD Billion)
4.3 Associated gas
4.3.1 Global associated gas production estimates and forecast, 2013 – 2020 (Million Tons) (USD Billion)
4.4 Non-associated gas
4.4.1 Global non-associated gas production estimates and forecast, 2013 – 2020 (Million Tons) (USD Billion)
Chapter 5 Liquefied Petroleum Gas Market: End-Use Analysis
5.1 Global Liquefied Petroleum Gas market: End-Use overview
5.1.1 Global Liquefied Petroleum Gas market, volume share by end-use, 2013 and 2020
5.2 Residential/Commercial
5.2.1 Global LPG consumption by residential/commercial, 2013-2020 (Million tons) (USD Billion)
Transparency Market Research
5
Liquefied Petroleum Gas Market
5.3 Petrochemical and Refinery
5.3.1 Global LPG consumption in petrochemical and refinery sector, 2013-2020 (Million tons) (USD Billion)
5.4 Industrial
5.4.1 Global LPG consumption by industries, 2013-2020 (Million tons) (USD Billion)
5.5 Transportation
5.5.1 Global LPG consumption by transportation, 2013-2020 (Million tons) (USD Billion)
5.6 Others
5.6.1 Global LPG consumption by others, 2013-2020 (Million tons) (USD Billion)
Chapter 6 Liquefied Petroleum Gas Market: Regional Analysis
6.1 Global Liquefied Petroleum Gas market: Regional overview
6.1.1 Global Liquefied Petroleum Gas production market, volume share by region, 2013 and 2020
6.1.2 Global Liquefied Petroleum Gas consumption market, volume share by region, 2013 and 2020
6.2 North America
6.2.1 North America Liquefied Petroleum Gas market production estimates and forecast, 2013-2020 (Million tons)
(USD Billion)
6.2.2 North America Liquefied Petroleum Gas market consumption estimates and forecast, 2013-2020 (Million tons)
(USD Billion)
6.2.3 North America Liquefied Petroleum Gas market production estimate and forecast, by source, 2013 – 2020,
(Million Tons) (USD Billion)
6.2.4 North America Liquefied Petroleum Gas market consumption estimate and forecast, by end-use, 2013 – 2020,
(Million Tons) (USD Billion)
6.3 Europe
6.3.1 Europe Liquefied Petroleum Gas market production estimates and forecast, 2013-2020 (Million tons)(USD
Billion)
6.3.2 Europe Liquefied Petroleum Gas market consumption estimates and forecast, 2013-2020 (Million tons)(USD
Billion)
Transparency Market Research
6
Liquefied Petroleum Gas Market
6.3.3 Europe Liquefied Petroleum Gas market production estimate and forecast, by source, 2013 – 2020, (Million
Tons) (USD Billion)
6.3.4 Europe Liquefied Petroleum Gas market consumption estimate and forecast, by end-use, 2013 – 2020, (Million
Tons) (USD Billion)
6.4 Asia-Pacific
6.4.1 Asia-Pacific Liquefied Petroleum Gas market production estimates and forecast, 2013-2020 (Million tons)(USD
Billion)
6.4.2 Asia-Pacific Liquefied Petroleum Gas market consumption estimates and forecast, 2013-2020 (Million tons)(USD
Billion)
6.4.3 Asia-Pacific Liquefied Petroleum Gas market production estimate and forecast, by source, 2013 – 2020, (Million
Tons) (USD Billion)
6.4.4 Asia-Pacific Liquefied Petroleum Gas market consumption estimate and forecast, by end-use, 2013 – 2020,
(Million Tons) (USD Billion)
6.5 Middle East & Africa
6.5.1 Middle East & Africa Liquefied Petroleum Gas market production estimates and forecast, 2013-2020 (Million
tons)(USD Billion)
6.5.2 Middle East & Africa Liquefied Petroleum Gas market consumption estimates and forecast, 2013-2020 (Million
tons)(USD Billion)
6.5.3 Middle East & Africa Liquefied Petroleum Gas market production estimate and forecast, by source, 2013 – 2020,
(Million Tons) (USD Billion)
6.5.4 Middle East & Africa Liquefied Petroleum Gas market consumption estimate and forecast, by end-use, 2013 –
2020, (Million Tons) (USD Billion)
6.6 South & Central America
6.6.1 South & Central America Liquefied Petroleum Gas market production estimates and forecast, 2013-2020 (Million
tons)(USD Billion)
6.6.2 South & Central America Liquefied Petroleum Gas market consumption estimates and forecast, 2013-2020
(Million tons)(USD Billion)
6.6.3 South & Central America Liquefied Petroleum Gas market production estimate and forecast, by source, 2013 –
2020, (Million Tons) (USD Billion)
6.6.4 South & Central America Liquefied Petroleum Gas market consumption estimate and forecast, by end-use, 2013
– 2020, (Million Tons) (USD Billion)
Transparency Market Research
7
Liquefied Petroleum Gas Market
Chapter 7 Company Profiles
7.1 British Petroleum plc
7.1.1 Company overview
7.1.2 Product portfolio
7.1.3 Financial overview
7.1.4 Business strategy
7.1.5 SWOT analysis
7.1.6 Recent developments
7.2 Exxon Mobil Corporation
7.2.1 Company overview
7.2.2 Product Portfolio
7.2.3 Financial overview
7.2.4 Business strategies
7.2.5 SWOT analysis
7.2.6 Recent developments
7.3 Royal Dutch Shell plc
7.3.1 Company overview
7.3.2 Product Portfolio
7.3.3 Financial overview
7.3.4 Business strategies
7.3.5 SWOT analysis
7.3.6 Recent developments
7.4 UGI Corporation
Transparency Market Research
8
Liquefied Petroleum Gas Market
7.4.1 Company overview
7.4.2 Product portfolio
7.4.3 Financial overview
7.4.4 Business strategies
7.4.5 SWOT analysis
7.4.6 Recent developments
7.5 Origin Energy
7.5.1 Company overview
7.5.2 Product portfolio
7.5.3 Financial overview
7.5.4 Business strategies
7.5.5 SWOT analysis
7.5.6 Recent developments
7.6 Kleenheat Gas Pty Limited
7.6.1 Company overview
7.6.2 Product portfolio
7.6.3 Financial overview
7.6.4 Business strategies
7.6.5 SWOT analysis
7.6.6 Recent developments
7.7 China Gas Holdings Limited
7.7.1 Company overview
7.7.2 Product portfolio
7.7.3 Financial overview
Transparency Market Research
9
Liquefied Petroleum Gas Market
7.7.4 Business strategies
7.7.5 SWOT analysis
7.7.6 Recent developments
7.8 Copagaz Distribuidora De Gas Ltda
7.8.1 Company overview
7.8.2 Product portfolio
7.8.3 Financial overview
7.8.4 Business strategies
7.8.5 SWOT analysis
7.8.6 Recent developments
7.9 Repsol S.A.
7.9.1 Company overview
7.9.2 Product portfolio
7.9.3 Financial overview
7.9.4 Business strategies
7.9.5 SWOT analysis
7.9.6 Recent developments
7.10 SHV Energy N.V.
7.10.1 Company overview
7.10.2 Product portfolio
7.10.3 Financial overview
7.10.4 Business strategies
7.10.5 SWOT analysis
7.10.6 Recent developments
Transparency Market Research
10
Liquefied Petroleum Gas Market
List of Figures
FIG. 1 Liquefied Petroleum Gas (LPG): Market segmentation
FIG. 2 Global Liquefied Petroleum Gas production market volume and revenue, 2013 - 2020 (Million Tons) (USD Billion)
FIG. 3 Global Liquefied Petroleum Gas consumption market volume and revenue, 2013 - 2020 (Million Tons) (USD Billion)
FIG. 4 Value chain analysis of LPG market
FIG. 5 Autogas Global adoption by Units and Volume
FIG. 6 Fuel consumption for cooking in rural India (2001 and 2013)
FIG. 7 Porter’s five forces analysis: LPG Market
FIG. 8 Company market share of LPG market, 2013
FIG. 9 Market attractiveness analysis of LPG market, by region, 2013
FIG. 10 Global Liquefied Petroleum Gas market, volume share by source, 2013 and 2020
FIG. 11 Global refinery production volume and revenue, 2013 – 2020 (Million Tons) (USD Billion)
FIG. 12 Global associated gas production volume and revenue, 2013 – 2020 (Million Tons) (USD Billion)
FIG. 13 Global non-associated production volume and revenue, 2013 – 2020 (Million Tons) (USD Billion)
FIG. 14 Global Liquefied Petroleum Gas market, volume share by end-use, 2013 and 2020
FIG. 15 Global LPG consumption by residential/commercial, 2013-2020 (Million tons) (USD Billion)
FIG. 16 Global LPG consumption in petrochemical and refinery sector, 2013-2020 (Million tons) (USD Billion)
FIG. 17 Global LPG consumption by industries, 2013-2020 (Million tons) (USD Billion)
FIG. 18 Global LPG consumption by transportation, 2013-2020 (Million tons) (USD Billion)
FIG. 19 Global LPG consumption by others, 2013-2020 (Million tons) (USD Billion)
FIG. 20 Global Liquefied Petroleum Gas production market, volume share by region, 2013 and 2020
FIG. 21 Global Liquefied Petroleum Gas consumption market, volume share by region, 2013 and 2020
Transparency Market Research
11
Liquefied Petroleum Gas Market
FIG. 22 North America Liquefied Petroleum Gas market production estimates and forecast, 2013-2020 (Million tons) (USD
Billion)
FIG. 23 North America Liquefied Petroleum Gas market consumption estimates and forecast, 2013-2020 (Million tons)
(USD Billion)
FIG. 24 Europe Liquefied Petroleum Gas market production estimates and forecast, 2013-2020 (Million tons) (USD
Billion)
FIG. 25 Europe Liquefied Petroleum Gas market consumption estimates and forecast, 2013-2020 (Million tons) (USD
Billion)
FIG. 26 Asia-Pacific Liquefied Petroleum Gas market production estimates and forecast, 2013-2020 (Million tons) (USD
Billion)
FIG. 27 Asia-Pacific Liquefied Petroleum Gas market consumption estimates and forecast, 2013-2020 (Million tons) (USD
Billion)
FIG. 28 Middle East & Africa Liquefied Petroleum Gas market production estimates and forecast, 2013-2020 (Million tons)
(USD Billion)
FIG. 29 Middle East & Africa Liquefied Petroleum Gas market consumption estimates and forecast, 2013-2020 (Million
tons) (USD Billion)
FIG. 30 South & Central America Liquefied Petroleum Gas market production estimates and forecast, 2013-2020 (Million
tons) (USD Billion)
FIG. 31 South & Central America Liquefied Petroleum Gas market consumption estimates and forecast, 2013-2020
(Million tons) (USD Billion)
List of Tables
TABLE 1 Global LPG Market: Snapshot
TABLE 2 Drivers of LPG Market: Impact Analysis
TABLE 3 Restraints of LPG Market: Impact Analysis
TABLE 4 Opportunities of LPG Market: Impact Analysis
TABLE 5 North America Liquefied Petroleum Gas market volume and forecast, by source segment, 2013 - 2020 (Million
Tons)
Transparency Market Research
12
Liquefied Petroleum Gas Market
TABLE 6 North America Liquefied Petroleum Gas market revenue and forecast, by source segment, 2013 - 2020 (USD
Billion)
TABLE 7 North America Liquefied Petroleum Gas market volume and forecast, by end-use segment, 2013 - 2020 (Million
Tons)
TABLE 8 North America Liquefied Petroleum Gas market revenue and forecast, by end-use segment, 2013 - 2020 (USD
Billion)
TABLE 9 Europe Liquefied Petroleum Gas market volume and forecast, by source segment, 2013 - 2020 (Million Tons)
TABLE 10 Europe Liquefied Petroleum Gas market revenue and forecast, by source segment, 2013 - 2020 (USD Billion)
TABLE 11 Europe Liquefied Petroleum Gas market volume and forecast, by end-use segment, 2013 - 2020 (Million Tons)
TABLE 12 Europe Liquefied Petroleum Gas market revenue and forecast, by end-use segment, 2013 - 2020 (USD Billion)
TABLE 13 Asia-Pacific Liquefied Petroleum Gas market volume and forecast, by source segment, 2013 - 2020 (Million
Tons)
TABLE 14 Asia-Pacific Liquefied Petroleum Gas market revenue and forecast, by source segment, 2013 - 2020 (USD
Billion)
TABLE 15 Asia-Pacific Liquefied Petroleum Gas market volume and forecast, by end-use segment, 2013 - 2020 (Million
Tons)
TABLE 16 Asia-Pacific Liquefied Petroleum Gas market revenue and forecast, by end-use segment, 2013 - 2020 (USD
Billion)
TABLE 17 Middle East & Africa Liquefied Petroleum Gas market volume and forecast, by source segment, 2013 - 2020
(Million Tons)
TABLE 18 Middle East & Africa Liquefied Petroleum Gas market revenue and forecast, by source segment, 2013 - 2020
(USD Billion)
TABLE 19 Middle East & Africa Liquefied Petroleum Gas market volume and forecast, by end-use segment, 2013 - 2020
(Million Tons)
TABLE 20 Middle East & Africa Liquefied Petroleum Gas market revenue and forecast, by end-use segment, 2013 - 2020
(USD Billion)
TABLE 21 South & Central America Liquefied Petroleum Gas market volume and forecast, by source segment, 2013 2020 (Million Tons)
TABLE 22 South & Central America Liquefied Petroleum Gas market revenue and forecast, by source segment, 2013 2020 (USD Billion)
Transparency Market Research
13
Liquefied Petroleum Gas Market
TABLE 23 South & Central America Liquefied Petroleum Gas market volume and forecast, by end-use segment, 2013 2020 (Million Tons)
TABLE 24 South & Central America Liquefied Petroleum Gas market revenue and forecast, by end-use segment, 2013 2020 (USD Billion)
Get Sample Free Report :
http://www.transparencymarketresearch.com/sample/sample.php?flag=S&rep_id=491
About Us
Transparency Market Research is a market intelligence company providing global business information
reports and services. Our exclusive blend of quantitative forecasting and trends analysis provides forwardlooking insight for thousands of decision makers.
We are privileged with highly experienced team of Analysts, Researchers and Consultants, who use
proprietary data sources and various tools and techniques to gather, and analyze information. Our
business offerings represent the latest and the most reliable information indispensable for businesses to
sustain a competitive edge.
Contact
Transparency Market Research
90 State Street,
Suite 700,
Albany
NY - 12207
United States
Tel: +1-518-618-1030
USA - Canada Toll Free 866-552-3453
Email: [email protected]
Website: http://www.transparencymarketresearch.com/
Browse The Market Research Blog :
Transparency Market Research
14
Liquefied Petroleum Gas Market
http://researchandreports.wordpress.com/
Transparency Market Research
15
The global liquefied petroleum gas (LPG) market is extremely fragmented with a large number of players operating in it, states a research study by Transparency Market Research (TMR). The growing number of players entering the global liquefied petroleum gas market is likely to strengthen the competition in the next few years. In 2013, the leading players in the market, namely CNPC, Sinopec, Royal Dutch Shell, ExxonMobil, BP plc, and Valero Energy collectively held a share of 20% of the global liquefied petroleum gas market. These players are emphasizing on branding and market positioning in order to attain a dominant position in the overall market. In addition, the increasing number of mergers and acquisitions for the expansion of retailing and distribution is anticipated to contribute towards the market’s growth in the next few years. Interpret a Competitive outlook Analysis Report with PDF Brochure: http://www.transparencymarketresearch.com/sample/sample.php?flag=S&rep_id=491
© Copyright 2026 Paperzz