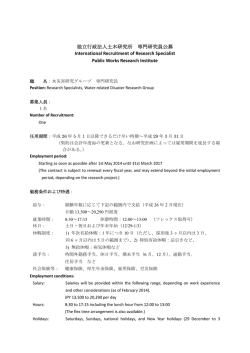
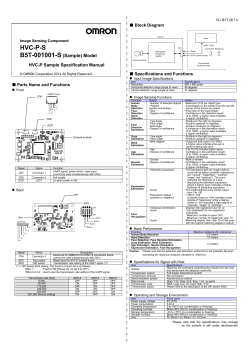
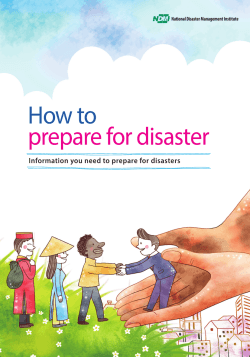
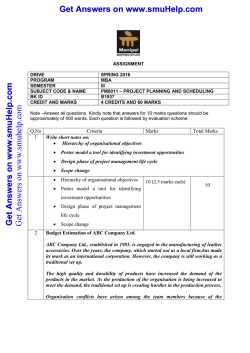
Development of a Simplified Risk Mapping Tool to Facilitate and Optimize Emergency Response to Major Floods (FRAT) Final Report September, 2009 OYO International Corporation Table of Contents page 1. 2. 3. Preface ------------------------------------------------------------------- 1 Background ------------------------------------------------------------- 2 Outline of FRAT Conception ----------------------------------------- 3 3.1 Purpose of FRAT ------------------------------------------------------- 3 3.2 User and Methodology ----------------------------------------------- 3 3.3 Area and Size ----------------------------------------------------------- 3 3.4 Outputs ------------------------------------------------------------------- 4 3.5 Work Duration ---------------------------------------------------------- 4 3.6 Clients -------------------------------------------------------------------- 5 3.7 Personnel of Work ----------------------------------------------------- 5 4. Results based on Power Point Presentation ----------------------- 7 5. Afterwards ------------------------------------------------------------------ 21 -i- 1. Preface This project involves consultancy services for Risk Mapping, more precisely “Development of a Simplified Risk Mapping Tool to Facilitate and Optimize Emergency Response to Major Floods”, hereinafter “FRAT”. The consultancy services have been entrusted on OYO International Corporation, Japan and it will be supported by UN-HABITAT, UNDP GRIP, IFRC and ProVention Consortium, under the Disaster Management Programme (DMP Nairobi/Geneva) and in the context of Emergency Shelter Humanitarian Cluster. The total duration of the project is actual 7 working months, starting from September, 2008 and ending on September, 2009. The purpose of the consultancy services is to develop a simplified risk mapping tool that can be used to produce a Shelter Response Plan and Strategy facilitating and maximizing emergency response and predictability. -1- 2. Background Floods occur in every country almost every year, and are one of the major natural disasters particularly in developing countries. Floods cause vast amount of losses and victims. Although there are various measures in the world for preventing the disasters, not only hardware measures such as strengthening banks of rivers etc., but also software measures such as enhancing awareness of residents/local governments, especially shelter preparation is an effective one for avoiding and reducing the disasters. The extension of damage due to flood disaster of a certain magnitude requires the urgent provision of shelter to protect the lives and well being of the survivors and avoid a large number of casualties. Shelter provision is also the first step towards the recovery of the affected communities. Therefore, quick and efficient provision of shelter is a key factor for not only after but also before events on the successful implementation of emergency and early recovery activities. Usually chaotic situation at all levels that results from the physical, human, technical and economic impacts of the disaster, makes it difficult to provide quick and efficient shelter response. It makes sense therefore, to develop in advance strategies for shelter procurement, preparation and deployment. These strategies need to be based on realistic and adequate risk estimates as of the potential damage that provides information not only on the magnitude of damage but also on its geographic distribution, characteristics, and causes. The main objective of this initiative is to improve capacity to predict and address future post-disaster shelter recovery needs and issues as well as to manage information about on-going risks after a disaster and their implications for shelter planning. This improved capacity will ensure quick and efficient shelter provision after a disaster and will help to optimize resource utilization at both national and international levels. By applying and calibrating the methodology in several pilot countries using actual past events, the applicability and usefulness of the methodology will be demonstrated before its large-scale deployment and utilization. It is envisaged that the methodology will be actually learned in pilot locations in future within the process of gaining in experience and providing major predictability in emergency shelter response. Since various precise methodologies for flood analysis exist, they must be used for practical use after this FRAT learning. RADIUS is an example of this kind of tool, for tutorial on earthquake disaster estimation in order to mitigate/reduce earthquake disasters by local citizens and governmental officers. However, even though RADIUS tool is not for scientific study with precise/accurate estimation one, it has been used for the studies of doctorial course or actual earthquake disaster mitigation plan. This tendency is unreasonable. Considering this lesson, FRAT should be developed with its limitation and applicability not to be used for exceeding utilizations. Further, considering local usage, anytime, anywhere and anyone FRAT can be used with local people’s input data. Thus easy to use without web pages or internet connection is another view. -2- 3. Outline of FRAT Conception 3.1 Purpose of FRAT The purpose of FRAT is to develop Flood version of RADIUS Tool which is the tutorial and public program for flood estimation map generating tool. It is to able to provide easily an estimation of inundation depth map caused by flood at anywhere in the world. The following notes can be considered; - comparison with the existing flood situation - applicability of shelter planning such as basic information for shelter construction - arrangement of manual for the tool - tutorial concept - popular program which enables to be estimate inundation map at anywhere, at anytime by anyone - conserving appropriate accuracy level, though it is reverse concept with above 3.2 Users and Methodology a) Users User of FRAT should be the local government officers of developing countries. And FRAT is expected to be a tutorial program estimating roughly the flood and its disaster at the site. The results of FRAT will be the basic information for planning shelters. The TOR told; - Location, constriction of shelters - Emergency evacuation measures - Flood forecasting But these are difficult to realize wholly. b) Methodology FRAT is expected to be used at anywhere, at anytime by anyone, but it is thought to be; - independent and by non-expert - without connection of web directly - based on freeware without toll - when included in the program, it is all right - same as GIS, freeware is all right, but it should be included - output will be used by popular GIS application Therefore, the methodology used will be the one calibrated on easy evaluation for flood risk. - it can be used by anyone for instance with Microsoft Excel or freeware GIS - whether local data is available or not, the smallest amount of input or default input can be used. - with user support materials such as training and guideline, applicability and limitation 3.3 Area, Size a) Target Area The TOR told the target area would be local basin/drainage, but it is so rough expression. Then, it is impossible to consider the whole drainage of the Ganga etc. and will be a regional basin/drainage. Actually speaking, the target area should be at the widest 20km x 20km size considering the width of the targeted rivers. On the contrary when smallest area such as 1 square -3- km, it may provide less accuracy level. b) Size & number of Grids The accuracy level of FRAT will be regarding to the size of grids for analysis. Considering above condition and the shelter size will be around 100 square m etc., the grid size for analysis will be less than 100m is appropriate. Considering the calculation duration, and input difficulties, less than 100,000 grids are the maximum, which calculation duration will be around several minutes. This may be very difficult to input various information manually by user. c) Size of Map The resulted maps will be used on the desks at local government or public meeting, the scale of maps will be more than 1 to 100,000, and the paper size will be around A3 to A4 size will be the largest. d) Demographic data In order to estimate the flood risks such as inundated buildings and affected population etc., demographic data are necessary, but input their distribution is extremely vast amount of efforts will be required. Then, rough risk or damage rate of risks will be estimated. 3.4 Outputs The outputs of this work would be the followings; 1. A calibrated methodology for fast assessment of Flood Hazard (inundation) and Risk (damage) 2. A simplified tool for Flood Risk Assessment with the characteristics described above 3. All the necessary support materials for the dissemination of the Tool among potential users. The materials would include, among other things, training materials and application guidelines/manual. 4. A short report and a Power Point Presentation (-15slides) summarizing the background, methodology, case-studies, key findings and recommendations for future work. a) Final Outputs The final outputs of FRAT will be - flood inundation map - sometime with snapshots - damage to buildings, agriculture and population - manual etc. for explanation b) Dissemination Considering wider dissemination, the followings will be prepared; - short report - power point presentation background methodology case study -4- findings recommendation for the future 3.5 Work Duration The total duration of work is actually 7-working months and the important schedule of the work will be as follows: Contract duration : from September, 2008 to September, 2009 Inception Report : November 2008 Interim Report : May 2009 Final Report : September 2009 Table 3.1 Chart of Detail Schedule Items Sept. Oct. 2008 Nov. Dec. May Jun. 2009 Jul. Aug. Sept. Preparatory work Review of regarding Input data availability Methodology investigation Program development Installation of program Materials preparation Reporting Reports Inception Interim Draft Final Final The reports will be sent to UN-HABITAT and GRIP/UNDP, that will be disseminated and consolidate comments from other supporting agencies such as IFRC and ProVision Consortium for feedback and further instructions. The consultant team wished to have the evaluation and comments as early as possible since there is a constraint of duration to accomplish the work. The consultant has already applied its inception report in time at the end of November, 2008, still no response from above advisors at the time of the end of January, the works has already delayed. Therefore the final output may not be in time at the beginning of April. Currently, the consultant is considering that all items in the inception report has been agreed by all the advisory members, and continuing the process. 3.6 Clients The clients of the works should be; - UN-HABITAT - GRIP/UNDP - IFRC -5- - ProVention Consortium Disaster Management Programme (DMP Nairobi/Geneva) and Emergency Shelter Humanitarian Cluster. 3.7 Personnel of work The following personnel have been assigned for the successful accomplishment of the project. Overall Coordinator : Mr. Osamu Nishii, Vice Director of OIC Technical Coordinator: Mr. Fumio Kaneko, Chief Engineer of OIC Flood Analysis Team: Leader : Mr. Susumu Nakamura, Manger of Technical Division of OYO Member : Dr. Mahbub Reza, Chief of Water Management Division of OIC System Team: Leader : Mr. Jun Matsuo, Chief of Geophysical Division of OIC Member : Mr. Shukyo Segawa, Chief of Earthquake Engineering Division of OIC Member : Dr. Koichi Hasegawa, Researcher of Engineering Division of OIC Software Team: Leader : Mr. Mitsuhiro Murasaki, Manager of IT Division of OYO Member : Mr. Yoshihiko Noguchi, Researcher of IT Division of OYO -6- 4. Results based on Power Point Presentation The results can be divided into three parts; Part 1 describes background, purpose of FRAT Part 2 is the main part of the Tool of FRAT, and Part 3 summarizes the comments. Part 1: Outline of FRAT • Background • Purpose • Notes on RADIUS & FRAT • Review Result • Users of FRAT Part 2: Process of FRAT • Main Flow of FRAT • Input 1: Target Area • Input 2: Topography data (DEM) • Input 3: Precipitation data • Input 4: Hydrograph data • Analysis 1: Flood Simulation • Result 1: Inundation Map • Input 5: Demographic data • Input 6: Economic Index (vulnerability) data • Analysis 2: Flood Risk Estimation • Result 2: Risk (Damage/Loss) Table Part 3: Others • Limitation of FRAT • Problems to be solved The background and the purpose of the FRAT are shown below but already drawn before. Background • Floods: – in every country, every year, – one of the major natural disasters • • Especially in developing countries: – Floods cause vast amount of losses and victims. – Need to reduce such disasters as much as possible Measures taken so far are mainly applying hardware concepts for preventing Floods: – Need further reduction of Flood disaster applying software concepts: – Enhancing awareness of stakeholders – improving management planning – including effective shelter preparation -7- Purpose of FRAT To develop a simplified hazard & risk mapping tool that can be used To produce a Shelter Response Plan and Strategy facilitating and maximizing emergency response and predictability. To develop Flood version of RADIUS Tool which would serve as tutorial and public program for flood estimation map generating tool. It would be able to provide an estimation of inundation depth anywhere in the world. The following advantages should be noted; - comparison with the existing flood situation analysis tools for shelter planning / construction; - provision of a user friendly manual for the tool - provision of tutorial concept - simple & popular program which enables to be estimate inundation at anywhere, at anytime by anyone (without GIS & Internet) - assuring appropriate accuracy level (as close as possible) under provision of local basic information Notes on RADIUS & FRAT • • • • • • • RADIUS is a tool for tutorial on earthquake disaster estimation in order to mitigate/reduce earthquake disasters by local people. FRAT will focus on RADIUS like tool but for Flood disaster reduction However, RADIUS is a TUTORIAL Tool, not for scientific study with precise/accurate estimation FRAT should be developed with its limitations and applicability not to be used for exceeding applicability. It would consider local usage, anytime, anywhere and by anyone FRAT can be run by local people’s input data. Thus easy to use without any help of web pages or internet connection, is another positive aspect of FRAT -8- The review of the existing software suggest below: Review Result • • • Availability of similar software – Only HAZUS-MH-MR3 • but it is designed only for US and needs • and use of GIS and Internet, and also • It has various black boxes – Thus it is not appropriate for FRAT. Some other existing software – Semi-Real Time flood estimation from precipitation data • now in developing stage in Japan (ICHARM) – When it is developed and internet is made available • it would be better than FRAT FRAT is focusing on tutorial tool like RADIUS – RADIUS is a tool for tutorial on earthquake disaster estimation in order to mitigate/reduce earthquake disasters by local people. – Without expert knowledge, internet and GIS The users of FRAT will be the following. USERS of FRAT • The local government officers of developing countries. – And FRAT is expected to be a tutorial program – estimating roughly the flood and its disaster at the site. • The results of FRAT will be the basic information for planning shelters. – Location, constriction of shelters – Emergency evacuation measures – Flood forecasting • But these users have difficulties in realizing whole situation • User of FRAT will understand – how to approach flood estimation and – will know roughly how to consider shelter planning -9- Part 2 is the main part of FRAT. Part 2: Process of FRAT • • • • • • • • • • • Main Flow of FRAT Input 1: Target Area Input 2: Topography data (DEM) Input 3: Precipitation data Input 4: Hydrograph data Analysis 1: Flood Simulation Result 1: Inundation Map Input 5: Demographic data Input 6: Economic Index (vulnerability) data Analysis 2: Flood Risk Estimation Result 2: Risk (Damage/Loss) Table The main process will be summarized as below. Main Flow of FRAT Target Area Input 2 Demographic Data DEM (topographic Data) Input 6 Input 3 Input 4 Analysis 1 Result 1 Precipitation Data Economical Indices (vulnerability) Hydrograph Data Flood Simulation Analysis 2 Inundation Maps Flood Risk Estimation Result 2 Flood Risks (Tables) Application to Shelter Planning -10- Input 1: Target Area Input 1: Target Area • • • Target size – A local basin (drainage/watershed) • A basin like the Ganges would be too big (unrealistic) • Max 27km x 27km (fixed) Grids size – Around 90m (SRTM data) • # of Grids: 300 x 300 = 90,000 • (manual input is difficult) Sheet size – Scale 1:100,000 (27cm x 27cm): A3 size – Scale 1:200,000 (13.5cm x 13.5cm): A4 size For topographic data (altitude), SRTM data is available for all over the world with around 90m grids. Considering total size around 20km x 20km, grid size of 300 x 300 will be sufficient. And for user friendly, size is fixed. Also, as below, one point input at Left-Top for selection of the target area. Input 1: Target Area • Index – – – – – • Area name, user name, date, case # etc. -11- Area selection – Lat, long – Left-Top Input 2: Topography data (DEM) • ExamExample of Worldwide data>default (stored) – SRTM (NASA) – 90m horizontal resolution – 1m vertical resolution – N50deg to S50deg SRTM(90m Example of SRTM(90m grid) data grid) data ple of HAZUS-MH-MR3 - provide DEM only for US - using GIS through internet SRTM(90m • grid) data Manual Input>option – DIFFICULT – Need exact format – Vast amount of work – (grid by Grid) – No GIS usage Stream line/network, Embankment data are difficult to collect Since Topographic data are so big size, the world should be divided into 10-20 regions with one DVD for each. For instance; America North-East An example of North-West 50m grids in Japan Central (Usu-san Mt. sheet) South-North South-South Asia East East-South South West Central Middle-East Europe East Central West North South Africa North-East North West Central South Oceania Australia -12- Input 3: Precipitation data コロンボ クア ラルンプ ール A - Average Rainfall for 30 years (1971-2000) シ ンガポール セーシ ェル ジ ョ ージ タウン Worldwide data are very limited – Exact hourly data is necessary – Though yearly, monthly, maximum daily data for some cities are available – Then skipped as Default マナウス サルバドル ア ガニア マジ ュロ コロール ホニア ラ タワラ島 フナフテ ィ 1000 ア ピア マダン コナクリ ルンギ プ レサンス ココビーチ ポート ハーコート 800 ロバーツフィールド マイア ミ ベリーズ グラント リーア ダムス国際空港 mm/month • Precipitation (mm) ザンデレイ 1200 ピア ルコ ナンディ ジ ャカルタ 600 ホノルル ダッカ コルカタ(カルカッタ) ムンバイ(ボンベイ) チェンナイ(マドラス) ヤンゴ ン バンコク 400 ビエ ンチャン バマコ ビサウ キガリ ポワント ノワール ボセンベレ ヤウンデ 200 コト ヌー ロメ クマシ ア ビジ ャン マプ ート チレカ ナッソー 0 ハバナ Jan Feb Mar Apr May Jun Jul Aug Sept Oct Nov キングスト ン Dec サント ドミンゴ サンサルバドル HAZUS-MH-MR3 - Input return period only - Start from discharge • チョ ルテ カ サンホセ Monthly data at Tropical cities Manual Input > option (difficult) – Hourly precipitation data – Together with • Other data are necessary • Total duration, • Upstream area, • Stream length, distance etc. – For identifying Hydrographs For actual input for flood is discharge or flow volume per time. Since precipitation data is mostly not available and to be changed to discharge, this process will be converted to the next process. Looking the precipitation data in the world, Polar/Frigid and Desert area need not to be targeted, therefore topographic data will be prepared for between N50 and S50degree. カシ ュガル コロンボ ベオグラード クア ラルンプ ール A - Average Rainfall for 30 years (1971-2000) C - Average Rainfall for 30 years (1971-2000) シ ンガポール B - Average Rainfall for 30 years (1971-2000) セーシ ェル ジ ョ ージ タウン ブ カレスト ト ビリシ プ サン ウーハン(武漢) ザンデレイ マナウス 1200 1200 サルバドル シ ャンハイ(上海) 1200 タイペイ(台北) ア ガニア ア ト ランタ マジ ュロ ダラス コロール ワシ ント ン ア ンマン ホニア ラ フナフテ ィ Desert 1000 ア ピア マダン コナクリ ア スマラ ドドマ ンジ ャメナ プ レサンス ワガドゥーグー ココビーチ ルア ンダ ア シ ハバード ベリーズ ダマスカス ホノルル ダッカ コルカタ(カルカッタ) ムンバイ(ボンベイ) ロンドン ダブ リン コペンハーゲン テ ビルト ルクセンブ ルグ ランチョ ウ(蘭州) 600 デンバー サル島 リヤド クウェート ルブ ルジ ェ ベルリン 600 ウィーン プ ラハ ワルシ ャワ ブ ダペスト スコピエ バグダット ソフィア バーレーン ヤンゴ ン ナイロビ ア ブ ダビ バンコク 400 ビエ ンチャン シ ーブ 400 シアトル メキシ コシ テ ィ カラチ バマコ サンタフェデボゴ ダ ヌア クシ ョ ット ビサウ ウェリント ン カイロ キガリ メルボルン ア スワン ポワント ノワール キャンベラ ハルツーム ボセンベレ レイキャビク ジプチ ヤウンデ 200 シ ドニー チューリヒ ウランバート ル ウルムチ チェンナイ(マドラス) 400 ブ エ ノスア イレス ウッケル mm/month mm/month ジ ャカルタ 600 ロチャ カンダハール グラント リーア ダムス国際空港 ピア ルコ ア スンシ オン 800 ア リススプ リングス マイア ミ サンパウロ スト ックホルム ウィント フック 800 ロバーツフィールド ナンディ 1000 ト リポリ ルンギ ポート ハーコート 800 ダカール ニューヨーク Temperate ニア メ mm/month Tropic 1000 タワラ島 200 コト ヌー モ ガディシ ュ ラスベガス ロメ 200 マドリード リスボン ローマ リマ クマシ ルッア カシ ュガル ア ビジ ャン アテネ マプ ート イスタンブ ール チレカ ラルナカ ナッソー 0 Jan Feb Mar Apr May Jun Jul Aug Sept Oct Nov キングスト ン Dec 0 0 ハバナ 1 サント ドミンゴ 2 3 4 5 6 7 8 9 10 11 タシ ケント ベイルート 1 12 2 3 4 E - Average Rainfall for 30 years (1971-2000) D - Average Rainfall for 30 years (1971-2000) 1200 1200 1000 ボストン シ カゴ Polar デトロ イト ヘルシ ン キ スリア チ タリン 800 サン クトペテ ルブ ルグ カウナス ミン スク キエ フ カラガン ダ モ ン トリオール エ ドモ ン トン mm/month mm/month モ スクワ オムスク 600 ポストーク基地 ア ン マサリク ディクソン 600 バロ ー ユーリカ ウスア イア オスロ ア ン カレ ジ ピ ョン ヤン 400 ソウル 400 ハルビ ン シ ェン ヤン ( 瀋陽) ペキン ( 北京) ウラジ オストク イルクーツ ク 200 オイミャコン 200 0 0 1 2 3 4 5 6 7 8 9 10 11 12 8 9 10 11 12 13 エ ルサレム ラバト サンホセ 800 7 ペシ ャワール チョ ルテ カ Frigid 6 テ ヘラン サンサルバドル 1000 5 1 2 3 4 5 6 7 8 9 10 11 12 Monthly average precipitation of climate class wise -13- Input 4: Hydrograph data • Worldwide data are very limited – Only some famous rives are available Each River, Basin has characteristic pattern for that basin/catchment Hydrographs are classified into typology, basically by the factors Japan Discharge (m3/s) Hydrograph that specifies the flood Europe, US Q (maximum discharge) and T (duration) • days Then typological data input would be by the factors of: • Q (maximum discharge) • T (duration) > default • Season of dry or medium or rainy for Asian region Inlet point of Hydrograph • • Manually Hydrograph input by Users will be difficult Typical Hydrographs to be selected by users are classified into below from past examples in the world. Steep and short (like Japan or Flush Flood) Gentle and long (like Europe or Asia) Rainy and dry season (like Asia) 35000 30000 Tone Kitakami Kiso Chikugo Shinano Loire Colombia Rhein Rhein Rhein Rhein Tenessy Danube Rhein Ayeyarwady Ayeyarwady Ayeyarwady Ayeyarwady discharge (m3/day) 25000 20000 15000 10000 5000 0 1 10 days -14- 100 Examples of typical Hydrograph in the world Cases are set to the below 12 cases. Steep/Short TYPE SEASON Q max(m3/day) 15,000 10,000 5,000 T (days) 4 4 4 Dry 15,000 10,000 15 15 5,000 15 Gentle/Long Medium 15,000 10,000 5,000 15 15 15 TYPE: Steep/Short 16,000 Q: discharge (m3/day) 14,000 12,000 15000 10,000 10000 8,000 5000 6,000 4,000 2,000 0 0.1 1.0 10.0 days TYPE: Gentle/Long (Dry Season) 16,000 Q: discharge (m3/day) 14,000 12,000 15000 10,000 10000 8,000 6,000 5000 4,000 2,000 0 0.1 1.0 10.0 100.0 days TYPE: Gentle/Long (Medium Season) Q: discharge (m3/day) 20,000 18,000 16,000 14,000 12,000 15000 10000 10,000 8,000 6,000 4,000 5000 2,000 0 0.1 1.0 10.0 100.0 days TYPE: Gentle/Long (Rainy Season) Q: discharge (m3/day) 35,000 30,000 25,000 15000 20,000 10000 15,000 5000 10,000 5,000 0 0.1 1.0 10.0 100.0 days -15- Rainy 15,000 10,000 15 15 5,000 15 Analysis 1: Flood Simulation • Various simulation methods exist – Commonly practical use with advanced ones • Such as HEC, HAZUS-MH, Unit Hydrograph method, Storage Function method, Discharge Function method, Kinematic Wave method, Tank modeling etc. – These methods require precise and various data – Also requires advanced technologies, calculation tools with expert judgments • FRAT is tutorial – Even less accuracy, easy to access and easy to understand • FRAT has an analysis in flood simulation – Flood flow simulation from Hydrograph data by a simple differential modeling with DEM – Without input precipitation data – Manning’s roughness coefficients are set as average values – More than 20m than inlet altitude should be non-calculation area. Analysis 1: Flood Simulation Inlet water level model Down stream t=0 S1 topography S2 S3 S4 S5 S6 S7 S8 S9 1 2 3 4 5 6 7 8 9 S1 S2 S3 S4 S5 S6 S7 S8 S9 1 2 3 4 5 6 7 8 9 8-10 6-8 4-6 2-4 0-2 Inlet point should8-10be identified Needs verification using actual past events t=2.5S1hours S1 S2 S3 S4 S5 S6 S7 S8 S9 1 2 3 4 5 6 7 8 9 S2 S3 S4 S5 S6 S7 S8 S9 1 2 3 4 5 6 7 8 9 6-8 4-6 2-4 0-2 t=20hours 0.2-0.25 0.15-0.2 0.1-0.15 0.05-0.1 0-0.05 0.2-0.25 0.15-0.2 0.1-0.15 0.05-0.1 0-0.05 Altitude data are drawn as one value at each grid with 90m width, then rivers cannot be identified as reality, in many cases, width of river will be one grid size. Ordinary water level at river or low land will be estimated by the discharge amount during first one day before precipitation. -16- Result 1: Inundation Maps -16- Result 1: Inundation Map • • • • Inundation Map – Distribution of maximum inundation depth – Distribution of inundation depth at four time sections • Time sections will be 4 at start of raining, and every quarter duration of raining – Time for 0.5m inundation depth – Time for maximum inundation depth Data – Maximum inundation depth at each grid – Inundation depth at a couple of time sections at each grid • Time sections are depending on the duration of Hydrograph – Time for 0.5m and maximum inundation depth at each grid • Time starts with the start of precipitation – Percentages of grids for inundation depth (for risk analysis) – Data format should be considered for availability of other maps such as Google to superimpose on GIS Index of the calculation (name etc.) Type of discharge, season – Steep/shirt or gentle/long and dry or medium or rainy season – Inlet point, grid unit length An example of the simulated results for inundation depths are below. -17- An example of the inundation simulated results are shown below. These data can be shown as grids maps and can be used as GIS data. -18- Input 5: Demographic Data To estimate damage and loss due to the estimated flood/inundation, demographic data are necessary. These are the followings: • Population – Total Number of population • Buildings – Critical buildings – Community, school, hospital, police etc. – Residential houses • Field & Crops – Agricultural fields e.g. upland and wet land (paddy fields) – Amount of Products • rice, wheat, corn, beans, etc. However, these data should have their exact locations and characteristics or vulnerability for inundation depth etc. Looking world wide, these are mostly unknown and difficult to input inthis regard. Therefore, it is better for this input to be skipped and after FRAT will provide the inundation results and damage rates. And after calculation, using the results of FRAT, users swill estimate these damage or losses. Input 6: Economical Indices (vulnerability) For estimating losses, Loss = number of element * damage rate * unit cost for creation FRAT provide damage rate, and users will calculate loss using number of element in the area and unit cost for them. Thus this input will be default. – Target • Damage to Buildings • Effects on Human lives • Loss to Agricultural crops – Japanese manual for economic effects estimation will be used • rice, wheat, corn, beans, etc. HAZUS-MH-MR - has damage & Loss estimation -for buildings, lifelines, agriculture and human etc. - Most of the critical methodologies are in black boxes - for only US using GIS -19- Analysis 2: Flood Risk Estimation • Damage rates – estimated by Japanese manual – for economic effects estimation HOUSE (mainly wooden) damage rate(%) 0.25 land inclination <1/1,000 3.2 1/500 - 1/1.000 4.4 >1/500 5.0 inundation depth (m) 0.5 0.75 1.5 2.5 9.2 11.9 26.6 58.0 12.6 17.6 34.3 64.7 14.4 20.5 38.2 68.1 3 83.4 87.0 88.8 mud deposit <0.5 >0.5 inundation depth (m) 0.5 0.75 1.5 2.5 14.5 32.6 50.8 92.8 3 99.1 mud deposit <0.5 >0.5 50.0 84.5 entreprize PROPERTY/ASSET inundation depth (m) damage rate(%) 0.25 0.5 0.75 1.5 2.5 Depreciation 9.9 23.2 45.3 78.9 96.6 Stock 5.6 12.8 26.7 58.6 89.7 3 99.5 98.2 mud deposit <0.5 >0.5 54.0 81.5 48.0 78.0 agriculture/fishery PROPERTY/ASSET inundation depth (m) damage rate(%) 0.25 0.5 0.75 1.5 2.5 Depreciation 0.0 15.6 23.7 29.7 65.1 Stock 0.0 19.9 37.0 49.1 76.7 3 69.8 83.1 mud deposit <0.5 >0.5 37.0 72.5 58.0 84.5 43.0 78.5 MATERIALS in house damage rate(%) 0.25 2.1 AGRICULTURAL PRODUCTS damage rate (%) 1-2 inundated days damage (%) wet field rice(peddy) 21 20 dry field rice 11 potatos 42 cabbages 19 kitchen vegetables 32 root vegetables 22 gourds 23 beans 27 average(field) • 0-0.25 3-4 5-6 30 34 30 50 33 46 30 41 42 36 47 50 70 46 59 42 54 54 inundation depth (m) 0.25-1 1-2 3-4 5-6 >7 >7 50 60 50 83 59 62 56 67 67 24 31 27 58 20 43 31 30 35 44 40 40 70 44 57 38 44 48 50 50 75 83 48 100 51 60 67 71 60 88 97 75 100 100 73 74 mud deposit (m) >1 1-2 37 44 38 47 44 73 40 40 51 3-4 54 60 63 75 58 87 50 50 67 5-6 >7 64 72 95 100 71 100 63 68 81 74 82 100 100 84 100 100 81 91 <0.5 0.5-1 >1 70 100 100 68 81 100 Losses – estimated using economic index for local area by users Result 2: Risk (damage/loss) Table Based on above damage vulnerability information and FRAT inundation results, users can calculate easily below damages. And together with unit cost for each at the local, losses cam be estimated. • Risk (damage/loss) Table – Damage rates to Buildings etc. – Loss rates to agricultural crops/fields -20- Limitation of FRAT • • • • • FRAT is the Tutorial Tool – for enhancing awareness against Flood at local levels – by developing skills for analyzing floods easily and quickly. For Practical/Actual shelter planning at local area, – more advanced technology with more precise data must be applied for practical use – considering all the related factors, such as river, catchment at upstream, Manning’s roughness coefficient etc. Therefore, FRAT is not recommended for actual shelter planning. FRAT should be used under above limitation and applicability Problems to be solved • • • • 5. 1. Without loss such as evaporation, percolation etc. – The followings are not considered in FRAT • Upstream catchment • River shape • Actual Manning’s roughness coefficient • Precipitation • Etc. – But it means more vulnerable estimation better for disaster management 2. Needs time for calculation – 5 to 10 minutes for 1 week flood flow simulation 3. Risk estimation using Japanese criteria – Damage and loss estimation will be conducted by users using their knowledge together with the FRAT result of inundation – Needs more clarification/explanation for universal use 4. To make it more Familiar – Need more data for landmark, area boundaries, but maybe difficult for availability, memory size etc. Afterwards At the end, this FRAT is the preliminary or first trial for this kind of tool for flood analysis, and hoping the future development and application of FRAT. September, 2009 -21- OYO International Corporation
© Copyright 2026 Paperzz