PyQGIS developer cookbook
リリース 2.2
QGIS Project
2014 年 12 月 04 日
Contents
1 はじめに
1.1 Python コンソール . . . . . . . . . . . . . . . . . . . . . . . . . . . . . . . . . . . . . . . . . .
1.2 Python プラグイン . . . . . . . . . . . . . . . . . . . . . . . . . . . . . . . . . . . . . . . . . .
1.3 Python アプリケーション . . . . . . . . . . . . . . . . . . . . . . . . . . . . . . . . . . . . . .
1
1
2
2
2 レイヤのロード
2.1 ベクタレイヤ . . . . . . . . . . . . . . . . . . . . . . . . . . . . . . . . . . . . . . . . . . . .
2.2 ラスタレイヤ . . . . . . . . . . . . . . . . . . . . . . . . . . . . . . . . . . . . . . . . . . . .
2.3 マップレイヤレジストリ . . . . . . . . . . . . . . . . . . . . . . . . . . . . . . . . . . . . . .
5
5
6
7
3 ラスターレイヤを使う
3.1 レイヤについて
3.2 描画スタイル .
3.3 レイヤの更新 .
3.4 値の検索 . . . .
.
.
.
.
.
.
.
.
.
.
.
.
.
.
.
.
.
.
.
.
.
.
.
.
.
.
.
.
.
.
.
.
.
.
.
.
.
.
.
.
.
.
.
.
.
.
.
.
.
.
.
.
.
.
.
.
.
.
.
.
.
.
.
.
.
.
.
.
.
.
.
.
.
.
.
.
.
.
.
.
.
.
.
.
.
.
.
.
.
.
.
.
.
.
.
.
.
.
.
.
.
.
.
.
.
.
.
.
.
.
.
.
9
9
9
11
11
4 ベクターレイヤを使う
4.1 ベクターレイヤの反復処理 . . . . . . . . . .
4.2 ベクターレイヤの修正 . . . . . . . . . . . .
4.3 ベクターレイヤを編集バッファで修正する.
4.4 空間インデックスを使う . . . . . . . . . . .
4.5 ベクターレイヤの作成 . . . . . . . . . . . .
4.6 メモリープロバイダー . . . . . . . . . . . .
4.7 ベクタレイヤーの外観 (シンボロジ) . . . . .
.
.
.
.
.
.
.
.
.
.
.
.
.
.
.
.
.
.
.
.
.
.
.
.
.
.
.
.
.
.
.
.
.
.
.
.
.
.
.
.
.
.
.
.
.
.
.
.
.
.
.
.
.
.
.
.
.
.
.
.
.
.
.
.
.
.
.
.
.
.
.
.
.
.
.
.
.
.
.
.
.
.
.
.
.
.
.
.
.
.
.
.
.
.
.
.
.
.
.
.
.
.
.
.
.
.
.
.
.
.
.
.
.
.
.
.
.
.
.
.
.
.
.
.
.
.
.
.
.
.
.
.
.
.
.
.
.
.
.
.
.
.
.
.
.
.
.
.
.
.
.
.
.
.
.
.
.
.
.
.
.
.
.
.
.
.
.
.
.
.
.
.
.
.
.
.
.
.
.
.
.
.
.
.
.
.
.
.
.
13
13
14
15
16
17
18
19
5 ジオメトリの操作
5.1 ジオメトリの構成 . . . . . . . . . . . . . . . . . . . . . . . . . . . . . . . . . . . . . . . . . .
5.2 ジオメトリにアクセス . . . . . . . . . . . . . . . . . . . . . . . . . . . . . . . . . . . . . . .
5.3 ジオメトリの述語と操作 . . . . . . . . . . . . . . . . . . . . . . . . . . . . . . . . . . . . . .
27
27
28
28
6 投影法サポート
6.1 空間参照系 . . . . . . . . . . . . . . . . . . . . . . . . . . . . . . . . . . . . . . . . . . . . . .
6.2 投影法 . . . . . . . . . . . . . . . . . . . . . . . . . . . . . . . . . . . . . . . . . . . . . . . .
31
31
32
7 マップキャンバスの利用
7.1 マップキャンバスの埋め込み . . . . . . . . . .
7.2 マップキャンバスでのマップツールズの利用 .
7.3 ラバーバンドと頂点マーカー . . . . . . . . . .
7.4 カスタムマップツールズの書き込み . . . . . . .
7.5 カスタムマップキャンバスアイテムの書き込み
.
.
.
.
.
33
33
34
35
36
37
8 地図のレンダリングと印刷
8.1 単純なレンダリング . . . . . . . . . . . . . . . . . . . . . . . . . . . . . . . . . . . . . . . .
8.2 マップコンポーザを使った出力 . . . . . . . . . . . . . . . . . . . . . . . . . . . . . . . . . .
39
39
40
9 表現、フィルタリング及び値の算出
9.1 パース表現 . . . . . . . . . . . . . . . . . . . . . . . . . . . . . . . . . . . . . . . . . . . . . .
9.2 評価表現 . . . . . . . . . . . . . . . . . . . . . . . . . . . . . . . . . . . . . . . . . . . . . . .
43
44
44
.
.
.
.
.
.
.
.
.
.
.
.
.
.
.
.
.
.
.
.
.
.
.
.
.
.
.
.
.
.
.
.
.
.
.
.
.
.
.
.
.
.
.
.
.
.
.
.
.
.
.
.
.
.
.
.
.
.
.
.
.
.
.
.
.
.
.
.
.
.
.
.
.
.
.
.
.
.
.
.
.
.
.
.
.
.
.
.
.
.
.
.
.
.
.
.
.
.
.
.
.
.
.
.
.
.
.
.
.
.
.
.
.
.
.
.
.
.
.
.
.
.
.
.
.
.
.
.
.
.
.
.
.
.
.
.
.
.
.
.
.
.
.
.
.
.
.
.
.
.
.
.
.
.
.
.
.
.
.
.
.
.
.
.
.
.
.
.
.
.
.
.
.
.
.
.
.
.
.
.
i
9.3
例 . . . . . . . . . . . . . . . . . . . . . . . . . . . . . . . . . . . . . . . . . . . . . . . . . . .
44
10 設定の読み込みと保存
47
11 ユーザとのコミュニケーション
11.1 Showing messages. The QgsMessageBar class. . . . . . . . . . . . . . . . . . . . . . . . . . . .
11.2 プロセス表示中 . . . . . . . . . . . . . . . . . . . . . . . . . . . . . . . . . . . . . . . . . . .
11.3 ロギング . . . . . . . . . . . . . . . . . . . . . . . . . . . . . . . . . . . . . . . . . . . . . . .
49
49
52
52
12 Python プラグインの開発
12.1 プラグインを書く . . . . . . . . . . . . . . . . . . . . . . . . . . . . . . . . . . . . . . . . . .
12.2 プラグインの内容 . . . . . . . . . . . . . . . . . . . . . . . . . . . . . . . . . . . . . . . . . .
12.3 ドキュメント . . . . . . . . . . . . . . . . . . . . . . . . . . . . . . . . . . . . . . . . . . . .
55
55
56
60
13 書き込みの IDE 設定とデバッグプラグイン
13.1 Windows 上で IDE を設定するメモ . . . . . . . . . . . . . . . . . . . . . . . . . . . . . . . .
13.2 Eclipse と PyDev を利用したデバッグ . . . . . . . . . . . . . . . . . . . . . . . . . . . . . . .
13.3 Debugging using PDB . . . . . . . . . . . . . . . . . . . . . . . . . . . . . . . . . . . . . . . .
61
61
62
66
14 プラグインレイヤの利用
14.1 QgsPluginLayer のサブクラス化 . . . . . . . . . . . . . . . . . . . . . . . . . . . . . . . . . .
67
67
15 QGIS の旧バージョンとの互換性
15.1 プラグインメニュー . . . . . . . . . . . . . . . . . . . . . . . . . . . . . . . . . . . . . . . .
69
69
16 あなたのプラグインのリリース
16.1 公式の python プラグインリポジトリ . . . . . . . . . . . . . . . . . . . . . . . . . . . . . . .
71
71
17 コードスニペット
17.1 キーボードショートカットによるメソッド呼び出し方法 . . . . . . . . . . . . . . . . . . . .
17.2 How to toggle Layers (work around) . . . . . . . . . . . . . . . . . . . . . . . . . . . . . . . .
17.3 選択した機能の属性テーブルへのアクセス方法 . . . . . . . . . . . . . . . . . . . . . . . . .
73
73
73
74
18 ネットワーク分析ライブラリ
18.1 一般情報 . . . . . . . . . . . . . . . . . . . . . . . . . . . . . . . . . . . . . . . . . . . . . . .
18.2 Building graph . . . . . . . . . . . . . . . . . . . . . . . . . . . . . . . . . . . . . . . . . . . .
18.3 グラフ分析 . . . . . . . . . . . . . . . . . . . . . . . . . . . . . . . . . . . . . . . . . . . . . .
75
75
75
77
ii
Chapter 1
はじめに
このドキュメントはチュートリアルとリファレンスガイドの両方の役割を意図して書かれています。すべ
てのユースケースを満たしてはいませんが、主要な機能の良い概要となるでしょう。
0.9 リリースから QGIS は Python を使ったスクリプト処理をサポートしました。Python はスクリプト処理
でもっとも好まれている言語の一つだと思います。PyQGIS バインディングは SIP と PyQt4 に依存してい
ます。これは SIP は SWIG の代わりに広く使われていて、QGIS のコードは Qt ライブラリに依存していま
す。Qt の Python バインディング (PyQt) も SIP を使っていて、これにより PyQt による PyQGIS の実装が
シームレスに実現しています。
TODO: PyQGIS が動かせるまで (マニュアルの補完、トラブルシューティング)
QGIS python バインディングを使う方法はいくつかあり、ここでは次の内容をカバーします:
• QGIS の中の Python コンソールのコマンドについて
• Python でプラグインを作り、使う方法
• QGIS API ベースのカスタムアプリケーションの作成
QGIS ライブラリのクラスのドキュメントは ‘完全な QGIS API <http://doc.qgis.org/>‘_ のリファレンスにあ
ります。Python の QGIS API は C++ の API とほぼ同じです。
There are some resources about programming with PyQGIS on QGIS blog. See QGIS tutorial ported to Python for
some examples of simple 3rd party apps. A good resource when dealing with plugins is to download some plugins
from plugin repository and examine their code. Also, the python/plugins/ folder in your QGIS installation
contains some plugin that you can use to learn how to develop such plugin and how to perform some of the most
common tasks
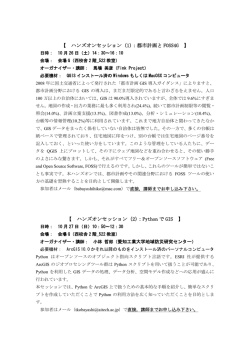
1.1 Python コンソール
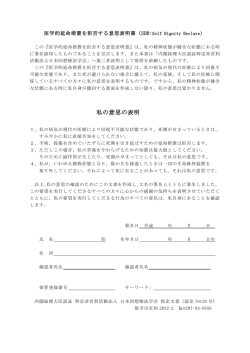
スクリプト処理をする上で、(QGIS に) 統合されている Python コンソールから多くの利点を得られるでしょ
う。これはメニューの プラグイン → Python コンソール から開くことができます。コンソールはモーダル
ではないユーティリティウィンドウに開きます:
上記のスクリーンショットはレイヤーのリストから現在選択中のレイヤーを取得して、ID や他の情報を表
示してるところを見せていて、もしベクターレイヤーであれば、フューチャーの数を表示することができ
ます。QGIS 環境とやりとりするには QgisInterface のインスタンスである qgis.utils.iface 変
数を使います。このインターフェイスはマップキャンバス、メニュー、ツールバーやその他の QGIS アプ
リケーションのパーツにアクセスすることができます。
For convenience of the user, the following statements are executed when the console is started (in future it will be
possible to set further initial commands):
from qgis.core import *
import qgis.utils
1
PyQGIS developer cookbook, リリース 2.2
Figure 1.1: QGIS Python コンソール
このコンソールをたびたび使うなら、ショートカットを設定しておくとよいでしょう (メニューの 設定 →
ショートカットの構成... から行えます)
1.2 Python プラグイン
QGIS はプラグインによる機能拡張が可能です。元々は C++でのみ可能でした。QGIS に Python サポート
を追加したことで、Python でもプラグインを書く事ができるようになりました。C++プラグインよりもよ
りよい利点は簡単な配布 (プラットフォームごとのコンパイルする必要がありません) ができ、また簡単に
開発ができます。
様々な機能をカバーする多くのプラグインは Python サポートが導入されてから書かれました。プラグイン
のインストーラは Python プラグインの取得、アップグレード、削除を簡単に行えます。様々なプラグイン
のソースが Python Plugin Repositories から見つけることができます。
Python でプラグインを作るのはとても簡単です。詳細は plugins を見てください。
1.3 Python アプリケーション
GIS データを処理するときは、繰り返し同じタスクを実行するのに簡単なスクリプトを書いて自動化する
ことがたびたびあります。PyQGIS なら完璧に行えます — qgis.core モジュールを import すれば、初期
化が行われて処理を行う準備が完了します。
もしくはいくつかの GIS の機能 — いくつかのデータの距離を測ったり、地図を PDF に変換したり、または
他の機能など – を使ったインタラクティブなアプリケーションを作りたいのかもしれません。 qgis.gui
モジュールは様々な GUI コンポーネントを追加することができ、とりわけマップキャンバスの widget は
ズームやパンや他のマップを制御するツールと一緒にアプリケーションに簡単に組み込むことができます。
1.3.1 PyQGIS をカスタムアプリケーションで使う
注意: qgis.py という名前をあなたのテストスクリプトで*使わないでください* — このスクリプトの名
前がバインディングを隠蔽してしまって python で import できなくなるでしょう。
まずはじめに、qgis モジュールを import する必要があります。リソース - プロジェクションのデータベース
やプロバイダなど — を読み込めるように QGIS のパスを通します。もし set prefix path の2つ目の引数に
2
Chapter 1. はじめに
PyQGIS developer cookbook, リリース 2.2
True をセットしたら、QGIS は prefix ディレクトリの下の全てのパスを初期化するでしょう。 initQgis()
関数を呼ぶことは QGIS が存在するプロバイダを探すのにとても重要な事です。
from qgis.core import *
# supply path to where is your qgis installed
QgsApplication.setPrefixPath("/path/to/qgis/installation", True)
# load providers
QgsApplication.initQgis()
これで QGIS API — レイヤーを読み込んだり、処理を行ったり、マップキャンバスと共に GUI を起動した
り - を動かす事ができます。可能性は無限です :-)
QGIS ライブラリを使い終わったら、 exitQgis() を呼んで全て終了 (例えばマップレイヤのレジストリ
をクリアにしてレイヤーを削除したり) することができます。
QgsApplication.exitQgis()
1.3.2 カスタムアプリケーションを実行する
QGIS のライブラリと Python モジュールが一般的な場所に置かれて無ければ、システムに適切な場所を伝
える必要があるでしょう — そうしないと Python はエラーを吐きます:
>>> import qgis.core
ImportError: No module named qgis.core
これは PYTHONPATH という環境変数をセットすれば治ります。次のコマンドで qgispath の部分を実際
に QGIS をインストールした場所に差し替えてください:
• Linux では: export PYTHONPATH=/qgispath/share/qgis/python
• Windows では: set PYTHONPATH=c:\qgispath\python
これで PyQGIS モジュールのパスがわかるようになりました。一方これらは qgis_core と ‘‘qgis_gui‘‘ラ
イブラリに依存します (Python ライブラリはラッパーとして振る舞うだけです)。これらのライブラリのパ
スが OS で読み込めないものであれば、またもや import エラーが発生するでしょう (このメッセージはシス
テムにかなり依存していることを示します):
>>> import qgis.core
ImportError: libqgis_core.so.1.5.0: cannot open shared object file: No such file or directory
これを修正するには QGIS ライブラリが存在するディレクトリを動的リンカのパスに追加するをします:
• Linux では: export LD_LIBRARY_PATH=/qgispath/lib
• Windows では: set PATH=C:\qgispath;%PATH%
これらのコマンドはブートストラップスクリプトに入れておくことができます。PyQGIS を使ったカスタム
アプリケーションを配布するには、これらの二つの方法が可能でしょう:
• QGIS を対象となるプラットフォームにインストールするのをユーザに要求します。アプリケーショ
ンのインストーラは QGIS ライブラリの標準的な場所を探すことができ、もし見つからなければユー
ザがパスをセットできるようにします。この手段はシンプルである利点がありますが、しかしながら
ユーザに多くの手順を要求します。
• アプリケーションと一緒に QGIS のパッケージを配布する方法です。アプリケーションのリリースに
はいろいろやることがあるし、パッケージも大きくなりますが、ユーザを追加ソフトウェアをダウン
ロードをしてインストールする負荷から避けられるでしょう。
これらのモデルは組み合わせることができます - Windows と Mac OS X ではスタンドアローンアプリケー
ションとして配布をして、Linux では QGIS のインストールをユーザとユーザが使っているパッケージマ
ネージャに任せるとか。
1.3. Python アプリケーション
3
Chapter 2
レイヤのロード
データのレイヤをオープンしましょう.QGIS はベクタとラスタレイヤを認識できます. 加えてカスタムレイ
ヤタイプを利用することもできますが, それについてここでは述べません.
2.1 ベクタレイヤ
ベクタレイヤをロードするためにはレイヤのデータソース識別子を指定してください, それはレイヤの名前
とプロバイダの名前です:
layer = QgsVectorLayer(data_source, layer_name, provider_name)
if not layer.isValid():
print "Layer failed to load!"
データソース識別子は文字列でそれぞれのデータプロバイダを表します. レイヤ名はレイヤリストウィジェッ
トで使われます. レイヤが正常にロードされたかどうかをチェックすることは重要です. 正しくロードされ
ていない場合は不正なレイヤインスタンスが返ります.
以下のリストはベクタデータプロバイダを使って様々なデータソースにアクセスする方法が記述されてい
ます.
• OGR ライブラリ (shapefiles と多くの他の形式)—データソースはファイルパスです
vlayer = QgsVectorLayer("/path/to/shapefile/file.shp", \
"layer_name_you_like", "ogr")
• PostGIS データベース — データソースは Post g reSQL データベースへの接続を作るために必要な文
字列です. この文字列を使って QgsDataSourceURI クラスを作ることができます. ただし QGIS が
Postgres サポートつきでコンパイルされていないと利用できません.:
uri = QgsDataSourceURI()
# set host name, port, database name, username and password
uri.setConnection("localhost", "5432", "dbname", "johny", "xxx")
# set database schema, table name, geometry column and optionaly
# subset (WHERE clause)
uri.setDataSource("public", "roads", "the_geom", "cityid = 2643")
vlayer = QgsVectorLayer(uri.uri(), "layer_name_you_like", "postgres")
• CSV または他のデリミテッドテキストファイル – 区切り文字としてセミコロン,x 座標フィールドが
“x” で y 座標フィールドが “y” のファイルを開く手順はこのとおりです:
uri = "/some/path/file.csv?delimiter=%s&xField=%s&yField=%s" % (";", "x", "y")
vlayer = QgsVectorLayer(uri, "layer_name_you_like", "delimitedtext")
5
PyQGIS developer cookbook, リリース 2.2
Note: from QGIS version 1.7 the provider string is structured as a URL, so the path must be prefixed with
file://. Also it allows WKT (well known text) formatted geomtries as an alternative to “x” and “y” fields,
and allows the coordinate reference system to be specified. For example
uri = "file:///some/path/file.csv?delimiter=%s&crs=epsg:4723&wktField=%s" \
% (";", "shape")
• GPX files — “gpx” データプロバイダを使うと gpx ファイルから tracks,routes, waypoints を読み出す
ことができます. ファイルを開く場合 T タイプ (track/route/waypoint) の指定が url の一部として必要
です:
uri = "path/to/gpx/file.gpx?type=track"
vlayer = QgsVectorLayer(uri, "layer_name_you_like", "gpx")
• SpatiaLite データベース — QGIS v1.1 以降サポートされています. PostGIS データベースと同じよう
に, QgsDataSourceURI を使ってデータソース識別子を作成できます
uri = QgsDataSourceURI()
uri.setDatabase(’/home/martin/test-2.3.sqlite’)
schema = ’’
table = ’Towns’
geom_column = ’Geometry’
uri.setDataSource(schema, table, geom_colum)
display_name = ’Towns’
vlayer = QgsVectorLayer(uri.uri(), display_name, ’spatialite’)
• MySQL OGR 経由でアクセスする WKB-を使ったジオメトリ — データソースはテーブルに対する接
続文字列
uri = "MySQL:dbname,host=localhost,port=3306,user=root,password=xxx|\
layername=my_table"
vlayer = QgsVectorLayer( uri, "my_table", "ogr" )
• WFS コネクション:. コネクションは URI で定義され、 WFS プロバイダを使います:
uri = "http://localhost:8080/geoserver/wfs?srsname=EPSG:23030&typename=\
union&version=1.0.0&request=GetFeature&service=WFS",
vlayer = QgsVectorLayer("my_wfs_layer", "WFS")
URI は urllib という標準ライブラリを使って作成することもできます。
params = {
’service’: ’WFS’,
’version’: ’1.0.0’,
’request’: ’GetFeature’,
’typename’: ’union’,
’srsname’: "EPSG:23030"
}
uri = ’http://localhost:8080/geoserver/wfs?’ + \
urllib.unquote(urllib.urlencode(params))
And you can also use the
2.2 ラスタレイヤ
ラスタファイルのアクセスには GDAL ライブラリが使われています. このライブラリは幅広い形式をサポー
トしています. なにかのファイルのオープンにトラブルがある場合は GDAL がサポートしている形式をチェッ
クしてください (デフォルトですべての形式がサポートされているわけではありません). ラスタをファイル
からロードする場合ファイル名とベース名を指定して下さい:
6
Chapter 2. レイヤのロード
PyQGIS developer cookbook, リリース 2.2
fileName = "/path/to/raster/file.tif"
fileInfo = QFileInfo(fileName)
baseName = fileInfo.baseName()
rlayer = QgsRasterLayer(fileName, baseName)
if not rlayer.isValid():
print "Layer failed to load!"
ラスタレイヤは WCS サービスから作ることもできます。
layer_name = ’elevation’
uri = QgsDataSourceURI()
uri.setParam (’url’, ’http://localhost:8080/geoserver/wcs’)
uri.setParam ( "identifier", layer_name)
rlayer = QgsRasterLayer(uri, ’my_wcs_layer’, ’wcs’)
それとは別に WMS サーバからラスタをロードできます. 現状では GetCapabilities レスポンスを API から取
得できません—どのレイヤが必要かはあなたが知らなければいけません:
urlWithParams = ’url=http://wms.jpl.nasa.gov/wms.cgi&layers=global_mosaic&\
styles=pseudo&format=image/jpeg&crs=EPSG:4326’
rlayer = QgsRasterLayer(urlWithParams, ’some layer name’, ’wms’)
if not rlayer.isValid():
print "Layer failed to load!"
2.3 マップレイヤレジストリ
もしあなたが開かれているレイヤを描画に利用したい場合はそれらをマップレイヤレジストリに追加する
ことを忘れないで下さい. マップレイヤレジストリはレイヤのオーナーシップを取得して後でアプリケー
ションのいろいろな場所でユニーク ID を使ってアクセスできるようになります. レイヤがマップレイヤレ
ジストリから削除された削除された時にそれも削除されます.
レイヤをレジストリに追加する:
QgsMapLayerRegistry.instance().addMapLayer(layer)
終了時にレイヤは廃棄されます, もしあなたがレイヤを明示的に削除したい場合は利用しましょう:
QgsMapLayerRegistry.instance().removeMapLayer(layer_id)
TODO: マップレイヤレジストリのさらに詳細な情報が必要ですか?
2.3. マップレイヤレジストリ
7
Chapter 3
ラスターレイヤを使う
このセクションではラスタレイヤに対して行える様々な操作について紹介していきます.
3.1 レイヤについて
ラスタレイヤは一つ以上のラスタバンドで構成され, シングルバンドラスタやマルチバンドラスタと呼ばれ
ます. 一つのバンドは値が行列上に並んだものです. 空中写真などの普通のカラー画像は, 赤・青・緑のバ
ンドから構成されるラスタです. シングルバンドは基本的に標高などの連続値や土地利用などの整数値から
なります. ラスタレイヤの中にはパレットデータを伴うものがあり, ラスタレイヤの値がパレットの色を指
定ている場合があります.
>>> rlayer.width(), rlayer.height()
(812, 301)
>>> rlayer.extent()
u’12.095833,48.552777 : 18.863888,51.056944’
>>> rlayer.rasterType()
2 # 0 = GrayOrUndefined (single band), 1 = Palette (single band), 2 = Multiband
>>> rlayer.bandCount()
3
>>> rlayer.metadata()
u’<p class="glossy">Driver:</p>...’
>>> rlayer.hasPyramids()
False
3.2 描画スタイル
ラスタレイヤが読み込まれるときの表示の仕方は, その種類によって異なってきます. 表示方法はラスタレ
イヤプロパティやプログラムなどにより変更が可能です. 描画スタイルには以下のものがあります:
インデックス
1
2
3
4
5
7
8
9
Constant: QgsRasterLater.X
単バンドグレー
シュードカラー
カラーマップ
グレースケールカラーマップ
シュードカラーカラーマップ
マルチバンドグレースケール
マルチバンドシュードカラー
マルチバンドカラー
コメント
シングルバンドをグレーカラーで表示
シングルバンドをグレーカラーで表示
インデックスカラーをカラーマップで表示
インデックスカラーをグレースケール表示
“Palette” layerdrawn using a pseudocolor algorithm
2 バンド以上のレイヤをグレーカラーで表示
2 バンド以上のレイヤをシュードカラーで表示
2 バンド以上のレイヤをカラーマップで表示
現在の表示方法を検索:
9
PyQGIS developer cookbook, リリース 2.2
>>> rlayer.drawingStyle()
9
単バンドラスタレイヤはグレースケール (低い値=黒, 高い値=白) でも, 単バンドの値に色を割り当てたシュー
ドカラーでも表示できます. また, 単バンドラスタはカラーマップでも表示できます. マルチバンドラスタは
基本的に RGB カラーが割り当てて表示されますが, いずれかのバンドをグレースケールやシュードカラー
で表示することもできます.
続いてのセクションではどのようにレイヤの表示方法を探したり変更するのかを説明していきます. 設定変
更後にマップキャンバスの表示も更新をしたい場合は, レイヤの更新 を参考にしてください.
TODO: contrast enhancements, transparency (no data), user defined min/max, band statistics
3.2.1 単バンドラスタ
デフォルトではグレースケールで表示されます. 表示方法をシュードカラーに帰る場合:
>>> rlayer.setDrawingStyle(QgsRasterLayer.SingleBandPseudoColor)
>>> rlayer.setColorShadingAlgorithm(QgsRasterLayer.PseudoColorShader)
The PseudoColorShader is a basic shader that highlighs low values in blue and high values in red. Another,
FreakOutShader uses more fancy colors and according to the documentation, it will frighten your granny and
make your dogs howl.
カラーマップ ではカラーマップにより色をわりあてることができます. 値の補間方法には以下の 3 種類が
あります:
• 線形 (補間): カラーマップで色を指定した値とその間を線形補間により色を割りてます.
• (離散的): カラーマップで指定された値及びそれ以上の値を同じ色に設定します.
• (厳密): 色の補間を行わず, カラーマップで指定された値のみを表示します.
色を緑から黄色の補間で設定する場合 (グリッドの値は 0 から 255):
>>> rlayer.setColorShadingAlgorithm(QgsRasterLayer.ColorRampShader)
>>> lst = [ QgsColorRampShader.ColorRampItem(0, QColor(0,255,0)), \
QgsColorRampShader.ColorRampItem(255, QColor(255,255,0)) ]
>>> fcn = rlayer.rasterShader().rasterShaderFunction()
>>> fcn.setColorRampType(QgsColorRampShader.INTERPOLATED)
>>> fcn.setColorRampItemList(lst)
デフォルトのグレースケールに戻す場合は:
>>> rlayer.setDrawingStyle(QgsRasterLayer.SingleBandGray)
3.2.2 マルチバンドラスタ
QGIS ではデフォルトで最初の 3 バンドを赤・緑・青に割り当てます (これは マルチバンドカラー と呼ば
れる表示方法です. この設定を変更したい場合があるかもしれません. 以下のコードは赤バンド (1) と緑バ
ンド (2) をい入れ替える例です:
>>> rlayer.setGreenBandName(rlayer.bandName(1))
>>> rlayer.setRedBandName(rlayer.bandName(2))
グレースケールやシュードカラーを使って一つのバンドだけを表示することも可能です. 前のセクション
参照:
>>>
>>>
>>>
>>>
10
rlayer.setDrawingStyle(QgsRasterLayer.MultiBandSingleBandPseudoColor)
rlayer.setGrayBandName(rlayer.bandName(1))
rlayer.setColorShadingAlgorithm(QgsRasterLayer.PseudoColorShader)
# now set the shader
Chapter 3. ラスターレイヤを使う
PyQGIS developer cookbook, リリース 2.2
3.3 レイヤの更新
レイヤの表示方法の変更をしてすぐ反映させたい場合は以下の方法を実行してください:
if hasattr(layer, "setCacheImage"): layer.setCacheImage(None)
layer.triggerRepaint()
一つ目の方法は, キャッシュ表示をオンにした際に表示レイヤのキャッシュ画像を削除するやり方です. この
機能は QGIS 1.4 以降で使用可能になりました.
二つ目の方法は更新したいマップキャンバス上のレイヤを指定して除去するやり方です.
With WMS raster layers, these commands do not work. In this case, you have to do it explicitily:
layer.dataProvider().reloadData()
layer.triggerRepaint()
レイヤの表示方法を変えた際 (ラスター及びベクターレイヤの変更方法のセクション参照), レイヤーリスト
(凡例) の表示も更新したい場合は (QGIS のインターフェースである ‘‘iface‘‘) にて以下のようにすることで
可能です:
iface.legendInterface().refreshLayerSymbology(layer)
3.4 値の検索
ラスターレイヤの指定の場所の値を調べる方法:
ident = rlayer.dataProvider().identify(QgsPoint(15.30,40.98), \
QgsRaster.IdentifyFormatValue)
if ident.isValid():
print ident.results()
The results method in this case returs a dictionary, with band indices as keys, and band values as values.
{1: 17, 2: 220}
3.3. レイヤの更新
11
Chapter 4
ベクターレイヤを使う
このセクションではベクタレイヤに対して行える様々な操作について紹介していきます.
4.1 ベクターレイヤの反復処理
Iterating over the features in a vector layer is one of the most common tasks. Below is an example of the simple
basic code to perform this task and showing some information about each feature. the layer variable is assumed
to have a QgsVectorLayer object
iter = layer.getFeatures()
for feature in iter:
# retreive every feature with its geometry and attributes
# fetch geometry
geom = feature.geometry()
print "Feature ID %d: " % feature.id()
# show some information about the feature
if geom.type() == QGis.Point:
x = geom.asPoint()
print "Point: " + str(x)
elif geom.type() == QGis.Line:
x = geom.asPolyline()
print "Line: %d points" % len(x)
elif geom.type() == QGis.Polygon:
x = geom.asPolygon()
numPts = 0
for ring in x:
numPts += len(ring)
print "Polygon: %d rings with %d points" % (len(x), numPts)
else:
print "Unknown"
# fetch attributes
attrs = feature.attributes()
# attrs is a list. It contains all the attribute values of this feature
print attrs
Attributes can be refered by index.
idx = layer.fieldNameIndex(’name’)
print feature.attributes()[idx]
13
PyQGIS developer cookbook, リリース 2.2
4.1.1 選択されたフィーチャへの反復処理
4.1.2 Convenience methods
For the above cases, and in case you need to consider selection in a vector layer in case it exist, you can use the
features() method from the buil-in processing plugin, as follows:
import processing
features = processing.features(layer)
for feature in features:
#Do whatever you need with the feature
このメソッドは、フィーチャの選択がない場合はレイヤー中のすべてのフィーチャを、フィーチャの選択
がある場合は選択されているフィーチャを反復処理します。
地物を選択する必要のみある場合、 ベクタレイヤから :func: selectedFeatures メソッドを使用できます。
selection = layer.selectedFeatures()
print len(selection)
for feature in selection:
#Do whatever you need with the feature
4.1.3 一部のフィーチャへの反復処理
もし所定の範囲内に含まれフィーチャのように、レイヤ中の所定のフィーチャにのみ処理を行いたい場合、
QgsFeatureRequest オブジェクトを getFeatures() に加えます。下記が例になります。
request=QgsFeatureRequest()
request.setFilterRect(areaOfInterest)
for f in layer.getFeatures(request):
...
このリクエストは各フィーチャからどの情報を取得するかを定義するために使用することも出来ます。反
復処理はすべてのフィーチャを返しますが、各フィーチャの特定の情報のみ返します。
request.setSubsetOfFields([0,2])
# Only return selected fields
request.setSubsetOfFields([’name’,’id’],layer.fields()) # More user friendly version
request.setFlags( QgsFeatureRequest.NoGeometry ) # Don’t return geometry objects
4.2 ベクターレイヤの修正
Most vector data providers support editing of layer data. Sometimes they support just a subset of possible editing
actions. Use the capabilities() function to find out what set of functionality is supported:
caps = layer.dataProvider().capabilities()
以下で述べているどのベクターレイヤを編集するメソッドを使った場合も、元となるデータソース (ファイ
ルやデータベースなど) に直接変更が反映されます。もし一時的な変更だけをしたいだけであれば、 編集
バッファでの修正 方法について説明している次のセクションまでスキップしてください。
4.2.1 フィーチャの追加
Create some QgsFeature instances and pass a list of them to provider’s addFeatures() method. It will
return two values: result (true/false) and list of added features (their ID is set by the data store):
if caps & QgsVectorDataProvider.AddFeatures:
feat = QgsFeature()
feat.addAttribute(0,"hello")
14
Chapter 4. ベクターレイヤを使う
PyQGIS developer cookbook, リリース 2.2
feat.setGeometry(QgsGeometry.fromPoint(QgsPoint(123,456)))
(res, outFeats) = layer.dataProvider().addFeatures( [ feat ] )
4.2.2 フィーチャの削除
To delete some features, just provide a list of their feature IDs:
if caps & QgsVectorDataProvider.DeleteFeatures:
res = layer.dataProvider().deleteFeatures([ 5, 10 ])
4.2.3 フィーチャの修正
It is possible to either change feature’s geometry or to change some attributes. The following example first changes
values of attributes with index 0 and 1, then it changes the feature’s geometry:
fid = 100
# ID of the feature we will modify
if caps & QgsVectorDataProvider.ChangeAttributeValues:
attrs = { 0 : "hello", 1 : 123 }
layer.dataProvider().changeAttributeValues({ fid : attrs })
if caps & QgsVectorDataProvider.ChangeGeometries:
geom = QgsGeometry.fromPoint(QgsPoint(111,222))
layer.dataProvider().changeGeometryValues({ fid : geom })
4.2.4 フィールドの追加または削除
To add fields (attributes), you need to specify a list of field defnitions. For deletion of fields just provide a list of
field indexes.
if caps & QgsVectorDataProvider.AddAttributes:
res = layer.dataProvider().addAttributes( [ QgsField("mytext", \
QVariant.String), QgsField("myint", QVariant.Int) ] )
if caps & QgsVectorDataProvider.DeleteAttributes:
res = layer.dataProvider().deleteAttributes( [ 0 ] )
データプロバイダのフィールドを追加または削除した後、レイヤのフィールドは、変更が自動的に反映さ
れていないため、更新する必要があります。
layer.updateFields()
4.3 ベクターレイヤを編集バッファで修正する.
QGIS アプリケーションでベクターを編集するには、個々のレイヤを編集モードにしてから編集を行って
最後に変更をコミット (もしくはロールバック) します。全ての変更はそれらをコミットするまでは書き込
まれません — これらはメモリ上の編集バッファに居続けます。これらの機能はプログラムで扱うことがで
きます — これはデータプロバイダを直接使う方法を補完するベクターレイヤを編集する別の方法です。
ベクターレイヤの編集機能をもった GUI ツールを提供する際にこのオプションを使えば、ユーザにコミッ
ト/ロールバックをするのを決めさせられ、また undo/redo のような使い方をさせることができます。変更
をコミットする時に、編集バッファの全ての変更はデータプロバイダに保存されます。
To find out whether a layer is in editing mode, use isEditing() — the editing functions work only when the
editing mode is turned on. Usage of editing functions:
4.3. ベクターレイヤを編集バッファで修正する.
15
PyQGIS developer cookbook, リリース 2.2
# add two features (QgsFeature instances)
layer.addFeatures([feat1,feat2])
# delete a feature with specified ID
layer.deleteFeature(fid)
# set new geometry (QgsGeometry instance) for a feature
layer.changeGeometry(fid, geometry)
# update an attribute with given field index (int) to given value (QVariant)
layer.changeAttributeValue(fid, fieldIndex, value)
# add new field
layer.addAttribute(QgsField("mytext", QVariant.String))
# remove a field
layer.deleteAttribute(fieldIndex)
In order to make undo/redo work properly, the above mentioned calls have to be wrapped into undo commands.
(If you do not care about undo/redo and want to have the changes stored immediately, then you will have easier
work by editing with data provider.) How to use the undo functionality
layer.beginEditCommand("Feature triangulation")
# ... call layer’s editing methods ...
if problem_occurred:
layer.destroyEditCommand()
return
# ... more editing ...
layer.endEditCommand()
The beginEndCommand() will create an internal “active” command and will record subsequent changes
in vector layer. With the call to endEditCommand() the command is pushed onto the undo stack and
the user will be able to undo/redo it from GUI. In case something went wrong while doing the changes, the
destroyEditCommand() method will remove the command and rollback all changes done while this command was active.
編集モードを始めるには startEditing() メソッドを使い、編集を止めるには commitChanges() か
rollback() を使います — しかしながら通常はこれらのメソッドは使う必要がなく、この機能はユーザ
によって始められるでしょう。
4.4 空間インデックスを使う
Spatial indexes can dramatically improve the performance of your code if you need to do frequent queries to a
vector layer. Imagin, for instance, that you are writing an interpolation algorithm, and that for a given location you
need to know the 10 closest point from a points layer„ in order to use those point for calculating the interpolated
value. Without a spatial index, the only way for QGIS to find those 10 points is to compute the distance from each
and every point to the specified location and then compare those distances. This can be a very time consuming
task, specilly if it needs to be repeated fro several locations. If a spatial index exists for the layer, the operation is
much more effective.
Think of a layer withou a spatial index as a telephone book in which telephone number are not orderer or indexed.
The only way to find the telephone number of a given person is to read from the beginning until you find it.
空間インデックスは、QGIS のベクトルレイヤにはデフォルトでは作成されていません、しかし作成するの
は簡単です。以下が必要な手順です。
1. create spatial index — the following code creates an empty index:
index = QgsSpatialIndex()
16
Chapter 4. ベクターレイヤを使う
PyQGIS developer cookbook, リリース 2.2
2. add features to index — index takes QgsFeature object and adds it to the internal data structure. You can
create the object manually or use one from previous call to provider’s nextFeature()
index.insertFeature(feat)
3. once spatial index is filled with some values, you can do some queries:
# returns array of feature IDs of five nearest features
nearest = index.nearestNeighbor(QgsPoint(25.4, 12.7), 5)
# returns array of IDs of features which intersect the rectangle
intersect = index.intersects(QgsRectangle(22.5, 15.3, 23.1, 17.2))
4.5 ベクターレイヤの作成
QgsVectorFileWriter クラスを使ってベクターレイヤファイルを書き出す事ができます。これは OGR
がサポートするいかなるベクターファイル (shapefiles, GeoJSON, KML そしてその他) をサポートしてい
ます。
ベクターレイヤをエクスポートする方法は二つあります:
• from an instance of QgsVectorLayer:
error = QgsVectorFileWriter.writeAsVectorFormat(layer, "my_shapes.shp", \
"CP1250", None, "ESRI Shapefile")
if error == QgsVectorFileWriter.NoError:
print "success!"
error = QgsVectorFileWriter.writeAsVectorFormat(layer, "my_json.json", \
"utf-8", None, "GeoJSON")
if error == QgsVectorFileWriter.NoError:
print "success again!"
3 番目のパラメータは出力の際の文字エンコーディングを指定します。いくつかのドライバーでは、
正しい動作のために指定が必要なります - shape ファイルはそのうちの一つです — しかしながら、
あなたが様々な国の文字列を扱わない場合、エンコーディングには多くの注意を必要としません。
None としてある 4 番目のパラメータには、出力の空間参照系を指定する事が出来ます — もし有効
な QgsCoordinateReferenceSystem インスタンスを与えられた場合、 レイヤーはその空間参
照系に投影されます。
For valid driver names please consult the supported formats by OGR — you should pass the value in
‘the “Code” column as the driver name. Optionally you can set whether to export only selected features,
pass further driver-specific options for creation or tell the writer not to create attributes — look into the
documentation for full syntax.
• directly from features:
# define fields for feature attributes. A list of QgsField objects is needed
fields = [QgsField("first", QVariant.Int),
QgsField("second", QVariant.String) ]
# create an instance of vector file writer, which will create the vector file.
# Arguments:
# 1. path to new file (will fail if exists already)
# 2. encoding of the attributes
# 3. field map
# 4. geometry type - from WKBTYPE enum
# 5. layer’s spatial reference (instance of
#
QgsCoordinateReferenceSystem) - optional
# 6. driver name for the output file
writer = QgsVectorFileWriter("my_shapes.shp", "CP1250", fields, \
4.5. ベクターレイヤの作成
17
PyQGIS developer cookbook, リリース 2.2
QGis.WKBPoint, None, "ESRI Shapefile")
if writer.hasError() != QgsVectorFileWriter.NoError:
print "Error when creating shapefile: ", writer.hasError()
# add a feature
fet = QgsFeature()
fet.setGeometry(QgsGeometry.fromPoint(QgsPoint(10,10)))
fet.setAttributes([1, "text"])
writer.addFeature(fet)
# delete the writer to flush features to disk (optional)
del writer
4.6 メモリープロバイダー
メモリープロバイダーはプラグインやサードパーティアプリケーション開発者に主に使われるでしょう。こ
れはディスクにデータを保存せず、開発者がテンポラリなレイヤーの高速なバックエンドとして使えるよ
うになります。
プロバイダは文字列と int と double をサポートします。
メモリープロバイダーは空間インデックスもサポートしていて、プロバイダーの createSpatialIndex()
を呼ぶことで有効になります。一度空間インデックスを作成したら小さい領域内でフィーチャの iterate が
高速にできるようになります (これ以降は全てのフィーチャを順にたどる必要がなくなり、指定した短形内
で収まります)。
メモリープロバイダーは QgsVectorLayer のコンストラクタに "memory" をプロバイダーの文字列と
して与えると作成されます。
コンストラクタはレイヤーのジオメトリの種類に指定した URL を与えることができます。この種類
は次のものです: "Point", "LineString", "Polygon", "MultiPoint", "MultiLineString",
"MultiPolygon" .
URI ではメモリープロバイダーの座標参照系、属性フィールド、インデックスを指定することが出来ます。
構文は、
crs=definition 座標参照系を指定し、この定義は QgsCoordinateReferenceSystem.createFromString()
で受け付ける事ができるどんな値でも置くことができます。
index=yes プロバイダーが空間インデックスを使うことを指定します。
field=name:type(length,precision) レイヤーの属性を指定します。属性は名前を持ち、オプションとして種
類 (integer, double, string)、長さと正確性を持ちます。複数のフィールドの定義を置くことになるで
しょう。
The following example of a URI incorporates all these options:
"Point?crs=epsg:4326&field=id:integer&field=name:string(20)&index=yes"
The following example code illustrates creating and populating a memory provider:
# create layer
vl = QgsVectorLayer("Point", "temporary_points", "memory")
pr = vl.dataProvider()
# add fields
pr.addAttributes( [ QgsField("name", QVariant.String),
QgsField("age", QVariant.Int),
QgsField("size", QVariant.Double) ] )
# add a feature
fet = QgsFeature()
18
Chapter 4. ベクターレイヤを使う
PyQGIS developer cookbook, リリース 2.2
fet.setGeometry( QgsGeometry.fromPoint(QgsPoint(10,10)) )
fet.setAttributes(["Johny", 2, 0.3])
pr.addFeatures([fet])
# update layer’s extent when new features have been added
# because change of extent in provider is not propagated to the layer
vl.updateExtents()
Finally, let’s check whether everything went well:
# show some stats
print "fields:", len(pr.fields())
print "features:", pr.featureCount()
e = layer.extent()
print "extent:", e.xMin(),e.yMin(),e.xMax(),e.yMax()
# iterate over features
f = QgsFeature()
features = vl.getFeatures()
for f in features:
print "F:",f.id(), f.attributes(), f.geometry().asPoint()
4.7 ベクタレイヤーの外観 (シンボロジ)
ベクタレイヤーがレンダリングされるとき、データの外観はレイヤーによって関連付けられた レンダラー
と シンボル によって決定されます。シンボルはフィーチャの仮想的な表現を描画するクラスで、レンダ
ラーはシンボルが個々のフィーチャで使われるかを決定します。
指定したレイヤのレンダラーは下記のように得ることが出来ます
renderer = layer.rendererV2()
And with that reference, let us explore it a bit:
print "Type:", rendererV2.type()
次の表は QGIS コアライブラリに存在するいくつかのよく知られたレンダラーです:
タイプ
singleSymbol
categorizedSymbol
graduatedSymbol
クラス
詳細
QgsSingleSymbolRendererV2
全てのフィーチャを同じシンボルでレンダーします
QgsCategorizedSymbolRendererV2
カテゴリごとに違うシンボルを使ってフィーチャをレン
ダーします
QgsGraduatedSymbolRendererV2
それぞれの範囲の値によって違うシンボルを使って
フィーチャをレンダーします
カスタムレンダラーのタイプになることもあるので、上記のタイプになるとは思い込まないでください。
QgsRendererV2Registry シングルトンを検索して現在利用可能なレンダラーを見つけることもでき
ます。
It is possible to obtain a dump of a renderer contents in text form — can be useful for debugging:
print rendererV2.dump()
レンダリングが使っているシンボルは symbol() メソッドで取得することができ、 setSymbol() メソッ
ドで変更することができます (C++開発者へメモ: レンダラーはシンボルのオーナーシップをとります)。
分類するのに使われる属性名を検索したりセットしたりすることができます: classAttribute() メソッ
ドと setClassAttribute() メソッドを使います。
To get a list of categories:
4.7. ベクタレイヤーの外観 (シンボロジ)
19
PyQGIS developer cookbook, リリース 2.2
for cat in rendererV2.categories():
print "%s: %s :: %s" % (cat.value().toString(), cat.label(), str(cat.symbol()))
value() はカテゴリを区別にするのに使う値で、 label() はカテゴリの詳細に使われるテキストで、
symbol() メソッドは割り当てられているシンボルを返します。
レ ン ダ ラ は た い て い オ リ ジ ナ ル の シ ン ボ ル と 識 別 を す る た め に カ ラ ー ラ ン プ を 保 持 し て い ま す:
sourceColorRamp() メソッドと sourceSymbol() メソッドから呼び出せます。
このレンダラは先ほど暑かったカテゴリ分けシンボルのレンダラととても似ていますが、クラスごとの一
つの属性値の代わりに領域の値として動作し、そのため数字の属性のみ使うことができます。
To find out more about ranges used in the renderer:
for ran in rendererV2.ranges():
print "%f - %f: %s %s" % (
ran.lowerValue(),
ran.upperValue(),
ran.label(),
str(ran.symbol())
)
属性名の分類を調べるために classAttribute() をまた使うことができ、 sourceSymbol() メソッ
ドと sourceColorRamp() メソッドも使うことができます。さらに作成された領域の測定する mode()
メソッドもあります: 等間隔や変位値、その他のメソッドと一緒に使います。
If you wish to create your own graduated symbol renderer you can do so as illustrated in the example snippet
below (which creates a simple two class arrangement):
from qgis.core import
(QgsVectorLayer,
QgsMapLayerRegistry,
QgsGraduatedSymbolRendererV2,
QgsSymbolV2,
QgsRendererRangeV2)
myVectorLayer = QgsVectorLayer(myVectorPath, myName, ’ogr’)
myTargetField = ’target_field’
myRangeList = []
myOpacity = 1
# Make our first symbol and range...
myMin = 0.0
myMax = 50.0
myLabel = ’Group 1’
myColour = QtGui.QColor(’#ffee00’)
mySymbol1 = QgsSymbolV2.defaultSymbol(
myVectorLayer.geometryType())
mySymbol1.setColor(myColour)
mySymbol1.setAlpha(myOpacity)
myRange1 = QgsRendererRangeV2(
myMin,
myMax,
mySymbol1,
myLabel)
myRangeList.append(myRange1)
#now make another symbol and range...
myMin = 50.1
myMax = 100
myLabel = ’Group 2’
myColour = QtGui.QColor(’#00eeff’)
mySymbol2 = QgsSymbolV2.defaultSymbol(
myVectorLayer.geometryType())
mySymbol2.setColor(myColour)
mySymbol2.setAlpha(myOpacity)
myRange2 = QgsRendererRangeV2(
20
Chapter 4. ベクターレイヤを使う
PyQGIS developer cookbook, リリース 2.2
myMin,
myMax,
mySymbol2
myLabel)
myRangeList.append(myRange2)
myRenderer = QgsGraduatedSymbolRendererV2(
’’, myRangeList)
myRenderer.setMode(
QgsGraduatedSymbolRendererV2.EqualInterval)
myRenderer.setClassAttribute(myTargetField)
myVectorLayer.setRendererV2(myRenderer)
QgsMapLayerRegistry.instance().addMapLayer(myVectorLayer)
シンボルを表現するには、 QgsSymbolV2 ベースクラス由来の三つの派生クラスを使います:
• QgsMarkerSymbolV2 - for point features
• QgsLineSymbolV2 - for line features
• QgsFillSymbolV2 - for polygon features
全てのシンボルは一つ以上のシンボルレイヤーから構成されます (QgsSymbolLayerV2 の派生クラスで
す)。シンボルレイヤーは実際にレンダリングをして、シンボルクラス自信はシンボルレイヤのコンテナを
提供するだけです。
Having an instance of a symbol (e.g. from a renderer), it is possible to explore it: type() method says whether
it is a marker, line or fill symbol. There is a dump() method which returns a brief description of the symbol. To
get a list of symbol layers:
for i in xrange(symbol.symbolLayerCount()):
lyr = symbol.symbolLayer(i)
print "%d: %s" % (i, lyr.layerType())
シンボルが使っている色を得るには color() メソッドを使い、 setColor() でシンボルの色を変えま
す。マーカーシンボルは他にもシンボルのサイズと回転角をそれぞれ size() メソッドと angle() メソッ
ドで取得することができ、ラインシンボルは width() メソッドでラインの幅を返します。
サイズと幅は標準でミリメートルが使われ、角度は 度 が使われます。
前に述べたようにシンボルレイヤ (QgsSymbolLayerV2 のサブクラスです) はフィーチャの外観を決定し
ます。一般的に使われるいくつかの基本となるシンボルレイヤのクラスがあります。これは新しいシンボ
ルレイヤの種類を実装を可能とし、それによってフィーチャがどのようにレンダーされるかを任意にカス
タマイズできます。 layerType() メソッドはシンボルレイヤクラスの一意に識別します — 基本クラス
は標準で SimpleMarker 、 SimpleLine 、 SimpleFill がシンボルレイヤのタイプとなります。
You can get a complete list of the types of symbol layers you can create for a given symbol layer class like this:
from qgis.core import QgsSymbolLayerV2Registry
myRegistry = QgsSymbolLayerV2Registry.instance()
myMetadata = myRegistry.symbolLayerMetadata("SimpleFill")
for item in myRegistry.symbolLayersForType(QgsSymbolV2.Marker):
print item
Output:
EllipseMarker
FontMarker
SimpleMarker
SvgMarker
VectorField
QgsSymbolLayerV2Registry クラスは利用可能な全てのシンボルレイヤタイプのデータベースを管理
しています。
4.7. ベクタレイヤーの外観 (シンボロジ)
21
PyQGIS developer cookbook, リリース 2.2
シンボルレイヤのデータにアクセスするには、 properties() メソッドを使い、これは表現方法を決定し
ているプロパティの辞書のキー値を返します。それぞれのシンボルレイヤタイプはそれが使っている特定の
プロパティの集合を持っています。さらに、共通して使えるメソッドとして color(), size(), angle(),
width() がそれぞれセッターと対応して存在します。もちろん size と angle はマーカーシンボルレイヤだ
けで利用可能で、 width はラインシンボルレイヤだけで利用可能です。
Imagine you would like to customize the way how the data gets rendered. You can create your own symbol layer
class that will draw the features exactly as you wish. Here is an example of a marker that draws red circles with
specified radius:
class FooSymbolLayer(QgsMarkerSymbolLayerV2):
def __init__(self, radius=4.0):
QgsMarkerSymbolLayerV2.__init__(self)
self.radius = radius
self.color = QColor(255,0,0)
def layerType(self):
return "FooMarker"
def properties(self):
return { "radius" : str(self.radius) }
def startRender(self, context):
pass
def stopRender(self, context):
pass
def renderPoint(self, point, context):
# Rendering depends on whether the symbol is selected (Qgis >= 1.5)
color = context.selectionColor() if context.selected() else self.color
p = context.renderContext().painter()
p.setPen(color)
p.drawEllipse(point, self.radius, self.radius)
def clone(self):
return FooSymbolLayer(self.radius)
layerType() メソッドはシンボルレイヤーの名前を決定し、全てのシンボルレイヤーの中で一意になりま
す。プロパティは属性の持続として使われます。 clone() メソッドは全ての全く同じ属性を含んだシンボル
レイヤーのコピーを返さなくてはなりません。最後にレンダリングのメソッドについて: startRender()
はフィーチャが最初にレンダリングされる前に呼び出され、 stopRender() はレンダリングが終わった
ら呼び出されます。そして renderPoint() メソッドでレンダリングを行います。ポイントの座標は出力
対象の座標に常に変換されます。
ポリラインとポリゴンではレンダリングのメソッドが違うだけです: (ポリラインでは) それぞれのラインの
配列を受け取る renderPolyline() を使います。 renderPolygon() は最初のパラメータを外輪とし
たポイントのリストと、2つ目のパラメータに内輪 (もしくは None) のリストを受け取ります。
Usually it is convenient to add a GUI for setting attributes of the symbol layer type to allow users to customize the
appearance: in case of our example above we can let user set circle radius. The following code implements such
widget:
class FooSymbolLayerWidget(QgsSymbolLayerV2Widget):
def __init__(self, parent=None):
QgsSymbolLayerV2Widget.__init__(self, parent)
self.layer = None
# setup a simple UI
self.label = QLabel("Radius:")
self.spinRadius = QDoubleSpinBox()
22
Chapter 4. ベクターレイヤを使う
PyQGIS developer cookbook, リリース 2.2
self.hbox = QHBoxLayout()
self.hbox.addWidget(self.label)
self.hbox.addWidget(self.spinRadius)
self.setLayout(self.hbox)
self.connect( self.spinRadius, SIGNAL("valueChanged(double)"), \
self.radiusChanged)
def setSymbolLayer(self, layer):
if layer.layerType() != "FooMarker":
return
self.layer = layer
self.spinRadius.setValue(layer.radius)
def symbolLayer(self):
return self.layer
def radiusChanged(self, value):
self.layer.radius = value
self.emit(SIGNAL("changed()"))
この widget はシンボルプロパティのダイアログに組み込むことができます。シンボルプロパティのダイ
アログでシンボルレイヤータイプを選択したときにこれはシンボルレイヤーのインスタンスとシンボル
レイヤー widget のインスタンスを作成します。そして widget をシンボルレイヤーを割り当てるために
setSymbolLayer() メソッドを呼び出します。このメソッドで widget がシンボルレイヤーの属性を反映
するよう UI を更新します。 symbolLayer() 関数はシンボルが使ってるプロパティダイアログがシンボ
ルレイヤーを再度探すのに使われます。
いかなる属性の変更時でも、プロパティダイアログにシンボルプレビューを更新させるために widget は
changed() シグナルを発生します。
私達は最後につなげるところだけまだ扱っていません: QGIS にこれらの新しいクラスを知らせる方法です。
これはレジストリにシンボルレイヤーを追加すれば完了です。レジストリに追加しなくてもシンボルレイ
ヤーを使うことはできますが、いくつかの機能が動かないでしょう: 例えばカスタムシンボルレイヤーを
使ってプロジェクトファイルを読み込んだり、GUI でレイヤーの属性を編集できないなど。
We will have to create metadata for the symbol layer:
class FooSymbolLayerMetadata(QgsSymbolLayerV2AbstractMetadata):
def __init__(self):
QgsSymbolLayerV2AbstractMetadata.__init__(self, "FooMarker", QgsSymbolV2.Marker)
def createSymbolLayer(self, props):
radius = float(props[QString("radius")]) if QString("radius") in props else 4.0
return FooSymbolLayer(radius)
def createSymbolLayerWidget(self):
return FooSymbolLayerWidget()
QgsSymbolLayerV2Registry.instance().addSymbolLayerType( FooSymbolLayerMetadata() )
レイヤータイプ (レイヤーが返すのと同じもの) とシンボルタイプ (marker/line/fill) を親クラスのコンスト
ラクタに渡します。 createSymbolLayer() は辞書の引数の props で指定した属性をもつシンボルレイ
ヤーのインスタンスを作成をしてくれます。 (キー値は QString のインスタンスで、決して “str” のオブジェ
クトではないのに気をつけましょう) そして createSymbolLayerWidget() メソッドはこのシンボル
レイヤータイプの設定 widget を返します。
最後にこのシンボルレイヤーをレジストリに追加します — これで完了です。
もしシンボルがフィーチャのレンダリングをどう行うかをカスタマイズしたいのであれば、新しいレンダ
ラーの実装を作ると便利かもしれません。いくつかのユースケースとしてこんなことをしたいのかもしれ
ません: フィールドの組み合わせからシンボルを決定する、現在の縮尺に合わせてシンボルのサイズを変更
するなどなど。
4.7. ベクタレイヤーの外観 (シンボロジ)
23
PyQGIS developer cookbook, リリース 2.2
The following code shows a simple custom renderer that creates two marker symbols and chooses randomly one
of them for every feature:
import random
class RandomRenderer(QgsFeatureRendererV2):
def __init__(self, syms=None):
QgsFeatureRendererV2.__init__(self, "RandomRenderer")
self.syms = syms if syms else [ QgsSymbolV2.defaultSymbol(QGis.Point), \
QgsSymbolV2.defaultSymbol(QGis.Point) ]
def symbolForFeature(self, feature):
return random.choice(self.syms)
def startRender(self, context, vlayer):
for s in self.syms:
s.startRender(context)
def stopRender(self, context):
for s in self.syms:
s.stopRender(context)
def usedAttributes(self):
return []
def clone(self):
return RandomRenderer(self.syms)
親クラスの QgsFeatureRendererV2 のコンストラクタはレンダラの名前 (レンダラの中で一意になる必
要があります) が必要です。 symbolForFeature() メソッドは個々のフィーチャでどのシンボルが使わ
れるかを一つ決定します。 startRender() と stopRender() それぞれシンボルのレンダリングの初期
化/終了を処理します。 usedAttributes() メソッドはレンダラが与えられるのを期待するフィールド
名のリストを返すことができます。最後に clone() 関数はレンダラーのコピーを返すでしょう。
Like with symbol layers, it is possible to attach a GUI for configuration of the renderer. It has to be derived from
QgsRendererV2Widget. The following sample code creates a button that allows user to set symbol of the
first symbol:
class RandomRendererWidget(QgsRendererV2Widget):
def __init__(self, layer, style, renderer):
QgsRendererV2Widget.__init__(self, layer, style)
if renderer is None or renderer.type() != "RandomRenderer":
self.r = RandomRenderer()
else:
self.r = renderer
# setup UI
self.btn1 = QgsColorButtonV2("Color 1")
self.btn1.setColor(self.r.syms[0].color())
self.vbox = QVBoxLayout()
self.vbox.addWidget(self.btn1)
self.setLayout(self.vbox)
self.connect(self.btn1, SIGNAL("clicked()"), self.setColor1)
def setColor1(self):
color = QColorDialog.getColor( self.r.syms[0].color(), self)
if not color.isValid(): return
self.r.syms[0].setColor( color );
self.btn1.setColor(self.r.syms[0].color())
def renderer(self):
return self.r
コンストラクタはアクティブなレイヤー (QgsVectorLayer) とグローバルなスタイル (QgsStyleV2) と
現在のレンダラのインスタンスを受け取ります。もしレンダラが無かったり、レンダラが違う種類のもの
24
Chapter 4. ベクターレイヤを使う
PyQGIS developer cookbook, リリース 2.2
だったら、コンストラクタは新しいレンダラに差し替えるか、そうでなければ現在のレンダラー (必要な種
類を持つでしょう) を使います。widget の中身はレンダラーの現在の状態を表示するよう更新されます。レ
ンダラダイアログが受け入れられたときに、現在のレンダラを取得するために widget の renderer() メ
ソッドが呼び出されます。
The last missing bit is the renderer metadata and registration in registry, otherwise loading of layers with the
renderer will not work and user will not be able to select it from the list of renderers. Let us finish our RandomRenderer example:
class RandomRendererMetadata(QgsRendererV2AbstractMetadata):
def __init__(self):
QgsRendererV2AbstractMetadata.__init__(self, "RandomRenderer", "Random renderer")
def createRenderer(self, element):
return RandomRenderer()
def createRendererWidget(self, layer, style, renderer):
return RandomRendererWidget(layer, style, renderer)
QgsRendererV2Registry.instance().addRenderer(RandomRendererMetadata())
シンボルレイヤーと同様に、abstract metadata のコンストラクタはレンダラの名前を受け取るのを期待して、
この名前はユーザに見え、レンダラのアイコンの追加の名前となります。 createRenderer() メソッド
には QDomElement のインスタンスを渡してレンダラの状態を DOM ツリーから復元するのに使います。
createRendererWidget() メソッドは設定の widget を作成します。これは必ず存在する必要はなく、
もしレンダラが GUI からいじらないのであれば None を返すことができます。
To associate an icon with the renderer you can assign it in QgsRendererV2AbstractMetadata constructor as a third (optional) argument — the base class constructor in the RandomRendererMetadata __init__()
function becomes:
QgsRendererV2AbstractMetadata.__init__(self,
"RandomRenderer",
"Random renderer",
QIcon(QPixmap("RandomRendererIcon.png", "png")) )
アイコンはあとからメタデータクラスの setIcon() を使って関連付けることもできます。アイコンはファ
イルから読み込むこと (上記を参考) も Qt のリソース から読み込むこともできます (PyQt4 はパイソン向け
の .qrc コンパイラを含んでいます)。
re TODO:
• creating/modifying symbols
• working with style (QgsStyleV2)
• working with color ramps (QgsVectorColorRampV2)
• rule-based renderer (see .. _this blogpost: http://snorf.net/blog/2014/03/04/symbology-of-vector-layers-inqgis-python-plugins)
• exploring symbol layer and renderer registries
4.7. ベクタレイヤーの外観 (シンボロジ)
25
Chapter 5
ジオメトリの操作
空間的な特徴を表すポイント、ライン、ポリゴンは一般的にジオメトリと呼ばれています。QGIS では
QgsGeometry クラスで代表されます。すべてのジオメトリタイプは JTS discussion page でよく示されて
います。
時には 1 つのジオメトリは実際に単純な(シングルパート)ジオメトリの集合です。このような幾何学的
形状は、マルチパートジオメトリと呼ばれています。単純にジオメトリのちょうど 1 種類が含まれている
場合は、マルチポイント、マルチラインまたはマルチポリゴンと呼んでいます。例えば、複数の島からな
る国は、マルチポリゴンのように表すことができます。
ジオメトリの座標値はどの座標参照系 (CRS) も利用できます。レイヤーからフィーチャを持ってきたとき
に、ジオメトリの座標値はレイヤーの CRS のものを持つでしょう。
5.1 ジオメトリの構成
ジオメトリの作成にはいくつかのオプションがあります。
• from coordinates:
gPnt = QgsGeometry.fromPoint(QgsPoint(1,1))
gLine = QgsGeometry.fromPolyline( [ QgsPoint(1,1), QgsPoint(2,2) ] )
gPolygon = QgsGeometry.fromPolygon( [ [ QgsPoint(1,1), QgsPoint(2,2), \
QgsPoint(2,1) ] ] )
座標値は QgsPoint クラスを使って与えられます。
ポリライン (ラインストリング) はポイントのリストで表現されます。ポリゴンは線形の輪 (すなわち
閉じたラインストリング) のリストで表現されます。最初の輪は外輪 (境界) で、オプションとして続
く輪がポリゴン内の穴となります。
マルチパートジオメトリはさらに上のレベルです: マルチポイントはポイントのリストで、マルチラ
インストリングはラインストリングのリストで、マルチポリゴンはポリゴンのリストです。
• from well-known text (WKT):
gem = QgsGeometry.fromWkt("POINT (3 4)")
• from well-known binary (WKB):
g = QgsGeometry()
g.setWkbAndOwnership(wkb, len(wkb))
27
PyQGIS developer cookbook, リリース 2.2
5.2 ジオメトリにアクセス
First, you should find out geometry type, wkbType() method is the one to use — it returns a value from
QGis.WkbType enumeration:
>>> gPnt.wkbType() == QGis.WKBPoint
True
>>> gLine.wkbType() == QGis.WKBLineString
True
>>> gPolygon.wkbType() == QGis.WKBPolygon
True
>>> gPolygon.wkbType() == QGis.WKBMultiPolygon
False
他の手段として、 QGis.GeometryType 列挙型から一つの値を返す type() メソッドも使えます。さらに
isMultipart() というジオメトリがマルチパートなのかどうかを調べてくれるヘルパー関数もあります。
To extract information from geometry there are accessor functions for every vector type. How to use accessors:
>>> gPnt.asPoint()
(1,1)
>>> gLine.asPolyline()
[(1,1), (2,2)]
>>> gPolygon.asPolygon()
[[(1,1), (2,2), (2,1), (1,1)]]
注意: このタプル (x, y) は本当のタプルではなく、これらは QgsPoint のオブジェクトで、この値は x()
メソッド及び y() メソッドでアクセスできるようになっています。
マ ル チ パ ー ト ジ オ メ ト リ 同 士 で 似 た よ う な ア ク セ サ 関 数 が あ り ま す:
asMultiPolyline(), asMultiPolygon() です。
asMultiPoint(),
5.3 ジオメトリの述語と操作
QGIS はジオメトリ述部 (contains(), intersects(), ...) や操作設定 (union(), difference(), ...)
のような上級のジオメトリ操作で GEOS ライブラリを使います。また、
(ポリゴンの)面積や(ポリゴンや
線などの)長さのようなジオメトリの幾何学的なプロパティを計算できます。
Here you have a small example that combines iterating over the features in a given layer and perfoming some
geometric computations based on their geometries.
#we assume that ’layer’ is a polygon layer
features = layer.getFeatures()
for f in features:
geom = f.geometry()
print "Area:", geom.area()
print "Perimeter:", geom.length()
QgsGeometry クラスのこれらのメソッドを使って計算するとき、面積と周長は CRS を考慮しません。よ
り強力な面積と距離計算のために、 QgsDistanceArea クラスが使うことができます。投影法が切り替
わったら計算は平面的に行われます。そうでないと楕円体上で計算されます。楕円体がはっきりとセット
されないとき、WGS84 パラメータが計算のために使われます。
d = QgsDistanceArea()
d.setProjectionsEnabled(True)
print "distance in meters: ", d.measureLine(QgsPoint(10,10),QgsPoint(11,11))
あなたは、QGIS に含まれているアルゴリズムの多くの例を見つけて、ベクタデータを分析し、変換するた
めにこれらのメソッドを使用することができます。ここにはそれらのいくつかのコードへのリンクを記載
します。
28
Chapter 5. ジオメトリの操作
PyQGIS developer cookbook, リリース 2.2
• Geometry transformation: Reproject algorithm
• 距離と面積は QgsDistanceArea class: Distance matrix algorithm を使ってます。
• マルチパートをシングルパートにするアルゴリズム
5.3. ジオメトリの述語と操作
29
Chapter 6
投影法サポート
6.1 空間参照系
空間参照系 (CRS) は QgsCoordinateReferenceSystem クラスによってカプセル化されています。こ
のクラスのインスタンスの作成方法はいくつかあります:
• specify CRS by its ID:
# PostGIS SRID 4326 is allocated for WGS84
crs = QgsCoordinateReferenceSystem(4326, \
QgsCoordinateReferenceSystem.PostgisCrsId)
QGIS は参照系ごとに 3 種類の ID を使います。
– PostgisCrsId - IDs used within PostGIS databases.
– InternalCrsId - IDs internally used in QGIS database.
– EpsgCrsId - IDs assigned by the EPSG organization
2 番目のパラメータが指定されなければ、PostGIS SRID がデフォルトで使用されます。
• specify CRS by its well-known text (WKT):
wkt = ’GEOGCS["WGS84", DATUM["WGS84", SPHEROID["WGS84", 6378137.0, \
298.257223563]],\
PRIMEM["Greenwich", 0.0], UNIT["degree",0.017453292519943295],\
AXIS["Longitude",EAST], AXIS["Latitude",NORTH]]’
crs = QgsCoordinateReferenceSystem(wkt)
• create invalid CRS and then use one of the create*() functions to initialize it. In following example we
use Proj4 string to initialize the projection:
crs = QgsCoordinateReferenceSystem()
crs.createFromProj4("+proj=longlat +ellps=WGS84 +datum=WGS84 +no_defs")
CRS の作成 (例:データベース内のルックアップ) が成功したかどうかをチェックするのは賢明です:
isValid() は True を返さなければなりません。
Note that for initialization of spatial reference systems QGIS needs to lookup appropriate values in its internal
database srs.db. Thus in case you create an independent application you need to set paths correctly with
QgsApplication.setPrefixPath() otherwise it will fail to find the database. If you are running the
commands from QGIS python console or developing a plugin you do not care: everything is already set up for
you.
Accessing spatial reference system information:
31
PyQGIS developer cookbook, リリース 2.2
print "QGIS CRS ID:", crs.srsid()
print "PostGIS SRID:", crs.srid()
print "EPSG ID:", crs.epsg()
print "Description:", crs.description()
print "Projection Acronym:", crs.projectionAcronym()
print "Ellipsoid Acronym:", crs.ellipsoidAcronym()
print "Proj4 String:", crs.proj4String()
# check whether it’s geographic or projected coordinate system
print "Is geographic:", crs.geographicFlag()
# check type of map units in this CRS (values defined in QGis::units enum)
print "Map units:", crs.mapUnits()
6.2 投影法
You can do transformation between different spatial reference systems by using QgsCoordinateTransform
class.
The easiest way to use it is to create source and destination CRS and construct
QgsCoordinateTransform instance with them. Then just repeatedly call transform() function
to do the transformation. By default it does forward transformation, but it is capable to do also inverse
transformation:
crsSrc = QgsCoordinateReferenceSystem(4326)
# WGS 84
crsDest = QgsCoordinateReferenceSystem(32633) # WGS 84 / UTM zone 33N
xform = QgsCoordinateTransform(crsSrc, crsDest)
# forward transformation: src -> dest
pt1 = xform.transform(QgsPoint(18,5))
print "Transformed point:", pt1
# inverse transformation: dest -> src
pt2 = xform.transform(pt1, QgsCoordinateTransform.ReverseTransform)
print "Transformed back:", pt2
32
Chapter 6. 投影法サポート
Chapter 7
マップキャンバスの利用
The Map canvas widget is probably the most important widget within QGIS because it shows the map composed
from overlaid map layers and allows interaction with the map and layers. The canvas shows always a part of the
map defined by the current canvas extent. The interaction is done through the use of map tools: there are tools for
panning, zooming, identifying layers, measuring, vector editing and others. Similar to other graphics programs,
there is always one tool active and the user can switch between the available tools.
Map canvas is implemented as QgsMapCanvas class in qgis.gui module. The implementation is based
on the Qt Graphics View framework. This framework generally provides a surface and a view where custom
graphics items are placed and user can interact with them. We will assume that you are familiar enough with Qt
to understand the concepts of the graphics scene, view and items. If not, please make sure to read the overview of
the framework.
Whenever the map has been panned, zoomed in/out (or some other action triggers a refresh), the map is rendered
again within the current extent. The layers are rendered to an image (using QgsMapRenderer class) and that
image is then displayed in the canvas. The graphics item (in terms of the Qt graphics view framework) responsible
for showing the map is QgsMapCanvasMap class. This class also controls refreshing of the rendered map.
Besides this item which acts as a background, there may be more map canvas items. Typical map canvas items
are rubber bands (used for measuring, vector editing etc.) or vertex markers. The canvas items are usually used
to give some visual feedback for map tools, for example, when creating a new polygon, the map tool creates a
rubber band canvas item that shows the current shape of the polygon. All map canvas items are subclasses of
QgsMapCanvasItem which adds some more functionality to the basic QGraphicsItem objects.
要約すると、マップキャンバスアーキテクチャは3つのコンセプトからなります:
• マップキャンバス — 地図の可視化
• マップキャンバスアイテム—マップキャンバスで表示できる追加アイテム
• マップツールズ—マップキャンバスのインタラクション
7.1 マップキャンバスの埋め込み
Map canvas is a widget like any other Qt widget, so using it is as simple as creating and showing it:
canvas = QgsMapCanvas()
canvas.show()
This produces a standalone window with map canvas. It can be also embedded into an existing widget or window. When using .ui files and Qt Designer, place a QWidget on the form and promote it to a new class: set
QgsMapCanvas as class name and set qgis.gui as header file. The pyuic4 utility will take care of it. This
is a very convenient way of embedding the canvas. The other possibility is to manually write the code to construct
map canvas and other widgets (as children of a main window or dialog) and create a layout.
33
PyQGIS developer cookbook, リリース 2.2
By default, map canvas has black background and does not use anti-aliasing. To set white background and enable
anti-aliasing for smooth rendering:
canvas.setCanvasColor(Qt.white)
canvas.enableAntiAliasing(True)
(In case you are wondering, Qt comes from PyQt4.QtCore module and Qt.white is one of the predefined
QColor instances.)
Now it is time to add some map layers. We will first open a layer and add it to the map layer registry. Then we
will set the canvas extent and set the list of layers for canvas:
layer = QgsVectorLayer(path, name, provider)
if not layer.isValid():
raise IOError, "Failed to open the layer"
# add layer to the registry
QgsMapLayerRegistry.instance().addMapLayer(layer)
# set extent to the extent of our layer
canvas.setExtent(layer.extent())
# set the map canvas layer set
canvas.setLayerSet( [ QgsMapCanvasLayer(layer) ] )
After executing these commands, the canvas should show the layer you have loaded.
7.2 マップキャンバスでのマップツールズの利用
The following example constructs a window that contains a map canvas and basic map tools for map panning
and zooming. Actions are created for activation of each tool: panning is done with QgsMapToolPan, zooming
in/out with a pair of QgsMapToolZoom instances. The actions are set as checkable and later assigned to the
tools to allow automatic handling of checked/unchecked state of the actions – when a map tool gets activated, its
action is marked as selected and the action of the previous map tool is deselected. The map tools are activated
using setMapTool() method.
from qgis.gui import *
from PyQt4.QtGui import QAction, QMainWindow
from PyQt4.QtCore import SIGNAL, Qt, QString
class MyWnd(QMainWindow):
def __init__(self, layer):
QMainWindow.__init__(self)
self.canvas = QgsMapCanvas()
self.canvas.setCanvasColor(Qt.white)
self.canvas.setExtent(layer.extent())
self.canvas.setLayerSet( [ QgsMapCanvasLayer(layer) ] )
self.setCentralWidget(self.canvas)
actionZoomIn = QAction(QString("Zoom in"), self)
actionZoomOut = QAction(QString("Zoom out"), self)
actionPan = QAction(QString("Pan"), self)
actionZoomIn.setCheckable(True)
actionZoomOut.setCheckable(True)
actionPan.setCheckable(True)
self.connect(actionZoomIn, SIGNAL("triggered()"), self.zoomIn)
34
Chapter 7. マップキャンバスの利用
PyQGIS developer cookbook, リリース 2.2
self.connect(actionZoomOut, SIGNAL("triggered()"), self.zoomOut)
self.connect(actionPan, SIGNAL("triggered()"), self.pan)
self.toolbar = self.addToolBar("Canvas actions")
self.toolbar.addAction(actionZoomIn)
self.toolbar.addAction(actionZoomOut)
self.toolbar.addAction(actionPan)
# create the map tools
self.toolPan = QgsMapToolPan(self.canvas)
self.toolPan.setAction(actionPan)
self.toolZoomIn = QgsMapToolZoom(self.canvas, False) # false = in
self.toolZoomIn.setAction(actionZoomIn)
self.toolZoomOut = QgsMapToolZoom(self.canvas, True) # true = out
self.toolZoomOut.setAction(actionZoomOut)
self.pan()
def zoomIn(self):
self.canvas.setMapTool(self.toolZoomIn)
def zoomOut(self):
self.canvas.setMapTool(self.toolZoomOut)
def pan(self):
self.canvas.setMapTool(self.toolPan)
You can put the above code to a file, e.g. mywnd.py and try it out in Python console within QGIS. This code will
put the currently selected layer into newly created canvas:
import mywnd
w = mywnd.MyWnd(qgis.utils.iface.activeLayer())
w.show()
Just make sure that the mywnd.py file is located within Python search path (sys.path). If it isn’t, you can
simply add it: sys.path.insert(0, ’/my/path’) — otherwise the import statement will fail, not finding
the module.
7.3 ラバーバンドと頂点マーカー
To show some additional data on top of the map in canvas, use map canvas items. It is possible to create custom canvas item classes (covered below), however there are two useful canvas item classes for convenience:
QgsRubberBand for drawing polylines or polygons, and QgsVertexMarker for drawing points. They both
work with map coordinates, so the shape is moved/scaled automatically when the canvas is being panned or
zoomed.
To show a polyline:
r = QgsRubberBand(canvas, False) # False = not a polygon
points = [ QgsPoint(-1,-1), QgsPoint(0,1), QgsPoint(1,-1) ]
r.setToGeometry(QgsGeometry.fromPolyline(points), None)
To show a polygon:
r = QgsRubberBand(canvas, True) # True = a polygon
points = [ [ QgsPoint(-1,-1), QgsPoint(0,1), QgsPoint(1,-1) ] ]
r.setToGeometry(QgsGeometry.fromPolygon(points), None)
Note that points for polygon is not a plain list: in fact, it is a list of rings containing linear rings of the polygon:
first ring is the outer border, further (optional) rings correspond to holes in the polygon.
Rubber bands allow some customization, namely to change their color and line width:
7.3. ラバーバンドと頂点マーカー
35
PyQGIS developer cookbook, リリース 2.2
r.setColor(QColor(0,0,255))
r.setWidth(3)
The canvas items are bound to the canvas scene. To temporarily hide them (and show again, use the hide() and
show() combo. To completely remove the item, you have to remove it from the scene of the canvas:
canvas.scene().removeItem(r)
(in C++ it’s possible to just delete the item, however in Python del r would just delete the reference and the
object will still exist as it is owned by the canvas)
Rubber band can be also used for drawing points, however QgsVertexMarker class is better suited for this
(QgsRubberBand would only draw a rectangle around the desired point). How to use the vertex marker:
m = QgsVertexMarker(canvas)
m.setCenter(QgsPoint(0,0))
This will draw a red cross on position [0,0]. It is possible to customize the icon type, size, color and pen width:
m.setColor(QColor(0,255,0))
m.setIconSize(5)
m.setIconType(QgsVertexMarker.ICON_BOX) # or ICON_CROSS, ICON_X
m.setPenWidth(3)
For temporary hiding of vertex markers and removing them from canvas, the same applies as for the rubber bands.
7.4 カスタムマップツールズの書き込み
You can write your custom tools, to implement a custom behaviour to actions perfored by users on the canvas.
Map tools should inherit from the QgsMapTool class or any derived class, and selected as active tools in the
canvas using the setMapTool() method as we have already seen.
Here is an example of a map tool that allows to define a rectangular extent by clicking and draggin on the canvas.
When the rectangle is defined, it prints its boundary coordinates in the console. It uses the rubber band elements
described before to show the selected rectangle as it is being defined.
class RectangleMapTool(QgsMapToolEmitPoint):
def __init__(self, canvas):
self.canvas = canvas
QgsMapToolEmitPoint.__init__(self, self.canvas)
self.rubberBand = QgsRubberBand(self.canvas, QGis.Polygon)
self.rubberBand.setColor(Qt.red)
self.rubberBand.setWidth(1)
self.reset()
def reset(self):
self.startPoint = self.endPoint = None
self.isEmittingPoint = False
self.rubberBand.reset(QGis.Polygon)
def canvasPressEvent(self, e):
self.startPoint = self.toMapCoordinates(e.pos())
self.endPoint = self.startPoint
self.isEmittingPoint = True
self.showRect(self.startPoint, self.endPoint)
def canvasReleaseEvent(self, e):
self.isEmittingPoint = False
r = self.rectangle()
if r is not None:
print "Rectangle:", r.xMin(), r.yMin(), r.xMax(), r.yMax()
36
Chapter 7. マップキャンバスの利用
PyQGIS developer cookbook, リリース 2.2
def canvasMoveEvent(self, e):
if not self.isEmittingPoint:
return
self.endPoint = self.toMapCoordinates( e.pos() )
self.showRect(self.startPoint, self.endPoint)
def showRect(self, startPoint, endPoint):
self.rubberBand.reset(QGis.Polygon)
if startPoint.x() == endPoint.x() or startPoint.y() == endPoint.y():
return
point1
point2
point3
point4
=
=
=
=
QgsPoint(startPoint.x(), startPoint.y())
QgsPoint(startPoint.x(), endPoint.y())
QgsPoint(endPoint.x(), endPoint.y())
QgsPoint(endPoint.x(), startPoint.y())
self.rubberBand.addPoint(
self.rubberBand.addPoint(
self.rubberBand.addPoint(
self.rubberBand.addPoint(
self.rubberBand.show()
point1,
point2,
point3,
point4,
False )
False )
False )
True )
# true to update canvas
def rectangle(self):
if self.startPoint is None or self.endPoint is None:
return None
elif self.startPoint.x() == self.endPoint.x() or self.startPoint.y() == \
self.endPoint.y():
return None
return QgsRectangle(self.startPoint, self.endPoint)
def deactivate(self):
QgsMapTool.deactivate(self)
self.emit(SIGNAL("deactivated()"))
7.5 カスタムマップキャンバスアイテムの書き込み
TODO: how to create a map canvas item
7.5. カスタムマップキャンバスアイテムの書き込み
37
Chapter 8
地図のレンダリングと印刷
There are generally two approaches when input data should be rendered as a map: either do it quick way using
QgsMapRenderer or produce more fine-tuned output by composing the map with QgsComposition class
and friends.
8.1 単純なレンダリング
Render some layers using QgsMapRenderer - create destination paint device (QImage, QPainter etc.), set
up layer set, extent, output size and do the rendering:
# create image
img = QImage(QSize(800,600), QImage.Format_ARGB32_Premultiplied)
# set image’s background color
color = QColor(255,255,255)
img.fill(color.rgb())
# create painter
p = QPainter()
p.begin(img)
p.setRenderHint(QPainter.Antialiasing)
render = QgsMapRenderer()
# set layer set
lst = [ layer.getLayerID() ]
render.setLayerSet(lst)
# add ID of every layer
# set extent
rect = QgsRect(render.fullExtent())
rect.scale(1.1)
render.setExtent(rect)
# set output size
render.setOutputSize(img.size(), img.logicalDpiX())
# do the rendering
render.render(p)
p.end()
# save image
img.save("render.png","png")
39
PyQGIS developer cookbook, リリース 2.2
8.2 マップコンポーザを使った出力
Map composer is a very handy tool if you would like to do a more sophisticated output than the simple rendering
shown above. Using the composer it is possible to create complex map layouts consisting of map views, labels,
legend, tables and other elements that are usually present on paper maps. The layouts can be then exported to
PDF, raster images or directly printed on a printer.
The composer consists of a bunch of classes. They all belong to the core library. QGIS application has a convenient
GUI for placement of the elements, though it is not available in the gui library. If you are not familiar with Qt
Graphics View framework, then you are encouraged to check the documentation now, because the composer is
based on it.
The central class of the composer is QgsComposition which is derived from QGraphicsScene. Let us
create one:
mapRenderer = iface.mapCanvas().mapRenderer()
c = QgsComposition(mapRenderer)
c.setPlotStyle(QgsComposition.Print)
Note that the composition takes an instance of QgsMapRenderer. In the code we expect we are running within
QGIS application and thus use the map renderer from map canvas. The composition uses various parameters from
the map renderer, most importantly the default set of map layers and the current extent. When using composer in
a standalone application, you can create your own map renderer instance the same way as shown in the section
above and pass it to the composition.
It is possible to add various elements (map, label, ...) to the composition — these elements have to be descendants
of QgsComposerItem class. Currently supported items are:
• map — this item tells the libraries where to put the map itself. Here we create a map and stretch it over the
whole paper size:
x, y = 0, 0
w, h = c.paperWidth(), c.paperHeight()
composerMap = QgsComposerMap(c, x,y,w,h)
c.addItem(composerMap)
• label — allows displaying labels. It is possible to modify its font, color, alignment and margin:
composerLabel = QgsComposerLabel(c)
composerLabel.setText("Hello world")
composerLabel.adjustSizeToText()
c.addItem(composerLabel)
• 凡例:
:
legend = QgsComposerLegend(c)
legend.model().setLayerSet(mapRenderer.layerSet())
c.addItem(legend)
• スケールバー:
:
item = QgsComposerScaleBar(c)
item.setStyle(’Numeric’) # optionally modify the style
item.setComposerMap(composerMap)
item.applyDefaultSize()
c.addItem(item)
• 矢印
• ピクチャ
• 図形
• テーブル
40
Chapter 8. 地図のレンダリングと印刷
PyQGIS developer cookbook, リリース 2.2
By default the newly created composer items have zero position (top left corner of the page) and zero size. The
position and size are always measured in millimeters:
# set label 1cm from the top and 2cm from the left of the page
composerLabel.setItemPosition(20,10)
# set both label’s position and size (width 10cm, height 3cm)
composerLabel.setItemPosition(20,10, 100, 30)
A frame is drawn around each item by default. How to remove the frame:
composerLabel.setFrame(False)
Besides creating the composer items by hand, QGIS has support for composer templates which are essentially
compositions with all their items saved to a .qpt file (with XML syntax). Unfortunately this functionality is not
yet available in the API.
Once the composition is ready (the composer items have been created and added to the composition), we can
proceed to produce a raster and/or vector output.
The default output settings for composition are page size A4 and resolution 300 DPI. You can change them if
necessary. The paper size is specified in millimeters:
c.setPaperSize(width, height)
c.setPrintResolution(dpi)
8.2.1 ラスタイメージへの出力
The following code fragment shows how to render a composition to a raster image:
dpi = c.printResolution()
dpmm = dpi / 25.4
width = int(dpmm * c.paperWidth())
height = int(dpmm * c.paperHeight())
# create output image and initialize it
image = QImage(QSize(width, height), QImage.Format_ARGB32)
image.setDotsPerMeterX(dpmm * 1000)
image.setDotsPerMeterY(dpmm * 1000)
image.fill(0)
# render the composition
imagePainter = QPainter(image)
sourceArea = QRectF(0, 0, c.paperWidth(), c.paperHeight())
targetArea = QRectF(0, 0, width, height)
c.render(imagePainter, targetArea, sourceArea)
imagePainter.end()
image.save("out.png", "png")
8.2.2 PDF への出力
The following code fragment renders a composition to a PDF file:
printer = QPrinter()
printer.setOutputFormat(QPrinter.PdfFormat)
printer.setOutputFileName("out.pdf")
printer.setPaperSize(QSizeF(c.paperWidth(), c.paperHeight()), QPrinter.Millimeter)
printer.setFullPage(True)
printer.setColorMode(QPrinter.Color)
printer.setResolution(c.printResolution())
pdfPainter = QPainter(printer)
8.2. マップコンポーザを使った出力
41
PyQGIS developer cookbook, リリース 2.2
paperRectMM = printer.pageRect(QPrinter.Millimeter)
paperRectPixel = printer.pageRect(QPrinter.DevicePixel)
c.render(pdfPainter, paperRectPixel, paperRectMM)
pdfPainter.end()
42
Chapter 8. 地図のレンダリングと印刷
Chapter 9
表現、フィルタリング及び値の算出
QGIS は SQL ライクな表現のパースをいくつかサポートしています。SQL の小さなサブセットだけをサ
ポートしています。表現はブーリアン記述 (真偽値を返す) またはファンクション (スカラー値を返す) とし
て評価することができます。
3 つの基本的な種別がサポートされています:
• 数値 — 実数及び 10 進数。例. 123, 3.14
• 文字列 — シングルクオートで囲む必要があります: ’hello world’
• カラム参照 — 評価する際に、参照は項目の実際の値で置き換えられます。名前はエスケープされま
せん。
次の演算子が利用可能です:
• 算術演算子: +, -, *, /, ^
• 丸括弧: 演算を優先します: (1 + 1) * 3
• 単項のプラスとマイナス: -12, +5
• 数学的ファンクション: sqrt, sin, cos, tan, asin, acos, atan
• ジオメトリファンクション: $area, $length
• 変換ファンクション: to int, to real, to string
以下の記述がサポートされています:
• 比較: =, !=, >, >=, <, <=
• パターンマッチング: LIKE (% と _ を使用), ~ (正規表現)
• 論理記述: AND, OR, NOT
• NULL 値チェック: IS NULL, IS NOT NULL
記法例:
• 1 + 2 = 3
• sin(angle) > 0
• ’Hello’ LIKE ’He%’
• (x > 10 AND y > 10) OR z = 0
スカラー表現の例:
• 2 ^ 10
• sqrt(val)
• $length + 1
43
PyQGIS developer cookbook, リリース 2.2
9.1 パース表現
>>> exp = QgsExpression(’1 + 1 = 2’)
>>> exp.hasParserError()
False
>>> exp = QgsExpression(’1 + 1 = ’)
>>> exp.hasParserError()
True
>>> exp.parserErrorString()
PyQt4.QtCore.QString(u’syntax error, unexpected $end’)
9.2 評価表現
9.2.1 基本表現
>>> exp = QgsExpression(’1 + 1 = 2’)
>>> value = exp.evaluate()
>>> value
1
9.2.2 地物に関わる表現
The following example will evaluate the given expression against a feature. “Column” is the name of the field in
the layer.
>>> exp = QgsExpression(’Column = 99’)
>>> value = exp.evaluate(feature, layer.pendingFields())
>>> bool(value)
True
複数の地物をチェックする必要がある場合は、 QgsExpression.prepare() も使うことができます。
QgsExpression.prepare() を使うと、実行の評価速度を向上できます。
>>> exp = QgsExpression(’Column = 99’)
>>> exp.prepare(layer.pendingFields())
>>> value = exp.evaluate(feature)
>>> bool(value)
True
9.2.3 エラー処理
exp = QgsExpression("1 + 1 = 2 ")
if exp.hasParserError():
raise Expection(exp.parserErrorString())
value = exp.evaluate()
if exp.hasEvalError():
raise ValueError(exp.evalErrorString())
print value
9.3 例
次の例はレイヤをフィルタリングして記法にマッチする任意の地物を返却します。
44
Chapter 9. 表現、フィルタリング及び値の算出
PyQGIS developer cookbook, リリース 2.2
def where(layer, exp):
print "Where"
exp = QgsExpression(exp)
if exp.hasParserError():
raise Expection(exp.parserErrorString())
exp.prepare(layer.pendingFields())
for feature in layer.getFeatures():
value = exp.evaluate(feature)
if exp.hasEvalError():
raise ValueError(exp.evalErrorString())
if bool(value):
yield feature
layer = qgis.utils.iface.activeLayer()
for f in where(layer, ’Test > 1.0’):
print f + " Matches expression"
9.3. 例
45
Chapter 10
設定の読み込みと保存
それは、何回もユーザーがプラグインの実行される次回の日時を入力したり、それらを再度選択する必要
がないように、いくつかの変数を保存するためのプラグインのために便利です。
これらの変数は、Qt と QGIS の API を利用して取得し保存することができます。各変数には、ユーザーの好
みの色のために、キー「favourite_color」またはその他の意味のある文字列を使用することができます。—
変数にアクセスするために使用されるキーを選択する必要があります。これは、キーの名前にいくつかの
ストラクチャを与えることをお勧めします。
我々は、異なる種類の設定をすることができます:
• global settings — they are bound to the user at particular machine. QGIS itself stores a lot of global settings,
for example, main window size or default snapping tolerance. This functionality is provided directly by Qt
framework by the means of QSettings class. By default, this class stores settings in system’s “native” way
of storing settings, that is — registry (on Windows), .plist file (on Mac OS X) or .ini file (on Unix). The
QSettings documentation is comprehensive, so we will provide just a simple example:
def store():
s = QSettings()
s.setValue("myplugin/mytext", "hello world")
s.setValue("myplugin/myint", 10)
s.setValue("myplugin/myreal", 3.14)
def read():
s = QSettings()
mytext = s.value("myplugin/mytext", "default text")
myint = s.value("myplugin/myint", 123)
myreal = s.value("myplugin/myreal", 2.71)
The second parameter of the value() method is optional and specifies the default value if there is no previous
value set for the passed setting name.
• project settings — vary between different projects and therefore they are connected with a project file.
Map canvas background color or destination coordinate reference system (CRS) are examples — white
background and WGS84 might be suitable for one project, while yellow background and UTM projection
are better for another one. An example of usage follows:
proj = QgsProject.instance()
# store values
proj.writeEntry("myplugin",
proj.writeEntry("myplugin",
proj.writeEntry("myplugin",
proj.writeEntry("myplugin",
"mytext", "hello world")
"myint", 10)
"mydouble", 0.01)
"mybool", True)
# read values
47
PyQGIS developer cookbook, リリース 2.2
mytext = proj.readEntry("myplugin", "mytext", "default text")[0]
myint = proj.readNumEntry("myplugin", "myint", 123)[0]
ご覧の通り writeEntry() メソッドがすべてのデータ型のために使われますが、いくつかのメソッドが
後ろに設定値を読み込むために存在し、対応するものは各々のデータ型のために選ばなければなりません。
• map layer settings — these settings are related to a particular instance of a map layer with a project. They
are not connected with underlying data source of a layer, so if you create two map layer instances of one
shapefile, they will not share the settings. The settings are stored in project file, so if the user opens the
project again, the layer-related settings will be there again. This functionality has been added in QGIS v1.4.
The API is similar to QSettings — it takes and returns QVariant instances:
# save a value
layer.setCustomProperty("mytext", "hello world")
# read the value again
mytext = layer.customProperty("mytext", "default text")
48
Chapter 10. 設定の読み込みと保存
Chapter 11
ユーザとのコミュニケーション
このセクションではユーザインターフェースにおいて継続性を維持するためにユーザとのコミュニケーショ
ン時に使うべきメソッドとエレメントをいくつか示しています。
11.1 Showing messages. The QgsMessageBar class.
Using mesages boxes can be a bad idea from a user experience point of view. For showing a small info line or a
warning/error messages, the QGIS message bar is usually a better option
Using the reference to the QGIS interface object, you can show a message in the message bar with the following
code.
iface.messageBar().pushMessage("Error", "I’m sorry Dave, I’m afraid I can’t \
do that", level=QgsMessageBar.CRITICAL)
Figure 11.1: QGIS メッセージバー
You can set a duration to show it for a limited time.
iface.messageBar().pushMessage("Error", ""Ooops, the plugin is not working as \
it should", level=QgsMessageBar.CRITICAL, duration=3)
Figure 11.2: ターマー付き QGIS メッセージバー
The examples above show an error bar, but the level parameter can be used to creating warning messages or
info messages, using the QgsMessageBar.WARNING and QgsMessageBar.INFO constants repectively.
ウィジェットは、例えば詳細情報の表示用ボタンのように、メッセージバーに追加することができます
49
PyQGIS developer cookbook, リリース 2.2
Figure 11.3: QGIS Message bar (warning)
Figure 11.4: QGIS メッセージバー (お知らせ)
50
Chapter 11. ユーザとのコミュニケーション
PyQGIS developer cookbook, リリース 2.2
def showError():
pass
widget = iface.messageBar().createMessage("Missing Layers", "Show Me")
button = QPushButton(widget)
button.setText("Show Me")
button.pressed.connect(showError)
widget.layout().addWidget(button)
iface.messageBar().pushWidget(widget, QgsMessageBar.WARNING)
Figure 11.5: ボタン付きの QGIS メッセージバー
You can even use a message bar in your own dialog so you don’t have to show a message box, or if it doesn’t make
sense to show it in the main QGIS window.
class MyDialog(QDialog):
def __init__(self):
QDialog.__init__(self)
self.bar = QgsMessageBar()
self.bar.setSizePolicy( QSizePolicy.Minimum, QSizePolicy.Fixed )
self.setLayout(QGridLayout())
self.layout().setContentsMargins(0,0,0,0)
self.buttonbox = QDialogButtonBox(QDialogButtonBox.Ok)
self.buttonbox.accepted.connect(self.run)
self.layout().addWidget(self.buttonbox , 0,0,2,1)
11.1. Showing messages. The QgsMessageBar class.
51
PyQGIS developer cookbook, リリース 2.2
self.layout().addWidget(self.bar, 0,0,1,1)
def run(self):
self.bar.pushMessage("Hello", "World", level=QgsMessageBar.INFO)
Figure 11.6: カスタムダイアログ内の QGIS メッセージバー
11.2 プロセス表示中
ご覧のとおりウィジェットを受け入れるので、プログレスバーは QGIS メッセージバーに置くこともできま
す。コンソール内で試すことができる例はこちらです。
import time
from PyQt4.QtGui import QProgressBar
from PyQt4.QtCore import *
progressMessageBar = iface.messageBar().createMessage("Doing something boring...")
progress = QProgressBar()
progress.setMaximum(10)
progress.setAlignment(Qt.AlignLeft|Qt.AlignVCenter)
progressMessageBar.layout().addWidget(progress)
iface.messageBar().pushWidget(progressMessageBar, iface.messageBar().INFO)
for i in range(10):
time.sleep(1)
progress.setValue(i + 1)
iface.messageBar().clearWidgets()
Also, you can use the built-in status bar to report progress, as in the next example.
:: count = layers.featureCount() for i, feature in enumerate(features):
#do something time-consuming here ...
percent = i / float(count) *
iface.mainWindow().statusBar().showMessage(“Processed {} %”.format(int(percent)))
100
iface.mainWindow().statusBar().clearMessage()
11.3 ロギング
QGIS ロギングシステムを使うとコードの実行に関して保存したい情報のログを全て採ることができます。
52
Chapter 11. ユーザとのコミュニケーション
PyQGIS developer cookbook, リリース 2.2
QgsMessageLog.logMessage("Your plugin code has been executed correctly", \
QgsMessageLog.INFO)
QgsMessageLog.logMessage("Your plugin code might have some problems", \
QgsMessageLog.WARNING)
QgsMessageLog.logMessage("Your plugin code has crashed!", \
QgsMessageLog.CRITICAL)
11.3. ロギング
53
Chapter 12
Python プラグインの開発
Python プログラミング言語でプラグインを作成することが可能です。C++で書かれた古典的なプラグイン
と比較して、これらは Python 言語の動的な性質により、記述や理解、維持、配布が簡単です。
Python plugins are listed together with C++ plugins in QGIS plugin manager. They’re being searched for in these
paths:
• UNIX/Mac: ~/.qgis/python/plugins および (qgis_prefix)/share/qgis/python/plugins
• Windows: ~/.qgis/python/plugins および (qgis_prefix)/python/plugins
Home directory (denoted by above ~) on Windows is usually something like C:\Documents and
Settings\(user) (on Windows XP or earlier) or C:\Users\(user). Since Quantum GIS is using Python
2.7, subdirectories of these paths have to contain an __init__.py fily to be considered Python packages that can be
imported as plugins.
ステップ:
1. アイデア: 新しい QGIS プラグインでやりたいことのアイデアを持ちます。なぜそれを行うのですか?
どのような問題を解決しますか? その問題のための別のプラグインは既にありますか?
2. Create files: Create the files described next. A starting point (__init.py__). Fill in the プラグインメ
タデータ (metadata.txt) A main python plugin body (mainplugin.py). A form in QT-Designer
(form.ui), with its resources.qrc.
3. コードを書く: mainplugin.py 内にコードを記述する
4. テスト: QGIS を閉じて再度開き、あなたのプラグインをインポートします。すべてが OK かチェック
して下さい。
5. Publish: Publish your plugin in QGIS repository or make your own repository as an “arsenal” of personal
“GIS weapons”
12.1 プラグインを書く
Since the introduction of python plugins in QGIS, a number of plugins have appeared - on Plugin Repositories
wiki page you can find some of them, you can use their source to learn more about programming with PyQGIS or
find out whether you are not duplicating development effort. QGIS team also maintains an 公式の python プラ
グインリポジトリ. Ready to create a plugin but no idea what to do? Python Plugin Ideas wiki page lists wishes
from the community!
12.1.1 プラグインファイル
Here’s the directory structure of our example plugin:
55
PyQGIS developer cookbook, リリース 2.2
PYTHON_PLUGINS_PATH/
MyPlugin/
__init__.py
-->
mainPlugin.py -->
metadata.txt
-->
resources.qrc -->
resources.py
-->
form.ui
-->
form.py
-->
*required*
*required*
*required*
*likely useful*
*compiled version, likely useful*
*likely useful*
*compiled version, likely useful*
ファイルが意味すること:
• __init__.py = The starting point of the plugin. It has to have the classFactory method and may have
any other initialisation code.
• mainPlugin.py = プラグインの主なワーキングコード。このプラグインの動作に関するすべての
情報と主要なコードを含みます。
• resources.qrc = The .xml document created by QT-Designer. Contains relative paths to resources of
the forms.
• resources.py = 上記の.qrc ファイルが Python に変換されたもの。
• form.ui = The GUI created by QT-Designer.
• form.py = 上記の form.ui が Python に変換されたもの。
• metadata.txt = QGIS >= 1.8.0 で必要です。全般情報やバージョン、名前、そしてプラグインの
ウェブサイトやインフラストラクチャによって使用されるいくつかのメタデータが含まれます。QGIS
2.0 以降では __init__.py からのメタデータは受け付けられず、 metadata.txt が必要です。
ここ では典型的な QGIS の Python プラグインの基本的なファイル (スケルトン) をオンラインで自動的に
作成することができます。
また、 Plugin Builder と呼ばれる QGIS プラグインがあります。QGIS からプラグインテンプレートを作成
しますがインターネット接続を必要としません。2.0 に互換性のあるソースを生成しますので推奨される選
択肢です。
警告: If you plan to upload the plugin to the 公式の python プラグインリポジトリ you must check that your
plugin follows some additional rules, required for plugin 検証
12.2 プラグインの内容
上述のファイル構造の中のそれぞれのファイルに何を追加するべきかについての情報および例を示します。
12.2.1 プラグインメタデータ
まず、プラグインマネージャーは名前や説明などプラグインに関する基本的な情報を取得する必要があり
ます。 metadata.txt ファイルはこの情報を記載するのに適切な場所です。
重要: 全てのメタデータは UTF-8 のエンコーディングでなければいけません。
56
Chapter 12. Python プラグインの開発
PyQGIS developer cookbook, リリース 2.2
メタデータ名
name
qgisMinimumVersion
qgisMaximumVersion
description
about
version
author
email
changelog
experimental
deprecated
必
注意
須
True プラグインの名前を含んでいる短い文字列
True QGIS の最小バージョンのドット付き表記
False QGIS の最大バージョンのドット付き表記
True
False
True
True
True
False
False
False
tags
homepage
repository
tracker
icon
False
False
False
False
False
category
False
プラグインを説明する短いテキスト。HTML は使用できません。
プラグインを詳細に説明するより長いテキスト。HTML は使用できません。
バージョンのドット付き表記の短い文字列
作者名
作者の電子メールアドレス。Web サイトには 表示されません
文字列。複数行でもよいですが HTML は使用できません。
ブール型のフラグ。 True または False
ブール型のフラグ。 True または False. アップロードされたバージョンだけでは
なくプラグイン全体に適用されます。
comma separated list, spaces are allowe inside individual tags
プラグインのホームページを指す有効な URL
ソースコードリポジトリの有効な URL
チケットとバグ報告のための有効な URL
ファイル名または相対パス (プラグインの圧縮されたパッケージのベースフォル
ダに対する)
Raster, Vector, Database, Web のいずれか
By default, plugins are placed in the Plugins menu (we will see in the next section how to add a menu entry for
your plugin) but they can also be placed the into Raster, Vector, Database and Web menus.
A corresponding “category” metadata entry exists to specify that, so the plugin can be classified accordingly. This
metadata entry is used as tip for users and tells them where (in which menu) the plugin can be found. Allowed
values for “category” are: Vector, Raster, Database or Web. For example, if your plugin will be available from
Raster menu, add this to metadata.txt:
category=Raster
ノート: qgisMaximumVersion が空の場合、 公式の python プラグインリポジトリ にアップロードされた時
にメジャーバージョン + .99 に自動的に設定されます。
An example for this metadata.txt:
; the next section is mandatory
[general]
name=HelloWorld
[email protected]
author=Just Me
qgisMinimumVersion=2.0
description=This is an example plugin for greeting the world.
Multiline is allowed:
lines starting with spaces belong to the same
field, in this case to the "description" field.
HTML formatting is not allowed.
about=This paragraph can contain a detailed description
of the plugin. Multiline is allowed, HTML is not.
version=version 1.2
; end of mandatory metadata
; start of optional metadata
category=Raster
changelog=The changelog lists the plugin versions
and their changes as in the example below:
1.0 - First stable release
12.2. プラグインの内容
57
PyQGIS developer cookbook, リリース 2.2
0.9 - All features implemented
0.8 - First testing release
; Tags are in comma separated value format, spaces are allowed within the
; tag name.
; Tags should be in english language. Please also check for existing tags and
; synoninms before creating a new one.
tags=wkt,raster,hello world
; these metadata can be empty, they will eventually become mandatory.
homepage=http://www.itopen.it
tracker=http://bugs.itopen.it
repository=http://www.itopen.it/repo
icon=icon.png
; experimental flag (applies to the single version)
experimental=True
; deprecated flag (applies to the whole plugin and not only to the uploaded version)
deprecated=False
; if empty, it will be automatically set to major version + .99
qgisMaximumVersion=2.0
12.2.2 __init__.py
This file is required by Python’s import system. Also, Quantum GIS requires that this file contains a
classFactory() function, which is called when the plugin gets loaded to QGIS. It receives reference to
instance of QgisInterface and must return instance of your plugin’s class from the mainplugin.py - in our
case it’s called TestPlugin (see below). This is how __init__.py should look like:
def classFactory(iface):
from mainPlugin import TestPlugin
return TestPlugin(iface)
## any other initialisation needed
12.2.3 mainPlugin.py
This is where the magic happens and this is how magic looks like: (e.g. mainPlugin.py):
from PyQt4.QtCore import *
from PyQt4.QtGui import *
from qgis.core import *
# initialize Qt resources from file resouces.py
import resources
class TestPlugin:
def __init__(self, iface):
# save reference to the QGIS interface
self.iface = iface
def initGui(self):
# create action that will start plugin configuration
self.action = QAction(QIcon(":/plugins/testplug/icon.png"), "Test plugin", \
self.iface.mainWindow())
self.action.setObjectName("testAction")
self.action.setWhatsThis("Configuration for test plugin")
58
Chapter 12. Python プラグインの開発
PyQGIS developer cookbook, リリース 2.2
self.action.setStatusTip("This is status tip")
QObject.connect(self.action, SIGNAL("triggered()"), self.run)
# add toolbar button and menu item
self.iface.addToolBarIcon(self.action)
self.iface.addPluginToMenu("&Test plugins", self.action)
# connect to signal renderComplete which is emitted when canvas
# rendering is done
QObject.connect(self.iface.mapCanvas(), SIGNAL("renderComplete(QPainter *)"), \
self.renderTest)
def unload(self):
# remove the plugin menu item and icon
self.iface.removePluginMenu("&Test plugins",self.action)
self.iface.removeToolBarIcon(self.action)
# disconnect form signal of the canvas
QObject.disconnect(self.iface.mapCanvas(), SIGNAL("renderComplete(QPainter *)"), \
self.renderTest)
def run(self):
# create and show a configuration dialog or something similar
print "TestPlugin: run called!"
def renderTest(self, painter):
# use painter for drawing to map canvas
print "TestPlugin: renderTest called!"
The only plugin functions that must exist in the main plugin source file (e.g. mainPlugin.py) are:: - __init__ –>
which gives access to Quantum GIS’ interface - initGui() –> called when the plugin is loaded - unload()
–> called when the plugin is unloaded
You can see that in the above example, the ‘‘:func:‘addPluginToMenu‘<http://qgis.org/api/classQgisInterface.html#ad1af604ed
is used. This will add the corresponding menu action to the Plugins menu. Alternative methods exist to add the
action to a different menu. Here is a list of those methods:
• addPluginToRasterMenu()
• addPluginToVectorMenu()
• addPluginToDatabaseMenu()
• addPluginToWebMenu()
それらはすべて addPluginToMenu() メソッドと同じ構文です。
プラグインエントリの編成の一貫性を保つために、これらの定義済みのメソッドのいずれかでプラグインメ
ニューを追加することが推奨されます。ただし、次の例に示すようにメニューバーに直接カスタムメニュー
グループを追加することができます:
def initGui(self):
self.menu = QMenu(self.iface.mainWindow())
self.menu.setObjectName("testMenu")
self.menu.setTitle("MyMenu")
self.action = QAction(QIcon(":/plugins/testplug/icon.png"), "Test plugin", \
self.iface.mainWindow())
self.action.setObjectName("testAction")
self.action.setWhatsThis("Configuration for test plugin")
self.action.setStatusTip("This is status tip")
QObject.connect(self.action, SIGNAL("triggered()"), self.run)
self.menu.addAction(self.action)
menuBar = self.iface.mainWindow().menuBar()
12.2. プラグインの内容
59
PyQGIS developer cookbook, リリース 2.2
menuBar.insertMenu(self.iface.firstRightStandardMenu().menuAction(), self.menu)
def unload(self):
self.menu.deleteLater()
カスタマイズを可能にするために QAction と QMenu の objectName をプラグイン固有の名前に設定するこ
とを忘れないで下さい。
12.2.4 リソースファイル
You can see that in initGui() we’ve used an icon from the resource file (called resources.qrc in our
case):
<RCC>
<qresource prefix="/plugins/testplug" >
<file>icon.png</file>
</qresource>
</RCC>
It is good to use a prefix that will not collide with other plugins or any parts of QGIS, otherwise you might get
resources you did not want. Now you just need to generate a Python file that will contain the resources. It’s done
with pyrcc4 command:
pyrcc4 -o resources.py resources.qrc
And that’s all... nothing complicated :) If you’ve done everything correctly you should be able to find and load
your plugin in the plugin manager and see a message in console when toolbar icon or appropriate menu item is
selected.
本物のプラグインに取り組んでいる時は別の (作業) ディレクトリでプラグインを書いて、UI とリソース
ファイルを生成してプラグインを QGIS にインストールする makefile を作成するのが賢明です。
12.3 ドキュメント
プラグインのドキュメントは HTML ヘルプファイルとして記述できます。 qgis.utils モジュールは他の
QGIS のヘルプと同じ方法でヘルプファイルブラウザを開く showPluginHelp() 関数を提供しています。
showPluginHelp() 関数は呼び出し元のモジュールと同じディレクトリでヘルプファイルを探します。
index-ll_cc.html, index-ll.html, index-en.html, index-en_us.html, index.html の順
に探し、はじめに見つけたものを表示します。ここで ll_cc は QGIS のロケールです。ドキュメントの複
数の翻訳をプラグインに含めることができます。
showPluginHelp() 関数は引数をとることができます。packageName 引数はヘルプが表示されるプラグ
インを識別します。filename 引数は検索しているファイル名の”index” を置き換えます。そして section 引数
はブラウザが表示位置を合わせるドキュメント内の HTML アンカータグの名前です。
60
Chapter 12. Python プラグインの開発
Chapter 13
書き込みの IDE 設定とデバッグプラグイン
Although each programmer has his prefered IDE/Text editor, here are some recommendations for setting up popular IDE’s for writing and debugging QGIS Python plugins.
13.1 Windows 上で IDE を設定するメモ
On Linux there is no additional configuration needed to develop plug-ins. But on Windows you need to make sure
you that you have the same environment settings and use the same libraries and interpreter as QGIS. The fastest
way to do this, is to modify the startup batch file of QGIS.
If you used the OSGeo4W Installer, you can find this under the bin folder of your OSGoeW install. Look for
something like C:\OSGeo4W\bin\qgis-unstable.bat.
For using Pyscripter IDE, here’s what ou have to do:
• Make a copy of qgis-unstable.bat and rename it pyscripter.bat.
• Open it in an editor. And remove the last line, the one that starts qgis.
• Add a line that points to the your pyscripter executable and add the commandline argument that sets the
version of python to be used (2.7 in the case of QGIs 2.0)
• Also add the argument that points to the folder where pyscripter can find the python dll used by qgis, you
can find this under the bin folder of your OSGeoW install:
@echo off
SET OSGEO4W_ROOT=C:\OSGeo4W
call "%OSGEO4W_ROOT%"\bin\o4w_env.bat
call "%OSGEO4W_ROOT%"\bin\gdal16.bat
@echo off
path %PATH%;%GISBASE%\bin
Start C:\pyscripter\pyscripter.exe --python25 --pythondllpath=C:\OSGeo4W\bin
Now when you double click this batch file it will start pyscripter, with the correct path.
More popular that Pyscripter, Eclipse is a common choice among developers. In the following sections, we will be
explaining how to configure it for depelopping and testing plugins. To prepare your environment for using Eclipse
in windows, you should also create a batch file and use it to start Eclipse.
バッチファイルを作成するには、これらのステップに従います。
• Locate the folder where qgis_core.dll resides in. Normally this is C:\OSGeo4W\apps\qgis\bin
, but if you compiled your own qgis application this is in your build folder in
output/bin/RelWithDebInfo
• Locate your eclipse.exe executable.
• Create the following script and use this to start eclipse when developping QGIS plugins.
61
PyQGIS developer cookbook, リリース 2.2
call "C:\OSGeo4W\bin\o4w_env.bat"
set PATH=%PATH%;C:\path\to\your\qgis_core.dll\parent\folder
C:\path\to\your\eclipse.exe
13.2 Eclipse と PyDev を利用したデバッグ
13.2.1 インストール
Eclipse を使用するため、あなたが以下をインストールしたことを確認してください
• Eclipse
• Aptana Eclipse プラグインまたは PyDev
• QGIS 2.0
13.2.2 QGIS の準備
There is some preparation to be done on QGIS itself. Two plugins are of interest: Remote Debug and Plugin
reloader.
• Go to Plugins/Fetch python plugins
• Search for Remote Debug ( at the moment it’s still experimental, so enable experimental plugins under the
Options tab in case it does not show up ). Install it.
• Search for Plugin reloader and install it as well. This will let you reload a plugin instead of having to close
and restart QGIS to have the plugin reloaded.
13.2.3 Eclipse のセットアップ
In Eclipse, create a new project. You can select General Project and link your real sources later on, so it does not
really mather where you place this project.
Now right click your new project and choose New => Folder.
Click Advanced and choose Link to alternate location (Linked Folder). In case you already have sources you want
to debug, choose these, in case you don’t, create a folder as it was already explained
Now in the view Project Explorer, your source tree pops up and you can start working with the code. You already
have syntax highlighting and all the other powerful IDE tools available.
13.2.4 デバッガの設定
To get the debugger working, switch to the Debug perspective in eclipse (Window=>Open Perspective=>Other=>Debug).
Now start the PyDev debug server by choosing PyDev=>Start Debug Server.
Eclipse is now waiting for a connection from QGIS to its debug server and when QGIS connects to the debug
server it will allow it to control the python scripts. That’s exactly what we installed the Remote Debug plugin for.
So start QGIS in case you did not already and click the bug symbol .
Now you can set a breakpoint and as soon as the code hits it, execution will stop and you can inspect the current
state of your plugin. (The breakpoint is the green dot in the image below, set one by double clicking in the white
space left to the line you want the breakpoint to be set)
A very interesting thing you can make use of now is the debug console. Make sure that the execution is currently
stopped at a break point, before you proceed.
62
Chapter 13. 書き込みの IDE 設定とデバッグプラグイン
PyQGIS developer cookbook, リリース 2.2
Figure 13.1: Eclipse プロジェクト
13.2. Eclipse と PyDev を利用したデバッグ
63
PyQGIS developer cookbook, リリース 2.2
Figure 13.2: ブレークポイント
Open the Console view (Window => Show view). It will show the Debug Server console which is not very
interesting. But there is a button Open Console which lets you change to a more interesting PyDev Debug Console.
Click the arrow next to the Open Console button and choose PyDev Console. A window opens up to ask you
which console you want to start. Choose PyDev Debug Console. In case its greyed out and tells you to Start the
debugger and select the valid frame, make sure that you’ve got the remote debugger attached and are currently on
a breakpoint.
Figure 13.3: PyDev デバッグコンソール
You have now an interactive console which let’s you test any commands from within the current context. You can
manipulate variables or make API calls or whatever you like.
A little bit annoying is, that everytime you enter a command, the console switches back to the Debug Server. To
stop this behavior, you can click the Pin Console button when on the Debug Server page and it should remember
this decision at least for the current debug session.
13.2.5 Making eclipse understand the API
A very handy feature is to have Eclipse actually know about the QGIS API. This enables it to check your code for
typos. But not only this, it also enables Eclipse to help you with autocompletion from the imports to API calls.
To do this, Eclipse parses the QGIS library files and gets all the information out there. The only thing you have to
do is to tell Eclipse where to find the libraries.
Click Window=>Preferences=>PyDev=>Interpreter - Python.
You will see your configured python interpreter in the upper part of the window (at the moment python2.7 for
QGIS) and some tabs in the lower part. The interesting tabs for us are Libraries and Forced Builtins.
First open the Libraries tab. Add a New Folder and choose the python folder of your QGIS installation. If
you do not know where this folder is (it’s not the plugins folder) open QGIS, start a python console and simply enter qgis and press enter. It will show you which qgis module it uses and its path. Strip the trailing
/qgis/__init__.pyc from this path and you’ve got the path you are looking for.
You should also add your plugins folder here (on linux its ~/.qgis/python/plugins ).
64
Chapter 13. 書き込みの IDE 設定とデバッグプラグイン
PyQGIS developer cookbook, リリース 2.2
Figure 13.4: PyDev デバッグコンソール
13.2. Eclipse と PyDev を利用したデバッグ
65
PyQGIS developer cookbook, リリース 2.2
Next jump to the Forced Builtins tab, click on New... and enter qgis. This will make eclipse parse the QGIS API.
You probably also want eclipse to know about the PyQt4 API. Therefore also add PyQt4 as forced builtin. That
should probably already be present in your libraries tab
Click OK and you’re done.
Note: everytime the QGIS API changes (e.g. if you’re compiling QGIS master and the sip file changed), you
should go back to this page and simply click Apply. This will let Eclipse parse all the libraries again.
For another possible setting of Eclipse to work with QGIS Python plugins, check this link
13.3 Debugging using PDB
If you do not use an IDE such as Eclipse, you can debug using PDB, following this steps.
First add this code in the spot where you would like to debug:
# Use pdb for debugging
import pdb
# These lines allow you to set a breakpoint in the app
pyqtRemoveInputHook()
pdb.set_trace()
それから、コマンドラインから QGIS を実行します。
On Linux do:
$ ./Qgis
On Mac OS X do:
$ /Applications/Qgis.app/Contents/MacOS/Qgis
And when the application hits your breakpoint you can type in the console!
66
Chapter 13. 書き込みの IDE 設定とデバッグプラグイン
Chapter 14
プラグインレイヤの利用
マップレイヤをレンダーするためにプラグインを使うなら、QgsPluginLayer に基づいたレイヤタイプを記
述することが、最良な実装方法かもしれません。
TODO: QgsPluginLayer のよい利用ケースにおいて正しさと精巧さをチェックしましょう。
14.1 QgsPluginLayer のサブクラス化
以下は最小限の QgsPluginLayer 実装の例です。これは Watermark example plugin の抜粋です:
class WatermarkPluginLayer(QgsPluginLayer):
LAYER_TYPE="watermark"
def __init__(self):
QgsPluginLayer.__init__(self, WatermarkPluginLayer.LAYER_TYPE, \
"Watermark plugin layer")
self.setValid(True)
def draw(self, rendererContext):
image = QImage("myimage.png")
painter = rendererContext.painter()
painter.save()
painter.drawImage(10, 10, image)
painter.restore()
return True
Methods for reading and writing specific information to the project file can also be added:
def readXml(self, node):
def writeXml(self, node, doc):
When loading a project containing such a layer, a factory class is needed:
class WatermarkPluginLayerType(QgsPluginLayerType):
def __init__(self):
QgsPluginLayerType.__init__(self, WatermarkPluginLayer.LAYER_TYPE)
def createLayer(self):
return WatermarkPluginLayer()
You can also add code for displaying custom information in the layer properties:
67
PyQGIS developer cookbook, リリース 2.2
def showLayerProperties(self, layer):
68
Chapter 14. プラグインレイヤの利用
Chapter 15
QGIS の旧バージョンとの互換性
15.1 プラグインメニュー
If you place your plugin menu entries into one of the new menus (Raster, Vector, Database or Web), you should
modify the code of the initGui() and unload() functions. Since these new menus are available only in
QGIS 2.0, the first step is to check that the running QGIS version has all necessary functions. If the new menus
are available, we will place our plugin under this menu, otherwise we will use the old Plugins menu. Here is an
example for Raster menu:
def initGui(self):
# create action that will start plugin configuration
self.action = QAction(QIcon(":/plugins/testplug/icon.png"), "Test plugin", \
self.iface.mainWindow())
self.action.setWhatsThis("Configuration for test plugin")
self.action.setStatusTip("This is status tip")
QObject.connect(self.action, SIGNAL("triggered()"), self.run)
# check if Raster menu available
if hasattr(self.iface, "addPluginToRasterMenu"):
# Raster menu and toolbar available
self.iface.addRasterToolBarIcon(self.action)
self.iface.addPluginToRasterMenu("&Test plugins", self.action)
else:
# there is no Raster menu, place plugin under Plugins menu as usual
self.iface.addToolBarIcon(self.action)
self.iface.addPluginToMenu("&Test plugins", self.action)
# connect to signal renderComplete which is emitted when canvas rendering is done
QObject.connect(self.iface.mapCanvas(), SIGNAL("renderComplete(QPainter *)"), \
self.renderTest)
def unload(self):
# check if Raster menu available and remove our buttons from appropriate
# menu and toolbar
if hasattr(self.iface, "addPluginToRasterMenu"):
self.iface.removePluginRasterMenu("&Test plugins",self.action)
self.iface.removeRasterToolBarIcon(self.action)
else:
self.iface.removePluginMenu("&Test plugins",self.action)
self.iface.removeToolBarIcon(self.action)
# disconnect from signal of the canvas
QObject.disconnect(self.iface.mapCanvas(), SIGNAL("renderComplete(QPainter *)"), \
self.renderTest)
69
Chapter 16
あなたのプラグインのリリース
Once your plugin is ready and you think the plugin could be helpful for some people, do not hesitate to upload it to
公式の python プラグインリポジトリ. On that page you can find also packaging guidelines about how to prepare
the plugin to work well with the plugin installer. Or in case you would like to set up your own plugin repository,
create a simple XML file that will list the plugins and their metadata, for examples see other plugin repositories.
16.1 公式の python プラグインリポジトリ
*公式の*python プラグインリポジトリは http://plugins.qgis.org/ で見つけることができます。
公式のリポジトリを使用するため、あなたは OSGEO web portal から OSGEO ID を入手しないといけま
せん。
あなたがプラグインをアップロードしたら、それはスタッフによって承認され、あなたに通知されます。
16.1.1 許可
これらのルールは、公式のプラグインリポジトリに実装されています:
• すべての登録ユーザは、新しいプラグインを追加することができます
• *スタッフ*は全てのプラグインバージョンの承認と非承認を行うことができます。
• users which have the special permission plugins.can_approve get the versions they upload automatically approved
• users which have the special permission plugins.can_approve can approve versions uploaded by others
as long as they are in the list of the plugin owners
• 特定のプラグインは *staff*ユーザまたはプラグイン *owners*によって削除または編集できます。
• ユーザが ‘plugins.can_approve‘なしで新しいバージョンをアップロードした場合、プラグインの
バージョンは自動的に非承認になります。
16.1.2 運用の信託
Staff members can grant trust to selected plugin creators setting plugins.can_approve permission through the
front-end application.
The plugin details view offers direct links to grant trust to the plugin creator or the plugin owners.
71
PyQGIS developer cookbook, リリース 2.2
16.1.3 検証
Plugin’s metadata are automatically imported and validated from the compressed package when the plugin is
uploaded.
Here are some validation rules that you should aware of when you want to upload a plugin on the official repository:
1. the name of the main folder containing your plugin must contain only contains ASCII characters (A-Z and
a-z), digits and the characters underscore (_) and minus (-), also it cannot start with a digit
2. metadata.txt が要求されます。
3. all required metadata listed in metadata table must be present
4. the version metadata field must be unique
16.1.4 プラグイン構造
Following the validation rules the compressed (.zip) package of your plugin must have a specific structure to validate as a functional plugin. As the plugin will be unzipped inside the users plugins folder it must have it’s own
directory inside the .zip file to not interfere with other plugins. Mandatory files are: netadata.txt and __init__.py
But it would be nice to have a README.py and of course an icon to represent the plugin (resources.qrc). Following is an example of how a plugin.zip should look like.
plugin.zip
pluginfolder/
|-- i18n
|
|-- translation_file_de.ts
|-- img
|
|-- icon.png
|
‘-- iconsource.svg
|-- __init__.py
|-- Makefile
|-- metadata.txt
|-- more_code.py
|-- main_code.py
|-- README.md
|-- resources.qrc
|-- resources_rc.py
‘-- ui_Qt_user_interface_file.ui
72
Chapter 16. あなたのプラグインのリリース
Chapter 17
コードスニペット
このセクションではプラグインの開発を容易にするコードスニペットを特集します。
17.1 キーボードショートカットによるメソッド呼び出し方法
In the plug-in add to the initGui():
self.keyAction = QAction("Test Plugin", self.iface.mainWindow())
self.iface.registerMainWindowAction(self.keyAction, "F7") # action1 triggered by F7 key
self.iface.addPluginToMenu("&Test plugins", self.keyAction)
QObject.connect(self.keyAction, SIGNAL("triggered()"),self.keyActionF7)
To unload() add:
self.iface.unregisterMainWindowAction(self.keyAction)
The method that is called when F7 is pressed:
def keyActionF7(self):
QMessageBox.information(self.iface.mainWindow(),"Ok", "You pressed F7")
17.2 How to toggle Layers (work around)
As there is currently no method to directly access the layers in the legend, here is a workaround how to toggle the
layers using layer transparency:
def toggleLayer(self, lyrNr):
lyr = self.iface.mapCanvas().layer(lyrNr)
if lyr:
cTran = lyr.getTransparency()
lyr.setTransparency(0 if cTran > 100 else 255)
self.iface.mapCanvas().refresh()
The method requires the layer number (0 being the top most) and can be called by:
self.toggleLayer(3)
73
PyQGIS developer cookbook, リリース 2.2
17.3 選択した機能の属性テーブルへのアクセス方法
def changeValue(self, value):
layer = self.iface.activeLayer()
if(layer):
nF = layer.selectedFeatureCount()
if (nF > 0):
layer.startEditing()
ob = layer.selectedFeaturesIds()
b = QVariant(value)
if (nF > 1):
for i in ob:
layer.changeAttributeValue(int(i),1,b) # 1 being the second column
else:
layer.changeAttributeValue(int(ob[0]),1,b) # 1 being the second column
layer.commitChanges()
else:
QMessageBox.critical(self.iface.mainWindow(),"Error", "Please select at \
least one feature from current layer")
else:
QMessageBox.critical(self.iface.mainWindow(),"Error","Please select a layer")
The method requires one parameter (the new value for the attribute field of the selected feature(s)) and can be
called by:
self.changeValue(50)
74
Chapter 17. コードスニペット
Chapter 18
ネットワーク分析ライブラリ
リビジョン ee19294562 (QGIS >= 1.8) から、QGIS のコアプラグインにネットワーク分析ライブラリが追加
されました。このライブラリは:
• 地理データから数学的なグラフ(ポリラインベクタレイヤー)を作成します。
• implements basics method of the graph theory (currently only Dijkstra’s algorithm)
Network analysis library was created by exporting basics functions from RoadGraph core plugin and now you can
use it’s methods in plugins or directly from Python console.
18.1 一般情報
Briefly typical use case can be described as:
1. 地理データから地理学的なグラフ(たいていはポリラインベクタレイヤー)を作成します。
2. グラフ分析の実行
3. 分析結果の利用(例えば、これらの可視化)
18.2 Building graph
The first thing you need to do — is to prepare input data, that is to convert vector layer into graph. All further
actions will use this graph, not the layer.
As a source we can use any polyline vector layer. Nodes of the polylines become graph vertices, and segments of
the polylines are graph edges. If several nodes have the same coordinates then they are the same graph vertex. So
two lines that have a common node become connected to each other.
Additionally, during graph creation it is possible to “fix” (“tie”) to the input vector layer any number of additional
points. For each additional point a match will be found— closest graph vertex or closest graph edge. In the latter
case the edge will be splitted and new vertex added.
As the properties of the edge a vector layer attributes can be used and length of the edge.
Converter from vector layer to graph is developed using Builder programming pattern. For graph construction
response so-called Director. There is only one Director for now: QgsLineVectorLayerDirector. The director
sets the basic settings that will be used to construct a graph from a line vector layer, used by the builder to create
graph. Currently, as in the case with the director, only one builder exists: QgsGraphBuilder, that creates QgsGraph
objects. You may want to implement your own builders that will build a graphs compatible with such libraries as
BGL or NetworkX.
To calculate edge properties programming pattern strategy is used. For now only QgsDistanceArcProperter strategy is available, that takes into account the length of the route. You can implement your own strategy that will
75
PyQGIS developer cookbook, リリース 2.2
use all necessary parameters. For example, RoadGraph plugin uses strategy that compute travel time using edge
length and speed value from attributes.
It’s time to dive in the process.
First of all, to use this library we should import networkanalysis module:
from qgis.networkanalysis import *
Than create director:
# don’t use information about road direction from layer attributes,
# all roads are treated as two-way
director = QgsLineVectorLayerDirector( vLayer, -1, ’’, ’’, ’’, 3 )
# use fied with index 5 as source of information about roads direction.
# unilateral roads with direct direction have attribute value "yes",
# unilateral roads with reverse direction - "1", and accordingly bilateral
# roads - "no". By default roads are treated as two-way. This
# scheme can be used with OpenStreetMap data
director = QgsLineVectorLayerDirector( vLayer, 5, ’yes’, ’1’, ’no’, 3 )
To construct a director we should pass vector layer, that will be used as source for graph and information about
allowed movement on each road segment (unilateral or bilateral movement, direct or reverse direction). Here is
full list of this parameters:
• vl — vector layer used to build graph
• directionFieldId — index of the attribute table field, where information about roads directions is stored. If
-1, then don’t use this info at all
• directDirectionValue — field value for roads with direct direction (moving from first line point to last one)
• reverseDirectionValue — field value for roads with reverse direction (moving from last line point to first
one)
• bothDirectionValue — field value for bilateral roads (for such roads we can move from first point to last and
from last to first)
• defaultDirection — default road direction. This value will be used for those roads where field directionFieldId is not set or have some value different from above.
It is necessary then to create strategy for calculating edge properties:
properter = QgsDistanceArcProperter()
And tell the director about this strategy:
director.addProperter( properter )
Now we can create builder, which will create graph. QgsGraphBuilder constructor takes several arguments:
• crs —使用する空間参照系。必須の引数です。
• otfEnabled — “オンザフライ” 再投影を使うかどうか。デフォルトでは定数:True (OTF 使用).
• トポロジ許容値—トポロジ的な許容値です。デフォルト値は 0 です。
• 楕円体 ID — 使用する楕円体です。デフォルトは “WGS84” です。
# only CRS is set, all other values are defaults
builder = QgsGraphBuilder( myCRS )
Also we can set several points, which will be used in analysis. For example:
startPoint = QgsPoint( 82.7112, 55.1672 )
endPoint = QgsPoint( 83.1879, 54.7079 )
Now all is in place so we can build graph and “tie” points to it:
76
Chapter 18. ネットワーク分析ライブラリ
PyQGIS developer cookbook, リリース 2.2
tiedPoints = director.makeGraph( builder, [ startPoint, endPoint ] )
Building graph can take some time (depends on number of features in a layer and layer size). tiedPoints is a list
with coordinates of “tied” points. When build operation is finished we can get graph and use it for the analysis:
graph = builder.graph()
With the next code we can get indexes of our points:
startId = graph.findVertex( tiedPoints[ 0 ] )
endId = graph.findVertex( tiedPoints[ 1 ] )
18.3 グラフ分析
Networks analysis is used to find answers on two questions: which vertices are connected and how to find a
shortest path. To solve this problems network analysis library provides Dijkstra’s algorithm.
Dijkstra’s algorithm finds the best route from one of the vertices of the graph to all the others and the values of the
optimization parameters. The results can be represented as shortest path tree.
The shortest path tree is as oriented weighted graph (or more precisely — tree) with the following properties:
• only one vertex have no incoming edges ― the root of the tree
• all other vertices have only one incoming edge
• if vertex B is reachable from vertex A, then path from A to B is single available path and it is optimal
(shortest) on this graph
To get shortest path tree use methods Use methods shortestTree() and dijkstra() of QgsGraphAnalyzer
class. It is recommended to use method dijkstra() because it works faster and uses memory more efficiently.
The shortestTree() method is useful when you want to walk around the shortest path tree. It always creates
new graph object (QgsGraph) and accepts three variables:
• source
— 入力グラフ
• startVertexIdx — ツリー上のポイントのインデックス(ツリーのルート)
• criterionNum — 使用するエッジプロパティの数(0 から始まる)。
tree = QgsGraphAnalyzer.shortestTree( graph, startId, 0 )
The dijkstra() method has the same arguments, but returns two arrays. In the first array element i contains
index of the incoming edge or -1 if there are no incoming edges. In the second array element i contains distance
from the root of the tree to vertex i or DOUBLE_MAX if vertex i is unreachable from the root.
(tree, cost) = QgsGraphAnalyzer.dijkstra( graph, startId, 0 )
Here is very simple code to display shortest path tree using graph created with shortestTree() method (select
linestring layer in TOC and replace coordinates with yours one). Warning: use this code only as an example, it
creates a lots of QgsRubberBand objects and may be slow on large datasets.
from PyQt4.QtCore import *
from PyQt4.QtGui import *
from qgis.core import *
from qgis.gui import *
from qgis.networkanalysis import *
vl = qgis.utils.iface.mapCanvas().currentLayer()
director = QgsLineVectorLayerDirector( vl, -1, ’’, ’’, ’’, 3 )
properter = QgsDistanceArcProperter()
director.addProperter( properter )
18.3. グラフ分析
77
PyQGIS developer cookbook, リリース 2.2
crs = qgis.utils.iface.mapCanvas().mapRenderer().destinationCrs()
builder = QgsGraphBuilder( crs )
pStart = QgsPoint( -0.743804, 0.22954 )
tiedPoint = director.makeGraph( builder, [ pStart ] )
pStart = tiedPoint[ 0 ]
graph = builder.graph()
idStart = graph.findVertex( pStart )
tree = QgsGraphAnalyzer.shortestTree( graph, idStart, 0 )
i = 0;
while ( i < tree.arcCount() ):
rb = QgsRubberBand( qgis.utils.iface.mapCanvas() )
rb.setColor ( Qt.red )
rb.addPoint ( tree.vertex( tree.arc( i ).inVertex() ).point() )
rb.addPoint ( tree.vertex( tree.arc( i ).outVertex() ).point() )
i = i + 1
Same thing but using dijkstra() method:
from PyQt4.QtCore import *
from PyQt4.QtGui import *
from qgis.core import *
from qgis.gui import *
from qgis.networkanalysis import *
vl = qgis.utils.iface.mapCanvas().currentLayer()
director = QgsLineVectorLayerDirector( vl, -1, ’’, ’’, ’’, 3 )
properter = QgsDistanceArcProperter()
director.addProperter( properter )
crs = qgis.utils.iface.mapCanvas().mapRenderer().destinationCrs()
builder = QgsGraphBuilder( crs )
pStart = QgsPoint( -1.37144, 0.543836 )
tiedPoint = director.makeGraph( builder, [ pStart ] )
pStart = tiedPoint[ 0 ]
graph = builder.graph()
idStart = graph.findVertex( pStart )
( tree, costs ) = QgsGraphAnalyzer.dijkstra( graph, idStart, 0 )
for edgeId in tree:
if edgeId == -1:
continue
rb = QgsRubberBand( qgis.utils.iface.mapCanvas() )
rb.setColor ( Qt.red )
rb.addPoint ( graph.vertex( graph.arc( edgeId ).inVertex() ).point() )
rb.addPoint ( graph.vertex( graph.arc( edgeId ).outVertex() ).point() )
18.3.1 Finding shortest path
To find optimal path between two points the following approach is used. Both points (start A and end B) are “tied”
to graph when it builds. Than using methods shortestTree() or dijkstra() we build shortest tree with
root in the start point A. In the same tree we also found end point B and start to walk through tree from point B to
point A. Whole algorithm can be written as:
78
Chapter 18. ネットワーク分析ライブラリ
PyQGIS developer cookbook, リリース 2.2
assign Т = B
while Т != A
add point Т to path
get incoming edge for point Т
look for point ТТ, that is start point of this edge
assign Т = ТТ
add point А to path
At this point we have path, in the form of the inverted list of vertices (vertices are listed in reversed order from
end point to start one) that will be visited during traveling by this path.
Here is the sample code for QGIS Python Console (you will need to select linestring layer in TOC and replace
coordinates in the code with yours) that uses method shortestTree():
from PyQt4.QtCore import *
from PyQt4.QtGui import *
from qgis.core import *
from qgis.gui import *
from qgis.networkanalysis import *
vl = qgis.utils.iface.mapCanvas().currentLayer()
director = QgsLineVectorLayerDirector( vl, -1, ’’, ’’, ’’, 3 )
properter = QgsDistanceArcProperter()
director.addProperter( properter )
crs = qgis.utils.iface.mapCanvas().mapRenderer().destinationCrs()
builder = QgsGraphBuilder( crs )
pStart = QgsPoint( -0.835953, 0.15679 )
pStop = QgsPoint( -1.1027, 0.699986 )
tiedPoints = director.makeGraph( builder, [ pStart, pStop ] )
graph = builder.graph()
tStart = tiedPoints[ 0 ]
tStop = tiedPoints[ 1 ]
idStart = graph.findVertex( tStart )
tree = QgsGraphAnalyzer.shortestTree( graph, idStart, 0 )
idStart = tree.findVertex( tStart )
idStop = tree.findVertex( tStop )
if idStop == -1:
print "Path not found"
else:
p = []
while ( idStart != idStop ):
l = tree.vertex( idStop ).inArc()
if len( l ) == 0:
break
e = tree.arc( l[ 0 ] )
p.insert( 0, tree.vertex( e.inVertex() ).point() )
idStop = e.outVertex()
p.insert( 0, tStart )
rb = QgsRubberBand( qgis.utils.iface.mapCanvas() )
rb.setColor( Qt.red )
for pnt in p:
rb.addPoint(pnt)
And here is the same sample but using dikstra() method:
18.3. グラフ分析
79
PyQGIS developer cookbook, リリース 2.2
from PyQt4.QtCore import *
from PyQt4.QtGui import *
from qgis.core import *
from qgis.gui import *
from qgis.networkanalysis import *
vl = qgis.utils.iface.mapCanvas().currentLayer()
director = QgsLineVectorLayerDirector( vl, -1, ’’, ’’, ’’, 3 )
properter = QgsDistanceArcProperter()
director.addProperter( properter )
crs = qgis.utils.iface.mapCanvas().mapRenderer().destinationCrs()
builder = QgsGraphBuilder( crs )
pStart = QgsPoint( -0.835953, 0.15679 )
pStop = QgsPoint( -1.1027, 0.699986 )
tiedPoints = director.makeGraph( builder, [ pStart, pStop ] )
graph = builder.graph()
tStart = tiedPoints[ 0 ]
tStop = tiedPoints[ 1 ]
idStart = graph.findVertex( tStart )
idStop = graph.findVertex( tStop )
( tree, cost ) = QgsGraphAnalyzer.dijkstra( graph, idStart, 0 )
if tree[ idStop ] == -1:
print "Path not found"
else:
p = []
curPos = idStop
while curPos != idStart:
p.append( graph.vertex( graph.arc( tree[ curPos ] ).inVertex() ).point() )
curPos = graph.arc( tree[ curPos ] ).outVertex();
p.append( tStart )
rb = QgsRubberBand( qgis.utils.iface.mapCanvas() )
rb.setColor( Qt.red )
for pnt in p:
rb.addPoint(pnt)
18.3.2 Areas of the availability
Area of availability for vertex A is a subset of graph vertices, that are accessible from vertex A and cost of the
path from A to this vertices are not greater that some value.
More clearly this can be shown with the following example: “There is a fire station. What part of city fire
command can reach in 5 minutes? 10 minutes? 15 minutes?”. Answers on this questions are fire station’s areas of
availability.
To find areas of availablity we can use method dijksta() of the QgsGraphAnalyzer class. It is enough
to compare elements of cost array with predefined value. If cost[ i ] is less or equal than predefined value, than
vertex i is inside area of availability, otherwise — outside.
More difficult it is to get borders of area of availablity. Bottom border — is a set of vertices that are still accessible,
and top border — is a set of vertices which are not accesible. In fact this is simple: availability border passed on
such edges of the shortest path tree for which start vertex is accessible and end vertex is not accessible.
80
Chapter 18. ネットワーク分析ライブラリ
PyQGIS developer cookbook, リリース 2.2
Here is an example:
from PyQt4.QtCore import *
from PyQt4.QtGui import *
from qgis.core import *
from qgis.gui import *
from qgis.networkanalysis import *
vl = qgis.utils.iface.mapCanvas().currentLayer()
director = QgsLineVectorLayerDirector( vl, -1, ’’, ’’, ’’, 3 )
properter = QgsDistanceArcProperter()
director.addProperter( properter )
crs = qgis.utils.iface.mapCanvas().mapRenderer().destinationCrs()
builder = QgsGraphBuilder( crs )
pStart = QgsPoint( 65.5462, 57.1509 )
delta = qgis.utils.iface.mapCanvas().getCoordinateTransform().mapUnitsPerPixel() * 1
rb = QgsRubberBand( qgis.utils.iface.mapCanvas(), True )
rb.setColor( Qt.green )
rb.addPoint( QgsPoint( pStart.x() - delta, pStart.y() - delta
rb.addPoint( QgsPoint( pStart.x() + delta, pStart.y() - delta
rb.addPoint( QgsPoint( pStart.x() + delta, pStart.y() + delta
rb.addPoint( QgsPoint( pStart.x() - delta, pStart.y() + delta
)
)
)
)
)
)
)
)
tiedPoints = director.makeGraph( builder, [ pStart ] )
graph = builder.graph()
tStart = tiedPoints[ 0 ]
idStart = graph.findVertex( tStart )
( tree, cost ) = QgsGraphAnalyzer.dijkstra( graph, idStart, 0 )
upperBound = []
r = 2000.0
i = 0
while i < len(cost):
if cost[ i ] > r and tree[ i ] != -1:
outVertexId = graph.arc( tree [ i ] ).outVertex()
if cost[ outVertexId ] < r:
upperBound.append( i )
i = i + 1
for i in upperBound:
centerPoint = graph.vertex( i ).point()
rb = QgsRubberBand( qgis.utils.iface.mapCanvas(), True )
rb.setColor( Qt.red )
rb.addPoint( QgsPoint( centerPoint.x() - delta, centerPoint.y()
rb.addPoint( QgsPoint( centerPoint.x() + delta, centerPoint.y()
rb.addPoint( QgsPoint( centerPoint.x() + delta, centerPoint.y()
rb.addPoint( QgsPoint( centerPoint.x() - delta, centerPoint.y()
18.3. グラフ分析
+
+
delta
delta
delta
delta
)
)
)
)
)
)
)
)
81
© Copyright 2026 Paperzz