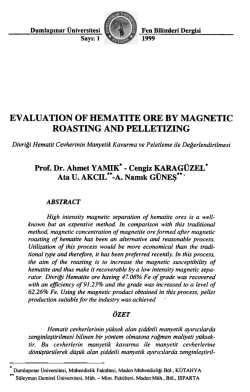
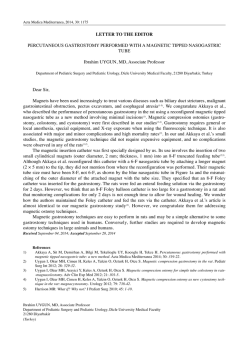
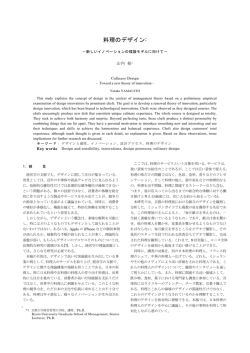
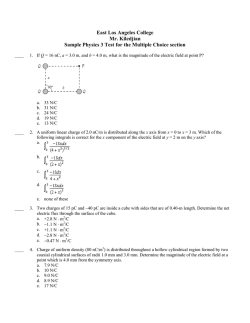
40 Scientia Africana, Vol. 14 (No.1), June 2015. Pp 40-54 © College of Natural and Applied Sciences, University of Port Harcourt, Printed in Nigeria ISSN 1118 – 1931 QUALITATIVE INTERPRETATION OF HIGH RESOLUTION AEROMAGNETIC (HRAM) DATA FROM SOME PARTS OF OFFSHORE NIGER DELTA, NIGERIA G. Emudjaporue1 and C.C. Ofoha2. Department of physics, University of Port Harcourt, Rivers State, Nigeria (+2347038983887) Email:[email protected]. Received: 25-02-15 Accepted:24-04-15 ABSTRACT This research is aimed at determining the lineaments with corresponding trend directions, to infer the effect of such lineaments on the general tectonic history and, perhaps, the implication of the above findings towards hydrocarbon exploration within the offshore Niger Delta of the study area. The original raster map, obtained from the Nigeria Geological Survey Agency (NGSA) in half degree sheet, was subjected to qualitative data analysis using the WingLink geophysical and visualization software. This analysis generated the contoured composite map of the study area. The Regional and the residual map were generated first and the Residual map obtained is in turn used to generate the first vertical derivative, first horizontal derivative, second vertical derivative, upward continued, and the reduction to pole maps. The result shows NE-SW, NW-SE, N-S and S-W trends. This probably was the result of faulting, fracturing, down warp and epeirogenic warping within the study area with the N-S and E-W bounded fault blocks, regarded as secondary faults, influencing tectonics of the area. Key Words: Enhancement techniques, High resolution aeromagnetic data, Magnetic partial derivatives, offshore Niger Delta. INTRODUCTION An aeromagnetic survey is a type of geophysical survey carried out using a magnetometer aboard or towed behind an aircraft. Aeromagnetic survey has developed to a sizeable extent over the past few years such that it has seen a revolution in the interpretation of solely basement structures to detailed examination of structures and lithologic variation in the sedimentary section. It is employed in hydrocarbon exploration for regional reconnaissance survey because a large area can be covered quickly and is useful for providing first hand information about the basement. Magnetic basement is an assemblage of rocks that underlies sedimentary basins and may also outcrop in places (Gunn, 1997). Magnetic susceptibility is basically the fundamental parameter of magnetic survey which is used for mineral and hydrocarbon exploration, as it reflects changes in the subsurface geologic structures and this property of rocks vary from place to place below the earth’s surface. This variation in the magnetic susceptibility can cause small variations in the magnetic fields of rocks measured on the surface. 41 Emudjaporue G. and Ofoha C. C.: Qualitative Interpretation of High Resolution Aeromagnetic (HRAM) Data from some In a bid to gain more insight into the architectural framework of the basement which will exert significant control on the structural and, perhaps, petroleum deposition of the overlying sedimentary section, this work was undertaken. Location and geologic settings of study area The study area lies between longitude 4030i E and 50 E and latitude 3o30iN and 4030N with an approximate area of about 6050 km2 within the Niger Delta sedimentary basin of Nigeria, (Fig 1.1).The Niger Delta is situated in the apex of the Gulf of Guinea on the West Coast Africa. The stratigraphic and structural disposition of the Niger Delta has been documented by several workers including (Reijers,1995).The Niger Delta was formed by the build up of sediments over a crustal tract developed by rift faulting during the Precambrian with outlines controlled by deep seated faults associated with rifting (Weber and Daukoru, 1975). Rifting diminished in the late Cretaceous and gravity tectonism became the primary deformational process after the rifting phase in the Niger Delta. The Niger Delta started as two different depocenters in the BendeAmeki area, east of the Delta and in the Anambra Shelve, West of the delta in the mid to late Eocene. These two depocenters later formed a single deltaic sedimentary basin in the late Miocene to date (Blakely, 1996).The Tertiary section of the Niger Delta is divided into three Formations representing prograding depositional facies that are distinguished on the basis of sandshale ratios to recent Akata Formations, which is the potential source rock and is estimated to be up to 7000 m thick (Michele et al.,1999). Fig 1.1 Index Map of Nigeria and Environs Showing the Study Area (after Doust and Omatsola, 1990) 42 Scientia Africana, Vol. 14 (No.1), June 2015. Pp 40-54 © College of Natural and Applied Sciences, University of Port Harcourt, Printed in Nigeria MATERIALS AND METHODS The digitized total magnetic intensity map with sheet number 333b and 340 (fig 3.1) used for this work were sourced from the Nigerian geological survey agency, NGSA. The data, acquired on a series of NW-SE flight lines in 2009 by Fugro Airborn service, are part of offshore Niger Delta Fig 3.1 Raster Map of the Study Area ISSN 1118 – 1931 covering an area of about 6052 km2. It is of higher resolution than those of 1970s in that it has a terrain clearance of 100 m and line spacing of 500 m while tie lines occur at about 20 km. The Arc GIS and WingLink Geophysical software were used for the data analysis, processing and interpretation. 43 Emudjaporue G. and Ofoha C. C.: Qualitative Interpretation of High Resolution Aeromagnetic (HRAM) Data from some Aeromagnetic Data Processing, Reduction and Enhancement Techniques. For better interpretation and understanding of the aeromagnetic data within the study area, the data was processed and thereafter enhancement techniques applied. Aeromagnetic data processing includes everything done to the data between acquisition and the creation of an interpretable profile map or digital data set (Nabighian et al., 2001). The reduction of magnetic data is important in order to remove all causes of magnetic variation from the observation other than those arising from the magnetic effects of the subsurface. The processing of the aeromagnetic data used for this study began with the removal of diurnal variations and corrections with respect to the international geomagnetic reference field (IGRF) model of the Earth, for the year 2010. As part of its processing stage, the data was pre-processed by verifying and editing the raw data and locating the data in the xy plane using Oasis Montaj software. The data was transmitted as IGRF corrected total magnetic intensity (TMI) data and saved in Geosoft database as Geosoft Grid file (GGF) format by the NGSA. For this study, the data were processed again using Arc GIS by converting the data in a form using by the WingLink software. The transformation (or enhancement) techniques are analytical techniques applied to the total magnetic intensity map so as to make obvious to the human eye the deep seated and shallow subsurface structures. Based on the objectives of the study, the transformation techniques applied to the raster map include: Regional and Residual Separation. For an effective analysis to be implemented and actualized, deep seated features and the shallow features must be distinguished. In this study, the regional and the residual were firstly separated before other aeromagnetic data enhancement techniques could be applied out as this ensures the enhancement of the anomalous features. This research, however, adopted six analytical smoothing or separation techniques which include first vertical derivative, second vertical derivative, first horizontal derivative, upward continuation, reduction to pole and low pass filtering. First Vertical Derivative. This technique, though having less resolving power, is analogues to the second in that the process enhances high frequencies relative to low frequencies. This property is the basis for the application of the derivative process which eliminates long wavelength regional effects and resolves the effect of adjacent anomalies. Second Vertical Derivative. The second vertical derivative enhances near surface effects at the expense of deeper anomalies. This was done by extracting the anomalous feature using the gridding tools. To accentuate this anomalous effect, the residual map of degree one obtained from the total magnetic intensity (TMI) map was used. Therefore, it can be reasoned that local features will manifest more prominently on the map as one of the derivatives thus indicating places where residual anomalies may be located. This method according to Luis (2009) is based on the mathematical formulation expressed as: 44 Scientia Africana, Vol. 14 (No.1), June 2015. Pp 40-54 © College of Natural and Applied Sciences, University of Port Harcourt, Printed in Nigeria - - - - - - ISSN 1118 – 1931 - - 3.1 Where n = The nth order vertical derivative. Ø = The potential of the magnetic field. = The fourier transform of the magnetic field. First Horizontal Derivative. This process involves a phase transformation as well as an enhancement of low frequencies. The phase transformation generally has the result of producing anomaly peaks approximately located over the edges of wide bodies and the enhancement of high frequencies sharpens these peaks to increase the definition of the body edges. Luis (2009) stated that, in Fourier domain, the horizontal derivatives of a smoothly scalar quantity Ø(x, y), in x and y directions are given by: - - - - - - - - 3.2 - - - - - - - - 3.3 Where the factors and are operators which transforms a function into nth order derivatives with respect to x and y, respectively. surface to a higher level. During the analysis, this technique was applied on the residual. This transformation reduces the effect of shallow bodies with respect to deep causative sources. Blakely (1995) showed the expression for upward continuation, from Green’s third identity of a potential field measured on a level at point , as Upward Continuation Upward continuation was applied to transform the observed magnetic field on a Applying the Fourier convolution to equation 3.4 - - - 3.4 - - - - 3.5 - - - - 3.5 a Where 3.5a is the analytical expression of continued field. - and is the Fourier transform of the upward , z>0 45 Emudjaporue G. and Ofoha C. C.: Qualitative Interpretation of High Resolution Aeromagnetic (HRAM) Data from some Reduction to Pole Reduction to pole enhancement technique is the process of converting the magnetic field from magnetic latitude where the earth’s field is inclined, to the field at a magnetic pole, where the inducing field is vertical. When the earth’s field is inclined, magnetic anomalies due to induction have forms that are asymmetrically related to their sources, but when the inducing field is vertical, the induced anomalies are directly over their sources (Milligan and Gunn, 1997). - - Reduction to the pole greatly simplifies the interpretation of magnetic data, because at magnetic latitudes less than 500 the relationship of anomaly form to source geometry is often not obvious (Milligan and Gunn, 1997). A basic assumption of the reduction to pole process is that all bodies are magnetized by induction. According to Luis (2009), this technique is applied from the Fourier transform of the total field anomaly T as: - - - - - 3.6 Where is called reduction to pole operator. and are the angles made where the earth’s field is inclined to the field at a magnetic pole and where the inducing field is vertical respectively. Tr is the transformed anomaly to the north magnetic pole, where induced magnetization and ambient field are directed vertically downwards. Low pass filter To actualize the proposed target, a low pass filter action was utilized for qualitative interpretation. The nature of filtering applied to the aeromagnetic data in the study was chosen to eliminate certain wavelengths, with the low pass filter allowing low frequency components. RESULTS AND DISCUSSION The raster map with its corresponding legend consists of colour intervals depicting magnetic highs and lows. The legend which accentuates the visualization of the magnetic field represents magnetic high with purple, red and orange colours and magnetic low represented by the yellow, green and blue colours. The magnetization is represented by the negative values attached to the legend though with the high and low magnetic values occurring at the northern and southern portion respectively. The southern portion with low magnetization is typical of sedimentary terrain while high magnetization occurring at the northern portion is a reflection of a basement complex. The contoured total magnetic intensity map (Fig 4.1) obtained from the raster map is composed of residual anomalies superimposed on the regional magnetic anomalies. The regional and the residual anomalies are the result of total magnetization of rocks and indicate the whole sum of remnant and induced magnetization. The residual anomalies are due to effect from shallow magnetic bodies while the regional anomalies are due to deep seated magnetic bodies in the upper mantle. 46 Scientia Africana, Vol. 14 (No.1), June 2015. Pp 40-54 © College of Natural and Applied Sciences, University of Port Harcourt, Printed in Nigeria The total high field values recorded in the map is due to the regional effect. The closely spaced, linear, parallel and sub parallel anomalies trend majorly in the NESW direction. The NE-SW trends probably indicate the Charcot fault and oceanic fracture zone which are believed to be extending continuously landward towards the West Africa region. Visual inspection of the residual maps (Fig 4.2A) show that the anomalies are accentuated more on the residual map and are not closely parked unlike the total magnetic intensity (TMI) contoured map. At the southern end of the residual map ( Fig 4.2B) is located an anomaly, labelled C1, with low relief. The contours are, howeverof short wavelength, closed and elongated. C1, ISSN 1118 – 1931 according to Dobrin and Savit (1988), may be as a result of a dyke. Slightly above this anomaly and moving northwest ward is a belt labelled BC. This belt consists of linear anomalies with low relief. Dobrin and Savit (1988) proposed that such anomalous pattern results from subsurface faulting that have displaced magnetized rocks. Further upwards are parallel and curved anomalies believed to be due to deep seated foldings. Krutikhovskaya et at., (1972) stated that the parallel and curved anomalies are to be a reflection of large tectonic feature of ancient geosynclines. Both the faults and fonds run parallel to each other. This is typical of Nigeria schist belt which are thought to be deposited in a back arc basin developed after the onset of subduction at the cratonic margin about 600. Fig 4.1 Composite Map of the Study Area Presented in Contours (nT). 47 Emudjaporue G. and Ofoha C. C.: Qualitative Interpretation of High Resolution Aeromagnetic (HRAM) Data from some Ma. Okenye (2004) also stated that this type of anomaly with high relief and steep gradient overlying the fault zone in the NESW direction is suggestive of a shallow basement. At the central portion of the residual map, also lie anomalies B1, B2 and B3. These anomalies have elliptical symmetries but with B3 having longer wavelength and broad gradient. This indicates that B3 is caused by a deep seated feature. Okenye (2004) is of the opinion that these anomalies at the central portion of the map are probably due to subsurface faulting. Gunn (1997), stated that oval or circular anomalies, such as B1 and B2, arose as a result of the accumulation of magnetite. Moving northward are anomalous features A1 and A2.This is possibly due to the dislocation of magnetic units within the study area. The residual maps reveal NESW trends and trending boundaries Fig 4.3 The Regional of the Total Magnetic Intensity Map (nT) The regional map (Fig 4.3) highlights planar NW-SE trends which roughly correspond to the transition between continental and oceanic crust and is with the axis of maximum sedimentary thickness. The NESW trend in combination with the NW-SE trends reflects the shape of the Niger Delta. They predominate and obscure the subtles lineament (brittle faults) trending N-S and which were not seen on the TMI map. This, therefore, necessitates the need for other enhancement and filtering techniques. 48 Scientia Africana, Vol. 14 (No.1), June 2015. Pp 40-54 © College of Natural and Applied Sciences, University of Port Harcourt, Printed in Nigeria Fig 4.2a The Residual of the Total Magnetic Intensity Map (nT). Fig 4.2b The Residual Map Showing Lineament and Dislocation of Magnetic Units (nT) ISSN 1118 – 1931 49 Emudjaporue G. and Ofoha C. C.: Qualitative Interpretation of High Resolution Aeromagnetic (HRAM) Data from some The first and second vertical derivative map (Fig 4.4 and Fig 4.5) highlights shallow features with the anomalies trending NESW and E-W, N-S respectively. Dissimilar to the TMI map, the first vertical derivative map consists of circular and elliptical balloon like magnetic signatures occurring dominantly at the southern end of the map. The second vertical derivative map indicates localized irregular anomalies like the first vertical derivative map but with the first vertical derivative map showing signatures with reduced width. The irregular anomalies with circular symmetry are probably due to hydrocarbon seepage. Consequently, hydrocarbon seepage can result in positive and negative magnetic anomalies or no anomalies at all (Gunn, 1997). In the study area, vertical and horizontal movement exists as this can be seen from the second vertical map. The N-S trends were probably induced by a combination of differential subsidence across a fault zone and by a local uplift as reported by Okiwelu and Ude (2012). These movements created minibasin and arching as the basement block boundaries which acts as lineament affects deposition in the offshore Niger Delta. Conduits, which can act as barriers, result from the lineaments and through this path hydrocarbon and mineralized fluids flow. The horizontal derivative map (Fig 4.6), with trends E-W and NE-SW, majorly points out areas of low frequency which are related to deep seated features. The map shows smoothened signatures that are elongated at the southern part of the map. The signatures at the southern area are dyke like structures which possibly holds hydrocarbon. The northern area of the map is made up of cessations with circular or less circular anomalies. Okiwelu and Ude (2012) opined that such areas are possible indication of faults or fractures that are associated with possible depletion of magnetite. In the reduction to pole map (Fig 4.7), there is a significant shift in the anomalies towards the northern region, though the anomalies still trend in the NE-SW direction and a fault occurring in the N-E direction. The N-E trend thus divides the reduction to pole map into two equal half of northern and southern parts. The reduction to pole filtering technique reconstructs the magnetic field of the aeromagnetic data as if it were at the pole. This made the induced anomalies to be directly over their sources. The upward continued map (Fig 4.8) obtained from the residual map enhanced greatly the deep seated anomalous features with the anomalies trending NE-SW dominating. The signatures are relatively spaced unlike the TMI map. This is a pointer to basement related structures. Greater accentuation of deep seated features or low wave number components is revealed by the filtered map (Fig 4.9). The signatures trend in the NE-SW direction and are not closely parked. 50 Scientia Africana, Vol. 14 (No.1), June 2015. Pp 40-54 © College of Natural and Applied Sciences, University of Port Harcourt, Printed in Nigeria Fig 4.4 First Vertical Derivative from Residual Map (nT) Fig 4.5 Horizontal Derivative from the Residual (nT) ISSN 1118 – 1931 51 Emudjaporue G. and Ofoha C. C.: Qualitative Interpretation of High Resolution Aeromagnetic (HRAM) Data from some Fig 4.6 The Second Vertical Derivative Map (nT) Fig 4.7 The Reduction to Pole Map (nT) 52 Scientia Africana, Vol. 14 (No.1), June 2015. Pp 40-54 © College of Natural and Applied Sciences, University of Port Harcourt, Printed in Nigeria Fig 4.8 The Residual Upward Continued at 2 KM (nT) Fig 4.9 The Low Pass Filtered Map at 2 KM (nT) ISSN 1118 – 1931 53 Emudjaporue G. and Ofoha C. C.: Qualitative Interpretation of High Resolution Aeromagnetic (HRAM) Data from some The NE-SW and NW-SE is recognized by Hospers (1971) as the major tectonic frame work of the Niger Delta while Babalola and Gibson (1991) recognize the NE-SW, E-W, and N-S trend as lineations which are interpreted as fracture zone trends beneath the Niger Delta. So a combination of these trends, resulting from wrench or shear fault involving the basement is discernable from the residual, regional and other enhanced maps. This probably created faulting, fracturing, downwarp and epeirogenic warping within the study area with the N-S and E-W bounded fault blocks, regarded as secondary faults, influencing tectonics of the area. REFERENCES Babalola, O.O., and Gipson, M.(1991): Aeromagnetic anomalies and discordant lineations beneath the Niger Delta:Implications for new fractures zones and multiple sea floor spreading directions in the Gulf of Guinea,vol.18(6),1107-1110. Blakely, R.J.(1995): Potential theory in gravity and magnetic applications. Cambridge university press, New York, 435-567. Dobrin, M.B., and Savit, C.H.(1988): An introduction to geophysical th prospecting (4 edn). McGrall Hill international, New York, 636-706. Doust, H., and Omatsola, E. (1990): Divergent passive Margin Basin, AAPG Memoir 48, American association of Geologists, 48:42-55. Gunn, P.J. (1997): Application of aeromagnetic surveys to sedimentary basin studies. AGSO journal of Australian Geology and Geophysics, 17(2): 133-144. Hospers, J.(1971): The geology of the Niger Delta area. Symposium inst.Geol.Sci.London, 125-127. Krutikhovskaya, Z.A., Pashkevich, I.K., and Simonenko T.N. (1972): Magnetic Anomalies of Precambrian Shields and some problems of their Geological interpretation. Can.J.Earth Sci., 10(5): 629-635. Luis, A.M. (2009): Processing techniques of aeromagnetic data: Case studies from the Precambrian of Mozambique. Unpulished M.sc thesis, Uppsala university, Mozambique. Michele,L.W., Ronald, R.C., and Micheal, E.B.(1999): The Niger Delta Petroleum System:Niger Delta Province,Nigeria, Cameroun and Equitorial Guinea, Africa. USGS World Energy 99-118. Milligan, P.R., and Gunn P.J. (1997): Enhancement and presentation of airborne geophysical data. Common wealth of Australia, 17 (2): 63-75. Nabighian,M.N.,Grauch,V.J.S.,Hansen,R.O. ,Lafehr,T.R.,Li,Y.,Pearson,W.C.,Peir ce,J.W.,Phillips,J.D., and Ruder, M.E. (2001):Historical development of magnetic method in exploration. Geophysics, 23(17), 11-31. Okenye, V. (2004): Magnetic and gravity study of the oil potential of parts of Niger Delta. Msc thesis, University of Port Harcourt, Choba, Nigeria (Unpubl). 54 Scientia Africana, Vol. 14 (No.1), June 2015. Pp 40-54 © College of Natural and Applied Sciences, University of Port Harcourt, Printed in Nigeria Okiwelu, A.A., and Ude, I.A. (2012): 3D Modelling and Basement Tectonics of the Niger Delta Basin from Aeromagnetic Data. Intech open Science. http://creativecommons.org/licenses/ by/3.0, accessed on 25th september, 2014. Reijers, T.J. (1996): Stratigraphy and sedimentation of Niger Delta. Geologos, 17(3): 136-158. Weber, K.J., and Daukoru, E. (1975): Petroleum Geology of the Niger Delta. Tokyo 9th world Petroleum Congress Proceedings, 2, 209-2011. ISSN 1118 – 1931
© Copyright 2026 Paperzz