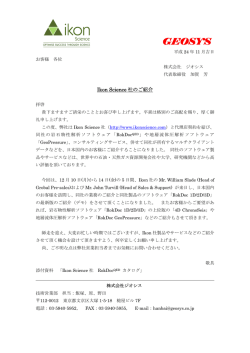
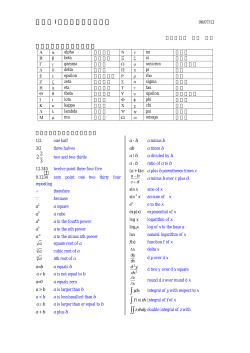
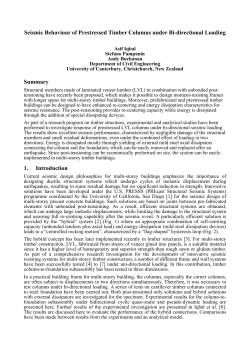
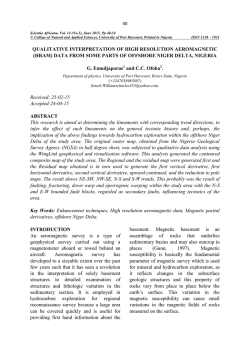
92
Scientia Africana, Vol. 13 (No.2), December 2014. Pp92-101
© College of Natural and Applied Sciences, University of Port Harcourt, Printed in Nigeria
ISSN 1118 - 1931
STRUCTURAL INTERPRETATION OF “ZULU” OIL FIELD, NIGER DELTA
A. A. Ibe* and J. Anyanwu
Department of Physics,
University of Port Harcourt, Choba.
Rivers State, Nigeria.
*
Corresponding author: [email protected]
+2348063569691.
Received: 05-05-14
Accepted: 12-06-14
ABSTRACT
Standard method for structural analysis was applied in the delineation of subsurface
structures using seismic and well log data from “ZULU” oil field Niger Delta. Hydrocarbon
potential of “ZULU” oil field was evaluated to delineate the geometry of the reservoir of
interest. The tops of the modeled reservoir were obtained at 2,365 m; 2,335 m; 2,331m and
2,265 m for well-1, well-2, well-3, and well-4 respectively. Faults were interpreted and
identified (F1, F2, and F3) using fault sticks, which was modeled to generate the skeletons. It
was observed that the fault skeletons showed pillar gridded pattern that produced the
reservoir which shows enclosed anticline structures that serves as a good traps for
hydrocarbon accumulation.
Key words: Fault skeleton, Pillar gridded, Zulu and Accumulation.
INTRODUCTION
Structural interpretation of seismic data,
Petrology and depositional environment of
the reservoir sandstone from different part
of the Niger Delta have been carried out to
determine the hydrocarbon potentials of the
area (Ajakaiye and Bally, 2002; Morgan,
2003). Subsurface configurations must be
understood in detail to effectively delineate
the structures that are favourable for
hydrocarbon accumulation. This is because
hydrocarbons are found in geological traps;
these traps may be structural or stratigraphic
in nature (Coffen, 1984). Majority of traps
in the Niger Delta are structural even though
stratigraphic and combined structuralstratigraphic traps are not common (Doust
and Omatsola, 1990). In Niger Delta
hydrocarbon fields, structural traps are
prevalent while stratigraphic trap also do
exist (Michele et al; 2012), during synsedimentary deformation of the Agbada
paralic sequence was the development of
structural trap sequence (Evamy et al;
1978). Stratigraphic traps develop between
the diapiric structures of Niger Delta
province where there are compartments of
sand stone (Beka and Oti, 1995).
Niger Delta is ranked among the major
prolific deltaic hydrocarbon provinces in the
world and is the most significant in West
African continental margin. Oil and gas are
principally produced from sandstones and
unconsolidated sands predominately in the
Agbada formation. Several geological and
geophysical investigations have been
performed in the Niger Delta basin starting
93
Ibe A. A. and Anyanwu J.: Structural Interpretation of “Zulu” Oil Field, Niger Delta.
about fifty years ago for oil and gas
prospecting (Aizebeokhai and Olayinka,
2011; Cobbold et al; 2009; Emujakporue
and Ngwueke, 2013). Hydrocarbon bearing
fields are characterized by multiple
heterogeneous reservoirs stacked over
intervals of 10,000ft thickness (Onyeagoro,
1998), the heterogeneities which occur at all
scales from pore scale to major reservoir
units result to spatial variation in the
reservoir properties (Martin et al; 2012).
The problem many oil and gas industries do
face is to delineate the complexity of the
reservoir and where wells are supposed to
be drilled. Accurate understanding of
hydrocarbon reservoir prior to production
can only be achieved by the work of
reservoir characterization model; hence
structural seismic interpretation provides the
spatial heterogeneity of hydrocarbon
reservoir.
Fault surfaces are common sub-terranean
structures which are associated with
displacement or offset of subsurface layer,
there are known to be essential for
hydrocarbon exploration since they are
associated with hydrocarbon accumulation
and flow paths for the purpose of mapping
complex geologic structures. The most
reliable
component
of
hydrocarbon
structural model is done by identifying,
extracting and modeling the fault surfaces
from the realized 3D seismic data.
Extractions of fault surfaces from seismic
data have been known to be a qualitative
technique and therefore require a careful
human interpretation (Isreal et al; 2006).
The aim of the study seeks to generate the
structural model of reservoirs in other to
have a better understanding of the
subsurface of the field location, thus
hydrocarbon production can be optimized.
Geology of Niger Delta
Niger Delta is among the hydrocarbon
prolific basins in the world (Alao et al;
2013). Around the West African continental
margin, it is significantly recognized for
hydrocarbon production and located at the
southern Nigeria boarding the Atlantic
Ocean (Ekine and Ibe, 2013).
It covers an area between longitude 4-90E
and latitude 4-90N; it is also composed of an
overall regressive clastic sequence, which
reaches a maximum thickness of about
12km (Evamy et al, 1978; Emujakporue and
Ngwueke, 2013). The three primary
lithostratigraphic units (Akata, Agbada and
Benin formation) as portrayed by the
subsurface of the Niger Delta decrease in
age basin ward, showing in general the
regression of depositional environments in
the Niger Delta clastic wedge. The type
section of the Akata formation was defined
in Akata well-1 which is 80km East of Port
Harcourt (Short and Stauble, 1967). A total
depth of 11,121ft (3,680) was reached in the
Akata well-1 without getting the base of the
formation. The top of the formation showed
the deepest occurrence of deltaic sandstone
beds (7,180ft in Akata well-1); its thickness
is about 21,000ft thick in the central part of
the clastic wedge (Doust and Omatsola,
1989).
The Agbada formation is defined in the
Agbada well-2 drilled about 11km NorthNorth West of Port Harcourt (Short and
Stauble, 1967). The well reached a total
depth of 9,500ft but did not get to the base
of the formation. It has a maximum
thickness of about 13,000ft (Doust and
Omatsola, 1989), the lithology is made up
of sand, silt sand and shale arranged within
10-100ft successions defined by progressive
94
Scientia Africana, Vol. 13 (No.2), December 2014. Pp92-101
© College of Natural and Applied Sciences, University of Port Harcourt, Printed in Nigeria
upward changes in grain size and bed
thickness.
The Benin formation is comprised of the top
part of Niger Delta clastic wedge from
Benin-Onitsha area in the North to beyond
the present coastline (Short and Stauble,
1967). The top of the formation is the recent
sub-aerially which exposed delta top surface
and its base extends to a depth of 4,600ft; it
is defined by the youngest marine shale.
Shallow parts of the formation are
composed entirely of non-marine sand
deposited in alluvial or upper coastal plain
environments during progradation of the
delta (Doust and Omatsola, 1989). Although
lack of preserved fauna inhibits accurate age
dating, the age of the formation is estimated
to range from Oligocene to recent (Short
and Stauble, 1967).
MATERIALS AND METHOD
The data comprised of digitized composite
well logs in LAS format from four offshore
wells, 3D seismic data, base map and petrel
geophysical software. The data was
imported into petrel workstation. Signatures
of the available log were displayed in the
log section window while the seismic data
were realized to show both the inline and xline seismic section.
The lithology
penetrated by the wells were delineated
using gamma ray (GR) logs, thus the major
lithology delineated were sand and shale
beds.
Hydrocarbon
reservoirs
were
suggested to be sand beds since they are
porous and permeable unlike shale that is
porous but not permeable.
For reservoir areas of interest, resistivity log
from each well was used to delineate the
presence of hydrocarbon; high resistivity
ISSN 1118 - 1931
value indicates hydrocarbon accumulation
while low resistivity value indicates
presence of water in the reservoir. The oilwater was delineated using the density log,
it was necessary to determine changes that
form the reservoirs which span the area of
the field. Well to seismic correlation was
carried out to map and tie similar reservoir
across the well and seismic in “Zulu” oil
field. Static shift was applied to the
synthetic so as to match up with the seismic
at Z1000-top and Z1000-base of Zulu-001
well log. These points form the formation
top and base. The essence of well to seismic
tie was to provide more confidence in
seismic interpretation (Fig.3).
RESULTS
The major motive of structural interpretation
is to use well and seismic section to
delineate the subsurface structures which are
potential areas of hydrocarbon exploration
(Emujakporue and Ngwueke, 2013).
95
Ibe A. A. and Anyanwu J.: Structural Interpretation of “Zulu” Oil Field, Niger Delta.
Fig. 1: Map of Niger Delta showing the possible location of the study area
Fig. 2: Base map of the study area
96
Scientia Africana, Vol. 13 (No.2), December 2014. Pp92-101
© College of Natural and Applied Sciences, University of Port Harcourt, Printed in Nigeria
Fig.3: Well to seismic tie
Fig.4: Well to seismic tie on inline 1598
ISSN 1118 - 1931
97
Ibe A. A. and Anyanwu J.: Structural Interpretation of “Zulu” Oil Field, Niger Delta.
This was achieved through mapping of seismic horizon, locating structural trap and placing
them on the base with a view of developing time horizon map (Fig.5).
Fig.5: Time map of Horizon Z1000-top
On the time map Z1000_top was located at 2000ms which is equivalent to 2331.1m on the
depth map, thus all reservoirs were delineated between 2,250m and 2,375m. For a better
interpretation, the time map was converted to structural depth map (Fig. 6 and 7).
Fig.6: Depth map of Z1000-top
98
Scientia Africana, Vol. 13 (No.2), December 2014. Pp92-101
© College of Natural and Applied Sciences, University of Port Harcourt, Printed in Nigeria
ISSN 1118 - 1931
Fig. 7: Time –Depth map
Considering the lateral reflection, we
observe discontinuity of the horizon at the
fault boundary caused by the weight of the
overlying strata after the fault have pushed
the underlying strata downward. Vertical
Fig.8: Interpretation fault sticks and wells
discontinuity of the reflectivity depicted
fault trends, which were traced on the inline
from North to South direction; hence this
gave a better resolution of the fault trends
(Fig.10).
99
Ibe A. A. and Anyanwu J.: Structural Interpretation of “Zulu” Oil Field, Niger Delta.
Fig.9: Horizon Interpretation
Fig.10: Interpreted fault sticks and wells.
From the observations, all the wells are
located within the fault assisted anticline
closures, this is an evidence from roll over
structures seen on the seismic sections;
which
is
a
typical
hydrocarbon
accumulation traps in Niger Delta.
DISCUSSION
The map of Niger Delta showing the
possible location of the study area and base
map of the study area is shown in (Fig. 1
and 2). The representative reservoir
structural analysis based on Geology and
Petrophysical properties was developed
using 3D seismic data and well log. The
lateral extent of Zulu oil reservoir was
delineated using seismic data while the
possibility of deriving its depth resolution
depended on the well logs.
Vertical discontinuity of the seismic
reflection was used to trace the fault plane
on inline and interpretation was done in
accordance with horizon delineated at
2,000ms (Fig. 4). The enthusiasm to obtain
a high resolution structural interpretation led
to reservoir delineation from the depth map
generated from the study area. Since the
total study area might not possess the
hydrocarbon potential structural style, it was
necessary to identify the potential areas; so
as to avoid abnormal well placement. The
100
Scientia Africana, Vol. 13 (No.2), December 2014. Pp92-101
© College of Natural and Applied Sciences, University of Port Harcourt, Printed in Nigeria
synthetic seismogram generated from the
well log was linked to correspond with
event of the seismic section; it was done by
considering
reflectivity trace being
differential acoustic impedance which when
moved down by greater wavelet, it looks
similar to reflectivity trace. As a result of
seismic shift caused by shallow event, the
seismic event shifted by not matching with
the synthetic. While comparing the seismic
and synthetic by matching up each loop,
static shift was applied to the synthetic so as
to match up with the seismic at Z1000-top
and Z1000-base of Zulu-01 well log. These
points form the formation top and base were
tied with the synthetic (Fig.3), the essence
was to provide more confidence in seismic
interpretation.
Analysis has shown that accurate structural
interpretation can be done in depth but not
only time alone. Contour map which shows
a two way time to a reflector as picked on
the seismic section can be converted to
depth map using the average velocity
(Olabode and Enikanselu, 2008). The
predicted average velocity away from the
wells were used to develop the time average
velocity map which was used to convert
Z1000-top to depth; the time structural map
(Isochron map) (Fig.5), was used to
generate depth structural map using the
velocity model. On the time map Z1000-top
was located at 2,000ms which is equivalent
to 7,777ft approximately 2,331.5m on the
isopach map (Fig.6 and 7). On the depth
structural map, Zulu -001 is located in a
closed contour; Zulu-003 touches the
contour enclosing Zulu-001 while Zulu-004
is a bit further from the contour. All the
reservoirs were delineated between 2,250m
and 2,375m; the wells are located within the
fault assisted anticlinal closures. This is
evident from roll over structures seen on the
ISSN 1118 - 1931
seismic
map,
which
exemplifies
hydrocarbon accumulation traps in Niger
Delta.
From seismic section as observed in (Fig.8),
reflectivity is some what clearer from the
beginning to 2,100ms. The amplitude of
reflectivity reduced from 2,100ms and got
blurred from 2,400ms to the end of the
seismic section. Considering lateral
reflection, we observe discontinuity of the
horizon at the fault boundary caused by the
weight of the overlying strata after the fault
push of the underlying downward strata;
vertical discontinuity of the reflectivity
depicts fault trends. Fault traces were traced
on the inline seismic section; the inline run
from North to South and give better
resolution of the fault trends. Interpretation
of faults was done by digitizing the fault
trends (Fig.10), this process used fault sticks
to pick the trends of the faults; there by
giving room for fault skeleton generation.
Although several faults were interpreted, but
three major faults are conspicuous (Fig. 8
and 10). From well to seismic tie, horizon
was identified at 2000ms of the line of the
seismic section; but picking of the horizon
was done on the cross line using the inter
section of the line and cross line since it
runs from East to West (Fig.9).
REFERENCES
Aizebeokhai, A.P and Olayinka, I (2011):
Structural and stratigraphic mapping
of Emi field, Offshore Niger Delta.
Journal of Geology and mining
Research vol. 3(2) pp 25-28.
Ajakaiye, D.E and Bally, A.W (2002):
Some structural styles on reflection
profiles from offshore Niger Delta.
Search and recovery article No. 10031
101
Ibe A. A. and Anyanwu J.: Structural Interpretation of “Zulu” Oil Field, Niger Delta.
AAPG continuing Education course
note series.
Alao, P.A; Olabode, S.C and Opeloye,
S.A (2013): Integration of seismic and
Petrophysics to characterize reservoirs
in “ALA” oil field Niger Delta.
Scientific World Journal, pp 1-15,
DOI:
10:1155/2013/421720
e:
collection.
Beka, F.T and Oti, M.N (1995): The distal
offshore Niger Delta:
frontier
prospects of a mature petroleum
province in Oti, M.N and Postma, G.
ed; Geology of Deltas: Rotterdam,
A.A. Balkema p237-241.
Coffen, J.A (1984): Interpreting seismic
Data. Perwell publishing company,
Tusla, Oklahoma p39-118.
Doust, H and Omatsola, E (1989): Niger
Delta: AAPG memoir 48 pp201-238.
Doust, H and Omatsola, E (1990): Passive
margin basins, Tusla. American
Association of Petroleum Geologists
memoir 48: pp239-248.
Ekine, A.S and Ibe, A.A (2013):
Delineation of Hydrocarbon bearing
reservoirs from surface seismic and
well log data (Nembe creek) in Niger
Delta oil field, IOSR Journal of
Applied Physics (IOSR-JAP) e-ISSN:
2278-4861. Volume 4, issue 3 pp2630.
Emujakporue, G.O and Ngwueke, M.L
(2013): Structural interpretation of
seismic data from XY field, Onshore
Niger Delta. Nigeria Journal of
Applied Sci. Environ Management
volume 17 (1) pp153-158.
Evamy, B.D; Haremboure, J; Kamerling,
P; Knaap, W.A; Molloy, F.A and
Rollands, P.H (1978): Hydrocarbon
habitant of tertiary Niger Delta:
American Association of Petroleum
Geologists Bulletin, volume 62,
pp277-298.
Isreal, C; Nicholas, C and Anthony, V
(2006): Detection and extraction of
fault surfaces in 3D seismic data:
Geophysics volume 17, pp21-27.
Martin, H; Le Heron, D.P; Dixon, R;
Redfern, J; Moscariello, A and
Crag,
J
(2012):
Glaciogenic
reservoirs and hydrocarbon systems:
An introduction, Geological Society,
London. Special publications, first
published November 19.
Michele, L.W; Tuttle, R; Charpentier, R
and Michael, E (2011): The Niger
Delta province, Nigeria, Cameroon,
and Equatorial Guinea. Africa central
Region Energy Resources Team.
Morgan, L.B and Dow, W.G (1994): The
petroleum system from source to trap
AAGP memoir 60.
Olabode, O.P and Enikanselu, P.A
(2008): Analysis of seismic TimeDepth conversion using Geostatiscally
derived average velocities over
“Labod” field Niger Delta, Nigeria.
Ozean Journal of Applied Sciences.
Onyeagoro, U.O (1998): Realistic fault
modeling of stacked Reservoir sands
in the Niger Delta. European
Petroleum conference, 20-22 October;
the Hague Netherlands. Society of
Petroleum Engineers.
Short, K.C and Stauble, A.J (1967):
Outline of Geology of Niger Delta:
American Association of Petroleum
Geologist Bulletin volume 51, pp761779.
© Copyright 2026 Paperzz