LC Paper No. CB(2)581/10-11
Legislative Council
of the
Hong Kong Special Administrative Region
Delegation of the
Panel on Food Safety and
Environmental Hygiene
Report on the duty visit to study
Japan's columbarium facilities
and fisheries industry
8 to 11 September 2010
TA B L E O F C O N T E N T S
Chapter
Page
1
Introduction
1–4
2
Columbarium facilities in Japan
5 – 11
3
Food safety in Japan
12 – 15
4
Fisheries Industry in Japan
16 – 33
5
Observations
34 – 38
Appendix
I
Programme of the visit
II
List of Government officials and representatives with
whom the delegation met
III
Reference materials obtained during the visit
Chapter 1 – Introduction
Purpose of report
1.1 A delegation of the Panel on Food Safety and Environmental
Hygiene of the Legislative Council visited Tokyo on 8 September 2010 to
obtain first-hand information on the operation and development of
columbarium facilities and measures to ensure food safety in Japan, and
visited Sapporo from 9 to 11 September 2010 to learn about the country's
ways to sustain its fisheries industry. This report presents the main
findings and observations of the delegation.
Background
1.2 The Panel on Food Safety and Environmental Hygiene is tasked to
monitor and examine Government policies and issues of public concern
relating to food safety, environmental hygiene and agriculture and
fisheries.
Columbarium facilities
1.3 With a growing and aging population in Hong Kong, the number of
deaths and the corresponding number of cremations have been rising
gradually year on year. According to the Administration, the annual
number of deaths is projected to increase from 43 700 in 2010 to 52 800
in 2020. The annual number of cremations will also rise from 39 200 in
2010 to 49 600 in 2020 correspondingly. With an increasing demand for
cremation service, there is an increasing need for the supply of niches.
1.4 At present, in addition to the columbarium facilities run by
non-government organisations (e.g. the Board of Management of Chinese
Permanent Cemeteries), religious entities and the private sector, there are
eight public columbaria managed by the Food and Environmental
Hygiene Department providing a total of some 167 900 public niches.
About 41 000 public niches will also be provided at the new columbarium
at Kiu Tau Road within the Wo Hop Shek Cemetery by the end of 2011 or
early 2012.
1.5 To address the growing need for niches, it is necessary for the
Administration to, amongst others, identify suitable locations for the
development of columbarium facilities in different areas in Hong Kong
(including urban area), such as by the construction of or conversion into
multi-storey columbarium blocks. These buildings only occupy a small
-
2
-
land area, and relieve people from travelling to remote places for paying
tribute to their ancestors. The Panel notes that there have been
successful experiences of overseas countries, such as Japan, in using
high-rise buildings as columbarium blocks.
Sustainable development of the local fisheries industry
1.6 The fisheries industry has a long history in Hong Kong and can be
categorised as capture fisheries and aquaculture fisheries. In capture
fisheries, there are currently about 3 700 fishing vessels in Hong Kong, of
which about 1 100 are trawlers while the remaining are mostly sampans
and small fishing boats engaged in inshore fishing. Hong Kong's fishing
fleet had a production of about 159 000 tonnes valued at approximately
$2 billion in 2009, supplying about 30% of the local consumption of
marine products. In aquaculture fisheries, there are about 1 000 holders
of marine fish culture licence operating in 26 designated fish culture
zones in Hong Kong. The production of marine fish culture in 2009 was
about 1 400 tonnes, amounting to about $92 million in value. As for
pond fish culture, the total area of fish ponds covers an area of about
1 000 hectares and are mainly located in Northeast New Territories.
Pond fish culture produced about 2 100 tonnes in 2009 with a total value
of approximately $35 million.
1.7 About 10 000 fishermen in Hong Kong are directly engaged in
capture and aquaculture fisheries, while about 8 000 Mainland deckhands
are employed to assist in operation in fishing vessels or fish farms.
1.8 As compared to the last century, the fisheries resources within the
traditional fishing grounds of Hong Kong's fishing fleet, namely local
waters and the South China Sea, have been beset with problems of
excessive fishing effort, marine pollution and marine works, leading to a
significant reduction in the quality and quantify of fish catch. Taking
into account the rise in operating costs, the fishermen's business has
become increasingly difficult, as is the case of capture fisheries around
the globe. The Committee on Sustainable Fisheries established by the
Government in 2006 to study the long-term direction and goals for the
development of the territory's fisheries industry, as well as feasible
strategies and options to promote its sustainable development, submitted
its report to the Government in April 2010. The report recommended a
number of proposals to take forward the following two major directions
for promoting the sustainable development of fisheries (a)
to assist fishermen to develop or switch to modernised and
sustainable practices; and
-
(b)
3
-
to protect, conserve and rehabilitate the marine ecosystem
and fisheries resources.
1.9 To enable members to grasp the latest development on provision of
columbarium facilities and promotion of sustainable fisheries and
facilitate their deliberations on the issues concerned, the Panel found it
worthwhile to make reference to overseas experience. The Panel asked
the Research and Library Services Division ("RLSD") of the Legislative
Council Secretariat to gather information on the columbarium facilities in
Tokyo and the fisheries industry in Hokkaido.
1.10 Having regard to the research findings of RLSD, members consider
it useful to visit Japan in early September 2010 to obtain first hand
information on the operation and development of the country's
columbarium facilities and ways to sustain its fisheries industry. While
in Japan, visits will also be made to the relevant authorities to learn about
the country's food traceability mechanism to safeguard food safety.
1.11 On 4 June 2010, the Panel on Food Safety and Environmental
Hygiene obtained the House Committee’s permission to undertake the
visit to Japan.
1.12 The delegation also paid a visit to the Ministry of Health, Labour
and Welfare during their stay in Tokyo to learn about the measures
adopted in Japan to ensure food safety.
Membership of the delegation
1.13 The delegation comprised the following Members Hon Fred LI Wah-ming, SBS, JP
(Panel Chairman and leader of the delegation)
Hon WONG Yung-kan, SBS, JP (Deputy Panel Chairman)
Hon CHAN Kam-lam, SBS, JP
Hon LAU Kong-wah, JP
Hon TAM Yiu-chung, GBS, JP
Hon LI Fung-ying, SBS, JP
Dr Hon Joseph LEE Kok-long, SBS,
Hon CHAN Hak-kan
Dr Hon LEUNG Ka-lau
1.14 Mary SO, Chief Council Secretary (2)5, and Theresa CHEUNG,
Senior Legislative Council Assistant (2)2, accompanied the delegation on
the visit.
-
4
-
Visit programme
1.15 The delegation visited Japan from 8 to 11 September 2010.
During the visit, the delegation received briefings by the Ministry of
Health, Labour and Welfare, the Hokkaido Federation of Fisheries
Cooperative Associations and the Hokkaido Fisheries Coordination
Office, Fisheries Agency as well as the Otaru Shi Fisheries Cooperative
Association. The delegation also visited the Tama Reien, Tokyo Gobyo,
the Gyoren Sogo Food Processing Factory, Sato Suisan Salmon Factory
and the Sapporo Central Wholesale Markets.
1.16 Further details of the visit programme are in Appendix I. A list
of the Government officials and representatives with whom the
delegation met is in Appendix II. A list of the reference materials
obtained during the visit is in Appendix III.
-
5
-
Chapter 2 – Columbarium facilities in Japan
Visit programme
2.1 The delegation visited the Ministry of Health, Labour and Welfare
("MHLW") and received a briefing on the development of columbarium
facilities in Japan. The delegation also visited Japan's first park-type
cemetery built by the Tokyo Metropolitan Government, namely, the Tama
Reien ( 多 磨 霊 園 ), and a mechanised columbarium operated by a
religious group, namely, the Tokyo Gobyo (東京御廟), and received
briefings on their operation. Tours were taken after the briefings to
observe the facilities at these cemetery and columbarium.
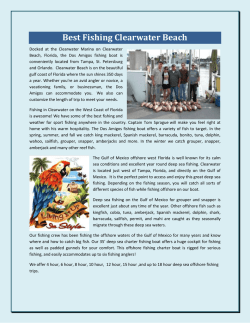
The delegation received a briefing from the Ministry of Health, Labour and Welfare
on the Japanese Government’s policy on columbarium development
in meeting public demand for columbarium facilities
Overview
2.2 Coupled with land scarcity, a steadily growing death rate resulting
from the aging of the baby-boom generation has led to a shortage of
burial space all over Japan. In major Japanese cities such as Tokyo, the
demand for grave plots is even higher as a result of the huge influx of
people into such cities over the years.
-
6
-
2.3 Due in part to the difficulty in securing burial plots in Japan's
densely populated urban areas, cremation has gained wide acceptance.
At present, the nationwide cremation rate in Japan is almost 100%.
2.4 Being the third smallest prefecture among Japan's 47 prefectures,
Tokyo is home to the largest population of around 13 million. As the
most populated city in Japan, the need for new graves in Tokyo each year
has far exceeded supply for the past two decades. For instance, in 2003,
a public sale of 50 burial plots at a cemetery, located at the heart of Tokyo
and operated by the Tokyo Metropolitan Government, attracted over
2 200 applicants. These burial plots varied in size from 1.6 to 3.65 sq m,
with prices ranging from 4.5 million yen to over 10 million yen. The
successful purchasers were winners of a lottery draw.
2.5 As described in a book published in 2005, only four out of the
eight graveyards operated by the Tokyo Metropolitan Government had
any openings. It also reported that the cremated remains (or ashes) of as
many as 1 million deceased in Tokyo were kept at home by families who
were unable to make suitable burial arrangements. Additionally, the
results of a survey conducted by the Tokyo Metropolitan Government in
2009 revealed that among the Tokyo residents interviewed, 41% did not
own a burial plot, and 61% would like to have one. In selecting a burial
plot, 76% of the respondents said that they would take into consideration
proximity and convenience of access.
Cremation and burial facilities in Japan
2.6 In Japan, the cremated remains of deceased persons may be buried
in a cemetery plot or placed in a niche within a columbarium.
According to law, only certain types of entities such as religious
corporations (宗 教 法 人 ), public corporations (公 益 法 人 ) and local
governments are allowed to operate burial and cremation services in
Japan. In particular, profit-seeking enterprises are not allowed to run a
graveyard. The following table shows the operators of graveyards and
columbaria in Japan in 2008 -
Graveyard
Columbarium
Individual
Religious
corporation
Local
public
entity
Others
686 107
58 127
33 065
107 402 884 701
Nil
7 302
893
3 562
Total
11 757
-
7
-
Alternative burial arrangements
Multi-storey columbaria
2.7 In Tokyo, some multi-storey columbaria have recently been built
within Buddhist temples or been converted from abandoned industrial
buildings. These columbaria are primarily managed by religious
corporations or private companies. A few of these multi-storey
columbaria have made use of mechanised facilities to reduce the storage
space per urn. In such a columbarium, instead of adhering to the
conventional practice of displaying all columbarium niches permanently,
ashes of the deceased are kept in urns on shelves in a vault. Visitors use
smart cards and computer facilities (e.g. a touch screen) to activate a
robotic arm to retrieve the correct urn and place it in one of the several
viewing areas for remembrance ceremonies. The viewing area may
come with a computer screen showing images of the deceased person and
other decorations, such as a floral background.
Natural burial
2.8 In Japan, natural burial (also known as green burial) has been
gaining popularity since the establishment of the Grave-Free Promotion
Society ("GFPS") in 1991, a civic group for promoting the scattering of
human ashes. In Japan, there is no law prohibiting the scattering of
human ashes. While the Law concerning Graveyards and Burial
(Article 4) states that remains of the deceased must be buried in a
cemetery, such prohibition applies only to conventional burials.
2.9 Natural burial in Japan mainly consists of scattering ashes at sea or
in the mountains. Natural burial services are offered by GFPS and a
number of companies, such as the JASDAQ-listed Sun Life Group.
Commercialised sea scattering services were first offered by the
Tokyo-based funeral company, Koueisha (公 営 社 ), established in 1994.
2.10 Charges for sea or mountain scattering offered by GFPS range
from 100,000 yen to 180,000 yen, plus a documentation fee of 2,000 yen.
Sea scattering services offered by Koueisha cost 283,500 yen for
individuals, and 105,000 yen per person for group ceremonies.
-
8
-
Legislation
2.11 Major legislation governing burial and cremation services and
facilities in Japan are (a)
City Planning Act (1968), which ensures that the
establishment or demolition of graveyards, crematoria and
columbaria is in accordance with the city development plan;
(b)
Land Readjustment Act (1954), which ensures that the
establishment or demolition of graveyards, crematoria and
columbaria is in accordance with the land readjustment
projects implemented in metropolitan regions; and
(c)
Law concerning Graveyards and Burial (1948), which
governs the management of graveyards, crematoria and
columbaria, as well as issues concerning interment.
Relevant authorities
2.12 At the central level, MHLW is responsible for the implementation
of the Law concerning Graveyards and Burial and the enforcement of
policies concerning the management of graveyards and related facilities.
MHLW also provides guidance to the heads of local governments to help
them carry out their duties in relevant areas.
Visit to the Tama Reien
2.13 Opened in April 1923, Tama Reien was built by the Tokyo
Metropolitan Government as Japan's first park-type cemetery. It was
originally known as "Tama Bochi" before being renamed "Tama Reien"
in 1935. In 1940, it was expanded from its original size of 1 million
sq m to 1.28 million sq m. Since then, Tama Reien has become the
largest metropolitan-operated cemetery in Japan and a model for the
construction of other Japanese cemetery parks.
2.14 In Tama Reien, burial space is kept below 50% of the total area of
the cemetery, so that the green coverage accounts for more than half of
the entire area. The cemetery is divided into 26 sections. Around
400 000 deceased are buried in Tama Reien, with some of them being
Japanese celebrities.
-
9
-
2.15 In 1993, a funnel-shaped columbarium was built within Tama
Reien to help alleviate the shortage of burial ground. This columbarium
provides 5 600 niches for the storage of 22 000 urns on a 30-year
renewable term. The niches are available in three different types for
storing two, four and six urns respectively. Further, some niche spaces
for temporary storage of 7 500 urns can be leased for a period of one year.
Such leases are renewable annually up to a maximum of five years.
Family members of the deceased are only allowed to enter the storage
area of the columbarium during the internment. Keys of the lockers
storing the urns are kept by the management. Lockers are not to be seen
from the central arena and no plaque is installed/displayed in front of the
urn/niche. A common incense burning is provided at the entrance of the
columbarium, as no incense burning is allowed inside the columbarium.
2.16 In 2010, 220 burial plots of 1.8 to 6 sq m are available for sale,
with prices ranging from 1,625,400 yen to 5,418,000 yen and annual
management fees from 1,200 yen to 3,600 yen. As regards niches, 60
niches are available in 2010 for a lease term of 30 years. Among these
niches, 50 are for storing four urns and 10 for storing two urns. A niche
for storing four urns costs 396,000 yen with an annual management fee of
4,200 yen, whereas a niche for storing two urn costs 297,000 yen with an
annual management fee of 3,150 yen.
The delegation toured the facilities at the Tama Reien
-
10
-
Delegation leader Hon Fred LI Wah-ming presented a souvenir to
Mr Ryoji IWASAKI, Manager, Management Office of the Tama Reien
Visit to the Tokyo Gobyo
2.17 Tokyo Gobyo, opened in July 2009, is a five-storey mechanised
columbarium operated by a religious corporation, the Machiya Komyoji
Temple. It is located near a train station and is open daily from 10 am to
7 pm. Tokyo Gobyo provides storage for up to 7 000 urns, comparing to
only 100 urns if these urns are placed in graveyards for the similar space.
Visitors use smart cards to activate a robotic arm to lift the urn from a
vault to one of the nine worship rooms. The shortest possible retrieval
time is 40 seconds. For additional fees, photos of the deceased and/or
videos showing the deceased can be displayed in the worship room.
2.18 Storage of urns at Tokyo Gobyo is permanent. An urn space for an
individual costs 380,000 yen, with an annual management fee of 8,000
yen, whereas a family urn space (for two deceased persons) costs 750,000
yen, with an annual management fee of 10,000 yen.
-
11
-
The delegation toured the facilities at the Tokyo Gobyo
Delegation leader Hon Fred LI Wah-ming presented a souvenir
to Mr Ryutoku OHORA, Chief Priest of the Tokyo Gobyo
-
12
-
Chapter 3 – Food safety in Japan
Visit programme
3.1 The delegation received a briefing by the Department of Food
Safety under the Pharmaceutical and Food Safety Bureau of MHLW on
measures to safeguard food safety in Japan.
Administration of food safety in Japan
3.2 The management of food safety in Japan is based on the Food
Safety Basic Law, the Food Sanitation Law, the Abattoir Law, the Poultry
Slaughtering Business Control, the Poultry Inspection Law and other
related laws.
3.3. The Food Safety Basic Law was enacted in 2003 in response to the
increasing public concern about food safety due to a number of food
incidents, such as outbreak of Bovine Spongiform Encephalopathy and
the false labelling scandals. The Food Safety Basic Law is a
comprehensive law to ensure food safety by establishing basic principles,
clarifying the roles and responsibilities of national and local governments,
food related businesses and consumers, as well as providing direction to
the formulation of food safety policies. This legislation introduced a
risk analysis approach to food safety, which consists of three key
elements, namely, risk assessment, risk management and risk
communication.
3.4 Specifically, risk assessment falls under the responsibility of the
Food Safety Commission, an independent agency established in the
Cabinet Office under the Food Safety Basic Law, whereas risk
management is handled by MHLW and the Ministry of Agriculture,
Forestry and Fisheries ("MAFF"). MHLW is responsible for setting
general requirements and standards applicable to all types of food,
whereas MAFF is involved in the risk management of agricultural,
livestock and fishery products with the main focus areas on food labelling
and protection of animal and plant health. Local government also plays
an important part in implementing risk management. The health centres
established under the health authorities in each jurisdiction are
responsible for issuing licences to food businesses within the jurisdiction
concerned, conducting inspection of food establishment and carrying out
tests on food.
-
13
-
3.5 Risk communication is conducted by both the risk assessment and
the risk management agencies. These agencies communicate with each
other on food safety issues, and provide interested parties, such as
consumers, with the relevant information.
3.6 The following table shows an outline of the administration of food
safety in Japan -
-
14
-
Handling of food poisoning in Japan
3.7 In 2009, there were 1 369 reported cases of food poisoning
involving 24 303 patients, including 4 deaths. The following tables
show the occurrence of food poisoning and the occurrence of food
poisoning by cause in Japan 2006
Food type
Cases
2007
Rate(%)
Cases
2008
Rate(%)
Cases
Rate(%)
1,491
100
1,289
100
1,369
100
80
5.4
68
5.3
106
7.7
8
0.5
22
1.7
15
1.1
71
4.8
83
6.4
96
7.0
Raw and processed eggs
7
0.5
8
0.6
10
0.7
Milk and processed milk
1
0.1
1
0.1
0
0.0
Cereal and processed cereal
26
1.7
22
1.7
23
1.7
Raw and processed vegetables
97
6.5
78
6.1
87
6.4
Confectionary
11
0.7
12
0.9
9
0.7
Composite cooked food
141
9.5
95
7.4
103
7.5
Others
582
39.0
547
42.4
531
38.8
Unknown
467
31.3
353
27.4
389
28.4
Total
Fish and seafood
Processed fish and seafood
Raw and processed meat, etc.
3.8 Government responses to food poisoning are depicted in the
following table -
-
15
-
3.9 In Japan, food business operators have the responsibilities to
ensure that the food they supply are fit for human consumption. Food
business operators refer to people engaging in the manufacturing,
importation, processing, marketing and selling of food. Under the Food
Sanitation Law, food business operators should endeavour to maintain
transaction records and implement measures, such as disposal of problem
food, expeditiously in the event of the occurrence of food poisoning. No
penalty will be imposed on food business operators for failing to carry out
the aforesaid acts. The Japanese government will not rule out making it
mandatory for food business operators to maintain transaction records if
the problem of food poisoning becomes more serious in future. The
following table shows the existing record-keeping by food business
operators to enable traceability in the event of the occurrence of food
poisoning -
-
16
-
Chapter 4 - Fisheries industry in Japan
Overview of the fisheries industry in Japan
4.1 In Japan, the fisheries industry contributed to less than 1% of the
Gross Domestic Product in 2007. The primary role of the fisheries
industry is to provide a stable supply of fishery products for domestic
consumption. Domestic production supported 62% of Japan's national
consumption of fishery products in 2007.
4.2 Fisheries production in Japan has dwindled since the late 1980s
due to a decline in the resources level of the Japanese fishing grounds and
Japan's withdrawal from the fishing grounds of neighbouring countries'
200-mile fishing zones. The total amount of fishery production was
5.59 million tons in 2008, comparing to 7.49 million tons in 1995. The
total value of fishery production was 1,627.5 billion yen in 2008, with
marine fisheries and marine aquaculture production accounting for 95%
of the production value.
4.3 Statistics on the structure of the fisheries industry in Japan are
summarised in the table below.
Total in Japan
Number of fishing ports
2 917
Number of fishery establishments
115 196
Number of persons engaged in the fisheries
industry
221 908
Number of powered fishing boats for marine
fisheries
289 456
Number of fisheries cooperative associations along
coastal areas
1 166
Fisheries policy
4.4 The Fisheries Agency, an affiliated agency under the Ministry of
Agriculture, Forestry and Fisheries, is responsible for the development
and implementation of the fishery policy in Japan. In order to address
the issues encountered by the Japanese fishery industry such as the
-
17
-
declining domestic production and the aging workforce, the Japanese
government enacted the Basic Law on Fisheries Policy in 2001 to provide
the policy guidelines for developing and stimulating/re-energising the
fishery industry. The major policy objectives are to secure a stable
supply of fishery products and to establish a sustainable and strong
fishery industry.
4.5 According to the Basic Law on Fisheries Policy, the government
formulated the Basic Fisheries Plan in 2002 and updated it in 2007 to lay
down the implementation programme of the policy. The Basic Fisheries
Plan covers the following key development directions (a)
promoting the recovery and sustainable management of
fishery resources that are at a low level;
(b)
enhancing competitiveness and productivity of the fishery
operators through the adoption of energy-saving fishery
operations and new business management approaches, and
attracting prospective participants through the provision of
information and training;
(c)
improving the sales and distribution channels of fishery
products to ensure the delivery of fresh and safe products to
consumers, and enhancing the value-added processing of
fishery products;
(d)
developing and diffusing new technology such as energy
conservation technology and technology to improve quality
of fishery products;
(e)
supporting the development of fishing ports and villages in
terms of improving their production capacity, infrastructure,
and living environment, and promoting ecosystem
conservation; and
(f)
promoting the re-organisation of fisheries cooperative
associations and related organisations.
Regulatory framework
4.6 In Japan, the government regulates the fisheries industry through
monitoring and controlling the total number and total gross tonnage of
fishing vessels engaged in the fishery industry with a vessel registration
-
18
-
system established under the Fishing Vessels Law (1949). In addition,
the government oversees the fishery operation by establishing the
following licensing/control systems under the Fisheries Law (1949) (a)
national licensing system for marine fishery operation on a
nation-wide scale or in international waters;
(b)
prefecture government licensing system for offshore marine
fishery operation beyond the coastal areas on a
regional/prefecture scale; and
(c)
fishery rights system for marine fishery and aquaculture
operation in coastal areas.
4.7 With regard to the fishery rights system, the prefecture
governments grant fishery rights to local fisheries cooperative
associations in coastal villages to conduct fishery operation at specified
coastal sea areas. Each fisheries cooperative association is responsible
for establishing regulations within the framework of national and
prefecture legislation for the management of fishery operation among its
members, and the rational exploitation and conservation of fishery
resources within the specified sea area. Under the system, fisheries
cooperative associations have high level of autonomy in determining the
division of access rights among members and developing fishery
management measures that are tailored to local conditions. In addition,
fisheries cooperative associations perform functions such as providing
credit facilities and equipment for members, and conducting marketing
and education activities. The Fisheries Cooperative Association Law
(1948) provides the legal framework for the organisation and
administration of fisheries cooperative associations.
4.8 In order to control and preserve the fishery resources within Japan's
exclusive economic zone, the government has introduced two control
systems on fishery activities under the Law on Preservation and Control
of Living Marine Resources (1996) (a)
total allowable catch system - setting the upper limits of
annual allowable catches for seven major fishery species,
namely, sardine, mackerel, jack mackerel, saury, Alaska
Pollock, common squid and snow crab; and
(b)
total allowable effort system - setting the upper limits on the
number of fishing days and the number of operating vessels
in a specific area within the exclusive economic zone.
-
19
-
4.9 Other relevant legislation that governs the fishery industries in
Japan includes (a)
Law on the Protection of Fishery Resources (1951) providing the legal framework for the conservation of
fishery resources in the coastal waters of Japan;
(b)
Law to Ensure Sustainable Aquaculture Production (1999) aiming to prevent self-induced environmental deterioration
around fish farms and the spread of fish diseases in order to
ensure sound and sustainable aquaculture production; and
(c)
Basic Law on Ocean Policy (2007) - aiming to promote the
development and use of ocean resources as well as
conservation of the marine environment.
Distribution and marketing of fisheries products
4.10 Fisheries products are distributed through a network of wholesale
markets in landing areas and in consumption areas. Wholesale markets
in consumption areas include central wholesale markets established by
the local governments and other local markets. In these wholesale
markets, fishery products from various landing areas are sold by auction
from the wholesale dealers to the intermediate wholesalers who will then
sell the products to stock purchasers for retail sales, or to the authorised
buyers who are agents for restaurants, food processing companies and
large retailers. There are over 50 central wholesale markets for fishery
products in Japan, of which the Tokyo Metropolitan (Tsukiji) Central
Wholesale Market is the largest.
4.11 As proposed in the Law Concerning Standardisation and Proper
Labelling of Agricultural and Forestry Products revised in 1999, the
government introduced a labelling system for fresh and processed food
products, including fishery products, in 2000 to provide consumers with
accurate product information for making informed choices. Under the
system, information including product name and description of fishing
area must be included on labels of fresh fishery products. For processed
fishery products, information including product name, ingredients, net
contents, use-by date, storage instruction and name and address of
manufacturer must be included on the labels.
-
20
-
4.12 In order to enhance the competitiveness of local agricultural and
fishery products, the government introduced a regional-based collective
trademark system in 2006. Under the system, a local fisheries
cooperative association can register a brand consisting of geographical
and product names as a regional organisation trademark if the brand is
known in multiple prefectures. As at March 2007, there were 18
registered regional organisation trademarks for fishery products in Japan.
Research and development
4.13 The Fisheries Research Agency ("FRA"), established in 2001 as an
independent administrative agency by consolidating nine former national
fisheries research institutes, is responsible for conducting a wide range of
research and development activities to support the national fishery policy.
FRA comprises the following research institutes and centres:
(a)
nine research institutes - responsible for conducting
comprehensive research on fisheries, among which the
Hokkaido National Fisheries Research Institute is
responsible for conducting research and development
activities related to physical and biological oceanography,
stock assessment of major fishery resources, and ecological
and genetic studies of coastal organisms for stock
enhancement at the subarctic region of the North Pacific
Ocean and the sea area around Hokkaido;
(b)
National Salmon Resources Center located in Hokkaido responsible for salmon hatching and release, stock
assessment and stock conservation of the salmon population;
(c)
Marine Fisheries Research and Development Centre responsible for developing technologies to improve
efficiency of fishery operation and to enhance sustainable
utilisation of marine fishery resources; and
(d)
National Centre for Stock Enhancement - responsible for
developing stable seed production techniques for fish and
shellfish, and stock enhancement techniques.
-
21
-
Overview of the fisheries industry in Hokkaido
4.14 Hokkaido, with a land area of 83 457 sq km, is the largest
prefecture of Japan. As at October 2008, Hokkaido had a population of
5.54 million, accounting for about 4% of the total population of Japan.
Hokkaido is surrounded by the Pacific Ocean, Sea of Okhotsk and Sea of
Japan with a coastline of 3 085 km, which is 9.1% of the country's
coastline.
4.15 In 2008, 14 780 fishery establishments were engaged in marine
fisheries and marine aquaculture in Hokkaido, down from 23 222 in 1988.
The marine fisheries and marine aquaculture activities engaged
33 568 employees in 2008, and most of them were males (86%) aged 40
or above (74%). The following set out the statistics on the structure of
the fishery industry in Hokkaido in 2008 Total in Japan
Percentage of
total in Japan
284
2 917
9.7%
Number of
fisheries
establishments
14 780
115 196
12.8%
Number of persons
engaged in the
fisheries industry
33 568
221 908
15.1%
Number of
powered fishing
boats for marine
fisheries
30 062
289 456
10.4%
77
1 166
6.6%
Hokkaido
Number of fishing
ports
Number of
fisheries
cooperative
associations along
coastal areas
4.16 In line with the overall trend in Japan, the fishery production of
Hokkaido has declined since the late 1980s. In 2008, the fisheries
production of Hokkaido was 1.474 million tons, contributing to around
26% of the total in Japan. The total value of fishery production,
accounting for only marine fisheries and marine aquaculture production,
-
22
-
was 295.8 billion yen, accounting for about 19.2% of the total in Japan.
The following table shows the statistics on the fisheries production of
Hokkaido by types of fishery activities in 2008 -
Marine fisheries
Marine aquaculture
Inland water fisheries
and inland
aquaculture
Total
Production volume
('000 tons)
Production value
(¥ billion (HK$
billion))
1 314
262.0 (19.80)
151
9
1 474
33.8
(2.56)
Not available
295.8
(22.36)
4.17 The top three types of fisheries products in terms of production
volume in 2008 were: scallop (30.4% of the total production volume),
Alaska pollack (13.6%) and Hokke fish (11.7%). The top three types of
fishery products in terms of production value were: salmon (21.2% of the
total production value), scallop (19.3%) and seaweed (9.4%). Scallop
was the main marine aquaculture product, accounting for 78% of the
production volume.
4.18 Propagation of fishery resources by re-stocking of fish seedlings is
commonly adopted by coastal fishery operators for management of the
fishery resources. Such activities contributed to around 37% of the total
fishery production in Hokkaido in 2008.
4.19 In 2008, 1 079 business establishments were engaged in the
processing of fishery products in Hokkaido, employing 32 726 persons.
The total production of processed fishery products in 2008 was 0.743
million tons, contributing to 19.1% of the total in Japan. The total value
of shipments was 700.2 billion yen, accounting for 20.6% of the total in
Japan.
4.20 As at March 2009, there were 1 530 registered establishments in
the recreational fishing business in Hokkaido, operating 1 675 fishing
boats. The government imposes control on the fishing areas, timing,
tools and methods of recreational fishing to protect the fishery resources
of Hokkaido.
-
23
-
Policy on promoting the fishery industry in Hokkaido
4.21 The recent downturn of the fishery industry in Hokkaido has been
affected by a number of factors such as the declining level of fishery
resources, decreasing domestic demand on fishery products, rising fuel
costs, decreasing number and aging of fishery workers, competition from
imported products and falling product prices.
4.22 In order to revive the fishery industry in Hokkaido, the Hokkaido
government enacted the Hokkaido Fishery Industry Promotion Act in
March 2002 and introduced the Fishery Industry Development Plan in
March 2003. Under the administration of the Department of Fisheries
and Forestry, the Development Plan aimed to revitalise the fishery
industry and provide stable domestic supply of safe and quality fishery
products. As specified in the Development Plan, the Hokkaido
government has targeted to increase the annual fishery production from
1.474 million tons in 2008 to 1.72 million tons in 2017.
4.23 The following key development directions were set in the Fishery
Industry Development Plan (a)
promoting proper management and use of fishery resources;
(b)
promoting aquaculture production by developing new
technology, improving production efficiency, and
strengthening facilities of the fisheries;
(c)
improving the management of fishery establishments and
enhancing their capital equipment to increase productivity;
(d)
strengthening the distribution and food safety monitoring
systems to ensure freshness and quality of fishery products;
(e)
enhancing competitiveness of Hokkaido fishery products in
the domestic and overseas markets;
(f)
promoting preservation of the ecosystem when developing
the fishery industry;
(g)
improving the environment and infrastructure of the fishing
villages;
(h)
promoting
industry;
technological
development
in
the
fishery
-
24
-
(i)
providing support to female and older workers in the fishery
industry and attracting young prospective workers to join the
industry; and
(j)
educating the public about the fishery industry and
stimulating their interest in fishery products.
The first phase of the Development Plan was introduced in March 2003
and the second phase in March 2008.
Visit programme
4.24 The delegation visited the Hokkaido Fisheries Coordination Office
of the Fisheries Agency, the Hokkaido Federation of Fisheries
Cooperative Associations and the Otaru shi Fisheries Cooperative
Association, and received briefings on the fisheries industry in Japan.
The delegation also visited the Gyoren Sogo Food Processing Factory and
the Sato Suisan Salmon Factory to understand their operation. Tours
were taken after the briefings to observe the facilities at these
establishments. Opportunity was also taken to visit the Sapporo Central
Wholesale Market to observe the auction of fisheries products.
Hokkaido Fisheries Coordination Office of the Fisheries Agency
4.25 The Fisheries Agency is an affiliated agency under the Ministry of
Agriculture, Forestry and Fisheries responsible for developing and
implementing fishery policies, regulating the fishery industry, and
managing the fishery resources and infrastructure in Japan. The
Fisheries Agency comprises the following departments (a)
Fisheries Policy Planning Department;
(b)
Resources Management Department;
(c)
Resources Enhancement Promotion Department; and
(d)
Fisheries Infrastructure Department.
-
25
-
The Hokkaido Fisheries Coordination Office is the local branch office of
the Fisheries Agency in Hokkaido. The major roles of the Office are (a)
ensuring smooth operation of the fishery industry in
Hokkaido;
(b)
regulating the operation of foreign fishing vessels in its
waters; and
(c)
promoting the conservation of fishery resources.
The Office comprises the following divisions (a)
Fisheries Management Division - responsible for regulating
fishery activities of the local and foreign fishing vessels;
(b)
Resources Division - responsible for managing and
conserving the marine fishery resources and authorising the
operation of marine fishing vessels; and
(c)
Administration Division - responsible for human resources,
accounting and general administration management.
The delegation received a briefing from Mr Masahiro MORITA,
Director General of the Hokkaido Fisheries Coordination Office, Fisheries Agency
-
26
-
Delegation leader Hon Fred LI Wah-ming presented a souvenir to Mr Masahiro MORITA,
Director General of the Hokkaido Fisheries Coordination Office, Fisheries Agency.
Hokkaido Federation of Fisheries Cooperative Associations
4.26 The Hokkaido Federation of Fisheries Cooperative Associations
was established by fishermen in 1949 to promote the livelihood of
fisheries in Hokkaido. As at 1 April 2010, the Federation had 82
members and was supported by 338 employees.
4.27 The Hokkaido Federation of Fisheries Cooperative Associations
has 16 offices and 10 subsidiary companies. The major business
activities of the Federation include (a)
sales and marketing of fisheries products;
(b)
sourcing fuels and materials for members to reduce their
operating costs;
(c)
operating fisheries product processing plants;
(d)
advising members on conservation and management of
fishery resources and issues related to their fishery operation;
and
(e)
conducting education activities for members and consumers.
-
27
-
The delegation received a briefing from Mr Takashi OGURA,
Executive Managing Director of the Hokkaido Federation of Fisheries Cooperative Associations
Delegation leader Hon Fred LI Wah-ming presented a souvenir to Mr Takashi OGURA,
Executive Managing Director of the Hokkaido Federation of Fisheries Cooperative Associations
Otaru shi Fisheries Cooperative Association
4.28 The Otaru shi Fisheries Cooperative Association was established
by fishermen in 1949 to promote the livelihood of fishermen in Otaru shi.
As at 2007, the Otaru shi Fisheries Cooperative Association had
219 members and was supported by 38 employees. The Otaru shi
Fisheries Cooperative Association comprises the following divisions (a)
Administration Division;
(b)
Credit Division;
-
28
-
(c)
Consulting and Mutual Aid Division;
(d)
Marketing Division; and
(e)
Refrigeration Division.
Key activities of the Otaru shi Fisheries Cooperative Association include
(a)
providing credit facilities and financial assistance to
members;
(b)
acquiring fishery equipment for members;
(c)
operating a wholesale market;
(d)
operating refrigeration business; and
(e)
advising members on management of fishery resources and
other issues related to their fishery operation.
The delegation met with the representatives of
the Otaru shi Fisheries Cooperative Association
Delegation leader Hon Fred LI Wah-ming
presented a souvenir to Mr Takeshi IWAKI,
Representative Director cum Union Leader of
the Otaru shi Fisheries Cooperative Association
-
29
-
Gyoren Sogo Food Processing Factory
4.29
The Gyoren Sogo Food Processing Factory was established in
1995. It is a subsidiary of the Hokkaido Federation of Fisheries
Cooperative Associations. The company is primarily engaged in the
manufacture and sale of seafood products. Major products include a
wide range of frozen (uncooked, semi-cooked, fried and pickled in soy
sauce) and dried seafood, such as salmon fillets, squid, octopus, scallops
and various types of fish. At present, the company has a total of 220
employees. Its annual sales as at March 2010 were around 4.2 billion
yen.
The delegation received a briefing from
Mr Shoichi NARITA, President of Gyoren Sogo
Food Processing Factory
Delegation leader Hon Fred LI Wah-ming
presented a souvenir to Mr Shoichi NARITA,
President of Gyoren Sogo Food
Processing Factory
-
30
-
The delegation toured the Gyoren Sogo Food Processing Factory
Sato Suisan Company Limited
4.30
The Sato Suisan Company Limited was established in 1948. In
2010, it has 217 full-time employees and 53 part-time employees. The
company is primarily engaged in the manufacture and sale of seafood
products. It started in 1954 to operate the salmon processing plant in
Ishikari, primarily producing frozen salmon products. The head office is
located in Sapporo, with several branch offices established in other cities,
such as Tokyo, Chitose and Ishikari. The Sato Suisan Company Limited
has over 300 kinds of seafood products distributed through various
channels, including direct sales channels, web sales and operation of
restaurants. Its annual sales as at January 2010 were around 7 billion
yen.
-
31
-
The delegation toured the Sato Suisan Salmon Factory
Delegation leader Hon Fred LI Wah-ming
presented a souvenir to Mr Shouichi NAKASE,
Acting Manager of Sato Suisan Salmon Factory
Group photo of the delegation at the
Sato Suisan Salmon Factory
-
32
-
Sapporo Central Wholesale Market
4.31 The Sapporo Central Wholesale Market, a public wholesale market
established by the City of Sapporo in 1959, has been the leading market
for distribution of perishable goods in Hokkaido. The major functions
of the Sapporo Central Wholesale Market are in (a)
collecting and distributing perishable products efficiently
and cost-effectively;
(b)
ensuring that the products are sold at fair prices through the
auction mechanism;
(c)
providing accurate and updated market and pricing
information; and
(d)
conducting regular hygiene inspection of the goods by the
Health Inspection Office of the Central Wholesale Market.
4.32 The Central Wholesale Market comprises the fruit and vegetable
section and the marine product section. Fisheries products from various
landing areas are sold by auction from wholesale dealers to intermediate
wholesalers who will then sell the products to buyers or retailers for retail
sales, or to authorised buyers who are agents for retailers or supermarkets.
Wholesale dealers charge a commission on the value of products sold.
In 2009, the Sapporo Central Wholesale Market handled a total volume of
122 176 tons of fisheries products, of which 39.6% were fresh fisheries
products, 37.7% were frozen fishery products and 22.7% were processed
products. The value of fisheries products handled was 101 billion yen.
The value by product was fresh (38.3%), frozen (34.6%) and processed
fishery products (27.1%) respectively.
Group photo of the delegation at the Sapporo
Central Wholesale Market
The delegation received a briefing
from the representative of
Sapporo Central Wholesale Market
-
33
-
The delegation toured the Sapporo Central Wholesale Market
-
34
-
Chapter 5 – Observations
General
5.1 The delegation is of the view that the information obtained during
the visit on columbarium facilities, food safety measures and sustainable
fisheries has provided useful reference for Hong Kong.
The
observations of the delegation are given in the following paragraphs.
Columbarium facilities in Japan
5.2 The delegation notes that the cremation rate in Japan is close to
100%. The cremains of the deceased may be buried in a cemetery plot
or placed in a niche within a columbarium. With a growing ageing
population, Japan is facing shortage of burial space.
5.3 The delegation has noted that although there are legislation
governing burial and cremation services and facilities in Japan, the
Japanese government does not have a central policy on the provision of
columbarium facilities to meet overall public demand in the country.
The job of doing so, including issuance of licences, is under the purview
of the local governments.
5.4 The delegation has observed that similar to Hong Kong and
elsewhere, Japan has local community resistance and reluctance to have
columbarium facilities in their districts. It is the usual practice of the
local governments to first obtain the consent of the local people before
giving the green light to the construction of columbarium facilities in the
districts. The delegation has further observed that the Japanese
government no longer issues licences to individuals for operating
graveyards, albeit the transferability of the licence to the immediate
family member of a deceased licensee.
5.5 The delegation has noted that the price of purchasing a niche in
Japan is in general 30% to 40% less expensive than the price of
purchasing a burial plot. The delegation has further noted that a burial
plot, mainly bought for use by a family unit, can usually accommodate up
to four urns.
-
35
-
5.6 Members are highly impressed by the mechanised multi-storey
columbarium operated by the Tokyo Gobyo which not only saves space
but can also have a retrieval time of as short as 40 seconds. Members
are also impressed by the design of the Tokyo Gobyo which has minimal
visual impact and nuisance to neighbouring residents.
5.7 Members are also highly impressed by the architecture of the
columbarium at the Tama Reien which is very solemn on the one hand
and peaceful on the other.
5.8 The delegation has noted that some non-governmental
organisations in Japan are actively promoting alternative means of
handling cremains. The Japanese government allows scattering of
cremains at sea in designated areas chosen to minimise impact to the
environment and people.
Food safety measures in Japan
5.9 The delegation has found the measures adopted by the Japanese
government in safeguarding food safety to be very comprehensive and on
par with standards adopted in other developed countries.
5.10 Members also find the legislation governing the supply of food
intended for human consumption in Japan very comprehensive, although
members note that at present there is no law requiring food traders to
keep and maintain transaction records to enhance traceability in the event
of a food incident.
5.11 Members have noted that with growing concern about food safety
by the Japanese public, Japan has introduced a risk analysis approach to
its food safety work. Apart from the central government, local
governments also play an important role in safeguarding food safety.
Notably, local governments conduct inspection of and give advice to food
businesses, grant licences to food businesses that operate within the
jurisdiction concerned and suspend/revoke licences for violation of the
law, and conduct food testing. These activities are executed through
health centres under the jurisdiction concerned. Imported foods are
inspected by 31 quarantine stations placed across Japan under the central
government.
-
36
-
Fisheries industry in Japan
5.12 The delegation notes that Japanese fisheries can be divided into
three main types, namely, distant-water fisheries, offshore fisheries and
coastal fisheries. Whilst capture from coastal fisheries has remained
relatively stable, capture from distant-water and off-shore fisheries has
been on the decline due to overfishing and more stringent international
obligations on distant fisheries operation. Annual fisheries production,
including marine aquaculture, reached its peak at 1 282 million tonnes in
1984 and dropped over the years to 559 million tonnes in 2008.
5.13 To tackle the declining fish stocks, the Japanese government has
been implementing the Total Allowable Catch ("TAC") system since
1997 and the Total Allowable Effort ("TAE") system since 2002. Under
the TAC system, fishing for specific fish species would be banned if an
annual quota is exceeded. Under the TAE system, restrictions are set on
the number of days for fishing certain fish species. Other resource
recovery plans include reducing the sizes of offshore fishing fleets,
implementing fishing moratorium, designating no trawl zones,
encouraging coastal fishermen to switch to other operations, and
conducting restocking programmes. As of March 2009, 49 resource
recovery plans involving 74 fish species are being implemented or
worked out. Fishermen were consulted in the formulation of the
resource recovery plans.
5.14 The central and prefecture governments regulate fishing efforts in
terms of fishing method, gear use, fishing seasons and other technical
measures, whereas the basis for the management of coastal fisheries is
through the implementation of a fishing right system. The right to fish
is granted by the prefecture government to the local fishermen
cooperative associations with responsibility for a particular geographical
area and whose membership are fishermen from communities within the
area. The rights granted to the fishermen cooperative associations are
exclusive but the rights cannot be transferred to others and only members
of the associations can fish in the area where the right is applicable.
5.15 Members have observed that fishermen cooperative associations
play a pivotal role in promoting the sustainable development of fisheries
industry in Japan. For instance, some of the major activities of the
Hokkaido Federation of Fisheries Cooperative Associations are to
promote local fisheries product trade, operate fisheries product processing
plants, such as the Gyoren Sogo Food Processing Factory, to produce
more high value-added products, and advising fishermen on conservation
and management of marine resources.
The Otaru shi Fisheries
-
37
-
Cooperative Association also provides credit facility to fishermen in
financial needs.
5.16 Members have also observed that it is the established practice for
members of the fishermen cooperative associations to sell their fisheries
capture to the fishermen cooperative associations to which they belong.
A fee would be levied by the fishermen cooperative associations on those
fishermen who sold their fisheries capture to another party.
5.17 The delegation notes the following measures taken by the Japanese
government to cope with the fuel costs which have risen 160% over the
past five years (a)
subsidising 90% of the increase in fuel costs if the fishermen
can demonstrate that they have cut fuel consumption by 10%
or more;
(b)
offering interest-free loans to fishermen to switch to more
energy saving fishing vessels; and
(c)
encouraging group operations by fishermen.
A set of “New Management Stabilization Measures” has also been
introduced in 2008 to mitigate relatively light revenue decreases not
covered by the current fishery mutual aid insurance. In 2005, fishing
income per coastal fishing household was 5.27 million yen, compared
with 6.27 million yen for the national average.
5.18. Global warming has reduced the capture of fisheries products, for
example, pacific saury in 2010. The Japanese government is assessing
the effects of global warming on the fisheries industry and exploring
measures to counter such effects.
5.19 The delegation notes that some 40% of the fisheries products in
Japan are imported, due to the consumers' inclination for less expensive
imported seafood, such as salmon fillet and tuna fillet, which are also
easier to cook. Efforts are being made by the Japanese government to
reduce imported fisheries products to 35% by 2019.
5.20 Members have found that as at 2007, the fishing population in
Japan stood at 204 000, of whom those over 65 years old accounted for
37.4%. On the other hand, the number of newcomers was only 1 514 in
2003 and 1 784 in 2008. In order to attract more people to become
fishermen, on-going efforts are made to attract and assist interested
-
38
-
parties to join the fisheries industry though job seminars, on-the-job
training and subsidy.
5.21 Members note that the development of recreational fisheries in
Japan has helped to offer greater opportunities for fishermen to switch to
other modes of operation and/or boost their income.
5.22 Members have found the operation of the Gyoren Sogo Food
Processing Factory and the Sato Suisan Salmon Factory very efficient and
well-run. In particular, members are particularly impressed by the wide
variety of food products processed from fisheries products. Members
also find the hygiene standards of these factories to be of a very high
standard.
5.23 Members are impressed by the large trade volume and wide range
of foods and facilities in Sapporo Central Wholesale Market. Members
have noted that while the Market is mainly financed by shop rental and
auction commission, it also receives subsidies from local government.
Conclusion
5.24 The delegation has found the visit to Japan very enlightening and
useful. The detailed briefings and exchange of views between the
delegation and the officials and executives in Japan have provided useful
reference when Members consider the Government’s proposals for
regulating columbarium facilities, promoting sustainable fisheries and
safeguarding food safety in Hong Kong.
Council Business Division 2
Legislative Council Secretariat
16 December 2010
Appendix I
Panel on Food Safety and Environmental Hygiene
Duty visit to Japan
(8 to 11 September 2010)
Visit programme
Wednesday, 8 September 2010
10:00 am – 12:00
noon
2:00 pm – 3:30 pm
Visit to the Ministry of Health, Labour and
Welfare
-
Briefing on food safety surveillance system
and countermeasures against food poisoning
by Mr Ryuusuke MATSUOKA, Deputy
Director, Inspection and Safety Division,
Department of Food Safety, Pharmaceutical
and Food Safety Bureau
-
Briefing on Japanese Government’s policy on
columbarium development in meeting public
demand for columbarium facilities by Mr.
Yukio
OKUDA,
Deputy
Director,
Environmental Health Division, Health
Service Bureau
Visit to the Tama Reien
-
4:30 pm – 5:30 pm
Briefing on columbaria facilities in Japan by
Mr Ryoji IWASAKI, Manager, Management
Office of the Tama Reien
Visit to the Tokyo Gobyo
-
Briefing on private multi-storey columbaria
in Japan by Mr Ryutoku OHORA, Chief
Priest
- 2 -
Thursday, 9 September 2010
1:30 pm – 2:00 pm
Visit to the Hokkaido Federation of Fisheries
Cooperative Associations
-
2:40 pm – 3:30 pm
Visit to the Gyoren Sogo Food Processing
Factory
-
4:00 pm – 5:00 pm
Briefing on the establishment by Mr Takashi
OGURA, Executive Managing Director and
Mr Kazuharu IZAWA, Councilor
Briefing on the operation of the establishment
by Mr Shoichi NARITA, President and
Mr Takashi HARADA, Vice President
Visit to the Sato Suisan Salmon Factory
-
Briefing on the operation of the establishment
by Mr Shouichi NAKASE, Acting Manager
Friday, 10 September 2010
9:30 am – 11:30 am
Visit to the Hokkaido Fisheries Coordination
Office, Fisheries Agency
-
2:30 pm – 3:30 pm
Briefing on supporting mechanism for fishing
industries by Mr Masahiro MORITA,
Director General
Otaru Shi Fisheries Cooperative Association
-
Briefing on the operation of the establishment
by Mr Takeshi IWAKI, Representative
Director cum Union Leader
- 3 -
Saturday, 11 September 2010
5:00 am – 7:00 am
Visit to the Sapporo Central Wholesale
Market
-
Briefing on the set up and operation of a
typical seafood market in Hokkaido by
Mr Tetsuya SASAKI, Chief, Sapporo Central
Wholesale
Market
Business
Section,
Economic
Bureau,
Sapporo
City
Government, Ms Masami TAKA and Ms
Mayumi NOGAMI from The Corporation of
Sapporo
Central
Wholesale
Market
Association
Appendix II
List of Government officials and
representatives with whom the delegation met
Ministry of Health, Labour and Welfare
Mr Ryuusuke MATSUOKA, Deputy Director,
Inspection and Safety Division, Department of Food Safety,
Pharmaceutical and Food Safety Bureau
Mr. Yukio OKUDA, Deputy Director,
Environmental Health Division, Health Service Bureau
Tama Reien
Mr Ryoji IWASAKI, Manager, Management Office of the Tama Reien
Tokyo Gobyo
Mr Ryutoku OHORA, Chief Priest
Hokkaido Federation of Fisheries Cooperative Associations
Mr Takashi OGURA, Executive Managing Director
Mr Kazuharu IZAWA, Councilor
Gyoren Sogo Food Processing Factory
Mr Shoichi NARITA, President
Mr Takashi HARADA, Vice President
Sato Suisan Salmon Factory
Mr Shouichi NAKASE, Acting Manager
Hokkaido Fisheries Coordination Office, Fisheries Agency
Mr Masahiro MORITA, Director General
Mr Sei YAMASAKI, Director, General Affairs
Mr Ryuji SAWADA, Director Resource Management
Mr Masateru ITO, Enforcement Officer
Mr Kouji KUMAGAI, Chief, Resource Management
Otaru shi Fisheries Cooperative Association
Mr Takeshi IWAKI, Representative Director cum Union Leader
Mr Yasuo SAKAMOTO, Senior Executive Director
Mr Noboru NAKAYAMA, Councilor
Ms Hitomi KIMURA, Chief, Administration Division
Sapporo Central Wholesale Market
Mr Tetsuya SASAKI, Chief, Sapporo Central Wholesale Market Business
Section, Economic Bureau, Sapporo City Government
Ms Masami TAKA, The Corporation of Sapporo Central Wholesale
Market Association
Ms Mayumi NOGAMI, The Corporation of Sapporo Central Wholesale
Market Association
Appendix III
Reference materials obtained during the visit
Information pamphlet entitled “Visual Japan's Fisheries” provided by the
Fisheries Agency of the Ministry of Agriculture, Forestry and Fisheries
Information pamphlet entitled “Fisheries in Hokkaido 2010” published by
the Department of Fisheries and Forestry, Hokkaido Government
Information pamphlet on Japanese seafood exports published by the
Ministry of Agriculture, Forestry and Fisheries
Information sheets on the facilities of the Tokyo Gobyo
Powerpoint materials on food safety surveillance system and
countermeasures against food poisoning provided by the Department of
Food Safety of the Pharmaceutical and Food Safety Bureau of the
Ministry of Health, Labour and Welfare
Information pamphlet on the Sapporo Central Wholesale Market
Contents
1. The State of Fisheries in Japan and the World
Where Does the Seafood in Sushi Come from?
Why Does Japan Import Massive Seafood?
Can Japan Continue to Import Massive Seafood?
1
3
5
2. What’s Going on in the Seas Around Japan Now?
What Is Japan Doing to Increase Benefits from the Seas through
Proper Conservation and Management of the Seas?
What Is Japan Doing to Improve the Marine Environment?
How Many People Are Fishing in Japan? How Have Fuel
Price Hikes Affected Fishing?
What Is Japan Doing for Fishermen Capacity Building and for
Competitive Fisheries Industry Building?
How Is Seafood Treated before Becoming Available for Eating?
8
12
14
16
19
3. Getting Familiar with Seas and Fish to Conserve Bountiful Seas
Why Is It Good to Eat Fish?
What Fish Are Good for Eating?
What Can We Do In Addition to Eating Fish?
21
23
24
Herring
Japanese sardine
Round herring
These belong to
the same family
as sardines!
Gizzard shad
Anchovy
[Sources for illustrations and photos (in the page order)]
Sakanakun (Anan International); Japan Fisheries Association; Fisheries Research Agency; National Fisherman Recruiting and Training Center
(tentative translation); Irabu branch, Miyakojima, Okinawa Prefecture; Kochi Prefecture; Asahi Shimbun; Institute of Cetacean Research;
National Federation of Fisheries Cooperative Associations; Banzu Satoumi-No-Kai (Nonprofit Organization); Marine Foods Corp.; National
Association of Saury Fishery; Kushiro Shi Fisheries Cooperative Association; Shimonyuzu Branch, Oita Fisheries Cooperative Association;
Kanagawa Prefectural Fisheries Technology Center; Sakana-kun (Entertainer, Illustrator)
٬͈ࠃ͙
1 The State of Fisheries in Japan and the World
Where Does the Seafood in Sushi Come from?
Seafood for sushi is imported from all around the world
Let’s look at imports of fish for nigiri sushi as a favorite for Japanese people. Seafood for sushi includes
imports from abroad as well as domestic products.
Percentages of Japan’s Production and Imports (2007)
Korea, etc.
1䋦
Norway
6䋦
Russia
5䋦
Amberjack
Others
25Ჟ
Tuna
China
6Ჟ
Korea
9Ჟ Taiwan
15Ჟ
Japan
45Ჟ
Others
5䋦
Japan
Salmon/trout 60䋦
Japan
99䋦
Tuna
Chile
25䋦
Amberjack
Salmon
Others
Vietnam 14䋦
4䋦
Thailand Squid
7䋦
China
11䋦
Squid
Jack
mackerel
Shrimp
Japan
5䋦 Vietnam
17䋦
Japan
64䋦
Others
51䋦
Shrimp
Indonesia
16䋦
India
12䋦
Source: Fisheries Agency
1
Korea
3䋦 Others
Norway
10䋦
5䋦
Jack
Netherlands mackerel
7䋦
Japan
75䋦
Japan as a Big Seafood Importer
Although Japan’s seafood imports have tended to decrease over recent years, Japan is the world’s second largest seafood
importer after China.
Changes in Japan’s Seafood Import Volume and Value
Value
Volume
(1,000 tons for volume, 㪳100 million for value)
㪈㪐㪎㪌
㪎㪈㪇
㪈㪈㪋
㪈㪇㪇
㪎
㪈㪇
㪊㪃㪏㪌㪌
㪈㪃㪊㪎㪌
㪊㪏㪊
㪌㪏
㪋㪏
Total
Shrimp
Tuna/Marlin
Salmon/trout
Crab
Total
Shrimp
Tuna/Marlin
Salmon/trout
Crab
㪈㪐㪏㪌
㪈㪃㪌㪎㪎
㪈㪐㪉
㪈㪌㪈
㪈㪈㪍
㪊㪋
㪈㪈㪃㪎㪍㪇
㪊㪃㪊㪌㪍
㪏㪍㪇
㪈㪃㪈㪍㪍
㪊㪊㪌
㪈㪐㪐㪎
㪊㪃㪋㪈㪈
㪉㪏㪉
㪉㪏㪇
㪉㪇㪐
㪈㪉㪋
㪈㪐㪃㪋㪌㪍
㪊㪃㪐㪊㪇
㪉㪃㪇㪊㪋
㪈㪃㪈㪏㪐
㪈㪃㪇㪏㪐
㪉㪇㪇㪌
㪊㪃㪊㪋㪊
㪉㪋㪉
㪊㪊㪎
㪉㪉㪌
㪐㪐
㪈㪍㪃㪍㪐㪈
㪉㪃㪊㪌㪉
㪉㪃㪈㪐㪇
㪈㪃㪇㪐㪌
㪍㪐㪋
㪉㪇㪇㪍
㪊㪃㪈㪌㪋
㪉㪊㪏
㪉㪏㪎
㪉㪇㪉
㪐㪌
㪈㪎㪃㪇㪎㪋
㪉㪃㪋㪏㪇
㪉㪃㪊㪉㪍
㪈㪃㪇㪎㪇
㪍㪐㪎
㪉㪇㪇㪎
㪉㪃㪏㪐㪉
㪉㪈㪌
㪉㪋㪎
㪉㪊㪏
㪎㪌
㪈㪍㪃㪊㪎㪊
㪉㪃㪉㪌㪐
㪉㪃㪈㪐㪇
㪈㪃㪋㪉㪈
㪍㪌㪏
Source: Created based on “Japan Trade Statistics,” Ministry of Finance
Note: Salmon/trout imports in 2007 included "salmon fillet (frozen)" for the first time and lost continuity with the past data.
ᾣ
ᾞ
ᾟ
ᾘ
ᾒ
%
18.0
ὲ
Shares of World Seafood Trade
China (2006)
10.4䋦
16.0
China becomes largest seafood importer in
the world
Japan’s share of world seafood trade in volume declined from 16% in
1996 to 10% in 2006.
In 2005, China replaced Japan as the world’s largest seafood importer
in volume through a substantial increase in fishmeal purchases as well as
cod and salmon imports for processing into exports.
14.0
12.0
10.0
Japanese share
Chinese share
8.0
Japan (2006)
9.9䋦
6.0
4.0
2.0
0.0
Source: “Fishstat,” FAO (Fisheries Commodities production and trade 1976-2006)
1985
1990
1995
2000
2005
Japan’s self-sufficiency rate of seafood for human consumption stands at 62%
Japan’s self-sufficiency rate of seafood for human consumption declined after peaking at 113% in 1964. Over recent years,
the rate has ceased the downtrend and posted a small rise. But Japan still depends on imports for some 40% of fishery product
supply.
Changes in Self-sufficiency Rate of Seafood for Human Consumption
䋦
140
Self-sufficiency rate
Seafood supplied
for human consumption
1,400
1,200
2007 (estimate)
Self-sufficiency rate
at 62%
1964
Self-sufficiency rate
peaked at 113%
1,000
120
100
80
60
40
800
20
Imports
600
0
-20
400
-40
Domestic production
200
-60
0
-80
1960
1965
1970
1975
1980
1985
1990
Source: “Food Balance Sheets,” Ministry of Agriculture, Forestry and Fisheries
2
1995
2000
2005 2007
Self-sufficiency rate of seafood
for human consumption
1,600 tons)
(10,000
Why Does Japan Import Massive Seafood?
Domestic demand for seafood has been so strong despite a limit on domestic
production
There are mainly three reasons for Japan’s mass seafood import. First, as tougher international regulations have forced to
reduce Japan’s production through distant water fishery operations since around 1985, Japan’s fishery imports have increased fast
to make up for the decline. An increase in consumption of tuna and shrimp despite their limited domestic production since
around 1989 and Japanese consumers’ shift from domestic products to imports including salmon have also contributed to the fast
increase in Japan’s fishery product imports.
Changes in Household Purchases (1 for 1965)
2.0
䉰䉬
Salmon
Increased
purchases
䊙䉫䊨
Tuna
1.5
䉣䊎
Shrimp
1.0
䉟䉦
Squid
Decreased
purchases
0.5
Jack 䉝䉳
mackerel
0.0
ᤘ.40
1965
45
1970
50
1975
55
1980
60
1985
ᐔ.2
1990
7
1995
12
2000
18
2006
Year
Source: Prepared by the Fisheries Agency based on “Annual Report on the Family Income
and Expenditure Survey,” Ministry of Internal Affairs and Communications
Behind fast import growth has been consumers’ inclination toward “lower prices”
and “easiness”
Since the burst of economic bubbles, consumers have growingly been inclined toward lower prices. An increase in doubleincome and single-person households has led to consumers’ inclination toward simplification. As a result, consumption of squid
and jack mackerel has apparently decreased, which are rather difficult to cook, and consumption increased for salmon fillet,
tuna fillet and other fishery products that are easier to cook.
A recent dining table
A dining table seen some 40 years ago
3
Easiness meeting consumer needs has accelerated changes
Large retailers have begun to sell mainly easier-to-cook products and large-lot imports for mass distribution to
meet consumer needs.
Import growth has led to slacking prices for domestic fishery products and Japan’s fishery productivity decline
on a fierce fishing competition affecting the resilience of fish resources.
As a result, opportunities have declined for consumers to taste a variety of fishery products produced in
waters surrounding Japan, accelerating their shift away from fish.
Per capita daily fish and meat intake changes
g/person-day
110
100
97
Meat intake exceeds
fish intake
98.2
95.9
94.3
92
94
88.2
90
86.7
82.6
84
80.2
80
80.3
70
77.9
77.5
78.4
78.2
76.3
77.5
2001
2002
76.9
77.9
80.2
80.4
2004
2005
2006
Fish
60
Meat
50
1996
1997
1998
1999
2000
2003
Source: “National Health/Nutrition Survey Report,” Ministry of Health, Labor and
Welfare
Japan has imported fishery products from throughout the world on
dietary pattern changes. Consumers have accelerated their shift away
from fish.
4
Can Japan Continue to Import Massive Seafood?
Fish consumption has been increasing throughout the world
While a shift away from fish has accelerated in Japan, the world’s seafood consumption has increased on
growth of health-conscious people in Western countries and China’s rapid economic development.
Changes in Supply of Fishery Products by Major Countries
(10,000 tons)
(10,000 tons)
EU
China
Japan
Whole
world
U.S.A.
China
enlarged
India
Sources: "Food Balance Sheets," FAO; "Food Balance Sheets," Ministry of Agriculture, Forestry and Fisheries
Per capita annual consumption of seafood has grown fast. Growth in 30 years between 1973 and 2003 was as
high as 1.5-fold in the United States, 1.1-fold in the 15 EU countries and 5-fold in China.
Changes in Per Capita Annual Supply
Unit: kg
ޓ
Japan
World
U.S.
EU (15)
China
1973
66.5
11.8
15.6
19.6
5.1
2003
64.3
16.8
23.8
22
25.9
1.0
1.4
1.5
1.1
5.1
2003/1973
Sources: "Food Balance Sheets," FAO; "Food Balance Sheets," Ministry of Agriculture, Forestry and Fisheries
ᾒ
ᾞ
ᾛ
ᾤ
ᾜ
ᾝ
Sushi culture spreading throughout world
Nigiri sushi has been spreading globally, mainly in
Europe and North America. In the United States where
no one was used to eating raw fish, the word “sushi“ has
settled. Americans have even devised new sushi
varieties including California Rolls.
5
World Fishery Production Stagnant
Marine fishery production has recently been stagnant, while aquaculture (mainly in China) has been expanding.
According to the Food and Agriculture Organization, some half of marine stocks in the world have been fully
exploited, one quarter overexploited or depleted, and another quarter moderately exploited or underexploited.
Changes in Production by Major Countries
World Marine Stock Levels
(10,000 tons)
Others
Vietnam
Philippines
Indonesia
Aquaculture
Aquaculture
Japan
Moderately
exploited or
underexploited
Overexploited or
depleted
India
Others
Fully exploited
Japan
Indonesia
Chile
Fishery
Fishery
China
U.S.
Peru
Source: “SOFIA 2006,” FAO
China
Sources: Prepared by the Fisheries Agency based on “Fishstat (Capture production 1950-2006)” and “Aquaculture production 1950-2006” (for
countries other than Japan), FAO; “Annual Report on Fishery and Aquaculture Production Statistics” (for Japan), Ministry of Agriculture, Forestry
and Fisheries.
Some tuna stocks have deteriorated
Japan consumes some one-third of global tuna production (2 million tons). Stocks have remained low for Pacific
and southern bluefin tuna.
Stock Levels of Tuna
Abundant
stocks
ఱୌဢ
Atlantic
Ocean
High
Medium
Limited
stocks
Western and Central
ಎୌ໐ఊဢ
Pacific Ocean
Low
Bigeye
tuna
䊜䊋䉼
Yellowfin tuna
䉨䊊䉻
Albacore
䍩䍼䍻䍣䍔䍼
Bluefin tuna
䉪䊨䊙䉫䊨
Yellowfin
tuna
䉨䊊䉻
Bigeye
tuna
䊜䊋䉼
Albacore
䊎䊮䊅䉧
(North: low level
䋨ർᄢᵗ䈲ૐ䇮
South:
medium level)
ධᄢᵗ䈲ਛ䋩
Indian
Ocean
ͼϋΡဢ
Bluefin tuna
Southern
bluefin tuna
Longtail tuna
Bigeye
tuna
䊜䊋䉼
Yellowfin tuna
Eastern Pacific
Ocean
໐ఊဢ
Albacore
䊎䊮䊅䉧
Yellowfin
䉨䊊䉻tuna
䉨䊊䉻
(medium or low
Bigeye tuna
Yellowfin tuna
Albacore
䋨ਛ䈎䉌ૐ䋩
level)
Bigeye
tuna
䊜䊋䉼
Southern bluefin
tuna
䊚䊅䊚䊙䉫䊨
㶎Pacific bluefin tuna stocks are still under survey
̪ᄥᐔᵗ䈱䉪䊨䊙䉫䊨䈲⺞ᩏਛ
Source: "FY2007 Present Conditions of World Fishery Resources," Fisheries Agency and
Fisheries Research Agency
6
Supply/Demand Relationship Could Tighten
The FAO states that while demand for seafood is expected to increase, marine fishery production is projected to stagnate
with aquaculture covering a future demand expansion. A supply-demand gap is expected to expand to 11 million tons in
2015.
Seafood prices are predicted to rise at an annual pace of 3.0% until 2010 and at 3.2% from 2010 to 2015. The world’s
seafood supply/demand relationship is expected to tighten further to boost prices.
Fishery Product Supply/Demand Outlook
Per capita fish
product consumption
per year
Global demand
A
Global output
B
Demand́Output
A㧙B
133 million tons
129 million tons
- 4 million tons
183 million tons
172 million tons
- 11 million tons
Source: Created based on “The state of world fisheries and aquaculture 2004,” FAO
Note: Global demand or output includes noneligible products.
Japanese imports’ share of world trade is falling for some fish
As international fishery product prices have soared on global demand growth, Japanese imports’ share of world trade has
been falling for some fish.
U.S. Pacific Cod Exports (frozen, refrigerated or fresh) and
Export Destinations
Case for Pacific Cod
10
(10,000tons)
Others
Canada
8
China
6
Norway
4
Portugal
2
South Korea
0
2001
2002
2003
2004
2005
2006
2007
Japan
Japanese share 43.2% 41.2% 34.7% 27.7% 24.3% 19.4% 14.7%
Source: "U.S. Trade Statistics," U.S. Department of Commerce
Global demand for seafood has been increasing. In the future, Japan
should expand its domestic production capacity and consumption.
7
2 What’s Going on in the Seas Around Japan Now?
What Is Japan Doing to Increase Benefits from the Seas through
Proper Conservation and Management of the Seas?
Japan’s fishery production has been decreasing
While Japan is one of the world’s leading fishing countries, its fishery production has declined due to the tougher
international regulations on distant water fishery operations, overfishing exceeding rebuilding capacity of stocks, and
import growth emerging from dietary pattern changes.
Changes in Production Volume and Value by Fishery Category
Production volume
(10,000 tons)
1,800
1982 Peak production value (㪳 2.9772 trillion)
Production value
(㪳 1 trillion)
3
1,600
2
1984 Peak production volume
(12.82 million tons)
1,400
2006
(¥ 1.6066 trillion)
1
1,200
1,000
0
Distant water
fisheries
800
1
2007 (provisional)
(5.70 million tons)
Offshore fisheries
600
2
400
Coastal fisheries
200
3
Marine aquaculture
Inland water fisheries
and aquaculture
4
0
1960
1965
1970
1975
1980
1985
1990
1995
2000
2005
200
7
In 1985, Japanese pilchard output alone totaled 4.49 million tons. Over recent years, output has increased for mackerel
varieties, anchovy and bonito.
Changes in Catches by Species
(10,000 tons)
90
500
(10,000 tons)
Common
mackerel
400
Anchovy
60
300
Skipjack tuna
200
30
100
Saury
0
1960
1970
1980
1990
2000
Source: “Annual Statistics of Fishery and Aquaculture
Production,” Ministry of Agriculture, Forestry and Fisheries
0
1997
8
1999
2001
2003
2005
2007
Japanese
pilchard
Nearly a half of marine stocks are at low levels
Medium High
Nearly a half of marine stocks in Japanese waters are at low levels after overfishing exceeding rebuilding
capacity of stocks and industrial development for factories of coastal spawning and growth areas.
High level
15 stocks
Low level
43 stocks
Low
Medium
level
32 stocks
Main species or stocks
Saury (Northwestern Pacific stock)
Southern mackerel (Pacific and East China Sea stocks)
Japanese mackerel (Pacific and Tsushima warm current stocks)
Japanese common squid (winter and autumn stocks)
Snow crab (Northern Pacific and Sea of Japan stocks)
Pacific mackerel (Pacific and Tsushima warm current stocks)
Japanese pilchard (Pacific and Tsushima warm current stocks)
Alaska pollack (Northern Seaof Japan and Pacific stocks)
Source: "Marine Fisheries Stock Assessment in Japanese Waters," Fisheries Agency and Fisheries Research Agency.
Resource recovery plans are ongoing.
Marine resources will be renewable eternally through proper conservation and management. In order to maintain
and recover marine resources, we will have to restrict catches and fishing days and exploit resources rationally with
priority given to quality rather than quantity.
䂾Total Allowable Catch (TAC) system
䂾Total Allowable Effort (TAE) system
Annual catch quotas have been set to manage stocks (since 1997)
Restrictions are set on the number of fishing days for specific waters,
fishing methods and periods to manage fishing efforts (since 2002).
Pacific saury, Alaska pollack, horse mackerel, Japanese pilchard,
mackerel, common squid, snow crab
Flathead flounder, sand eel, sharkskin flounder, Spanish mackerel,
tiger puffer, small-mouthed sole, slippery flounder, spear squid
(The Comprehensive Resource Recovery Plan)
The comprehensive resource recovery plan is formulated for multiple species
with focus on the types of fisheries such as set net and trawl net fishing, which
are difficult to be covered by the species-specific plans.
ᾒ
ᾞ
ᾛ
ᾤ
ᾜ
ᾝ
Speciesby-species
Number of plans
(Resource Recovery Plans by Species)
The specific recovery target is set for the period of the plan regarding fish
species that require urgent resource restoration, and comprehensive efforts
including the following are promoted to achieve this target: (1) reduction in
fishing efforts such as reducing the number of vessels and suspending fishing
operation; (2) active cultivation of resources through release of seedlings,
etc.; and (3) conservation of the fishing ground environment.
Plans under
preparation
Plans under
implementation
Compre
hensive
Number of resource recovery plans prepared and implemented
䂾Resource Recovery Plans
Plans under
preparation
Plans under
implementation
Apr. 2002 Apr. 2003 Apr. 2004 Apr. 2005
Apr. 2006
Apr. 2007
Sep. 2008
Source: Fisheries Agency
Considering TAC and other systems
The Fisheries Agency created a panel of experts in April 2008 for consideration of TAC and other systems. Specifically, the panel is tackling
the TAC system and the IQ/ITQ system (see explanations below). By September, the panel discussed the roles, challenges and improvements of
the TAC system in Japan’s marine stock management and compiled an interim report on the TAC system.
䇼Explanation䇽
ITQ (Individual Transferable Quota)
IQ (Individual catch Quota)
Individual catch quotas are transferable to others.
Transfer
80䌴
10䌴
㸣
90䌴
An allowable catch quota is set for each fisherman or fishing boat.
80䌴
An allowable
catch quota for
each boat
50䌴
9
50䌴
㸣
40䌴
9
ᾒ
ᾞ
ᾛ
ᾤ
ᾜ
ᾝ
Snow crab stocks increased through appropriate control (Sea of Japan)
ᣣᧄᶏ䈪䈫䉏䉎䉵䊪䉟䉧䊆䈱㊂
Snow
Crab Catches in Sea of Japan
In addition to fishing ban seasons and zones as set by government Catches (in tons)
Ṫ₪㊂䋨䊃䊮䋩
ordinances for snow crabs, fishery operators have voluntarily
㪏㪃㪇㪇㪇
imposed tougher controls including extension of fishing ban seasons,
and restrictions on sizes and volume of crabs for catching.
Each
prefecture launched
ฦᐭ⋵䈪䉦䊆䈱ᢙ䉕Ⴧ䉇
efforts
to increase snow
䈜ข䉍⚵䉂䉕㐿ᆎ
crab stocks
㪍㪃㪇㪇㪇
Since the Japan-Korea Fisheries
Agreement was concluded in 1999,
Korean fishing boats’ operations have
been limited to the Korean exclusive
economic zone and the so-called
provisional waters designated by the two
countries.
㪋㪃㪇㪇㪇
㪉㪃㪇㪇㪇
㪇
ᤘ㪅㪌㪌 1985
㪍㪇
1980
As a result of such efforts, snow crab
stocks have been increasing.
ᐔ㪅㪉
1990
㪎
1995
㪈㪉
2000
㪈㪎ᐕ
2005
Sources: Fisheries Agency and Fisheries Research Agency
Pacific mackerel stocks expected to recover (Pacific Ocean)
Pacific Mackerel Catches and Immature Fish’s Share
Adult fish (at least three
years old)
Immature fish (Not more
than two years old)
Immature fish's share
Pacific mackerel catches in the Pacific Ocean peaked at 1.47
million tons in 1978 and declined to only 20,000 tons in 1990.
In 1992 and 1996, dominant year class mackerel emerged.
But immature fish catches prevented stocks being restored.
Overall catches are still limited to low levels.
In a bid to protect immature fish and secure spawning fish,
Japan has suspended mackerel fishing operations using
medium to large encircling nets in the Northern Pacific since
fiscal 2003.
Source: “Fish Stock Assessment in Japanese Waters,” Fisheries Agency and Fisheries Research Agency
(HP) Stock Management Room http://www.jfa.maff.go.jp/suisin/index.html
Enhancing Crackdown on Foreign Fishing Vessels
Japan monitors and cracks down on foreign fishing vessels' illegal operations in its exclusive economic zone and territorial
waters. Recently, foreign fishing vessels' malicious actions have stood out. Some foreign fishing vessels have rejected
boarding inspections and fled from Japanese patrol boats. Japan has thus been enhancing its monitoring and crackdown
activities.
Fisheries Agency's Boarding Inspections and Other Actions
(cases)
Number of boarding
inspections
Number of fishing gear
confiscation cases
Number of
seizure cases
2002
2003
2004
2005
2006
Source: Fisheries Agency
10
(year)
Number of seizure and fishing gear
confiscation cases
Number of boarding inspections
(cases)
Responsible fisheries management is needed internationally
Given that tuna and other highly migratory stocks migrate widely, over-fishing in a certain sea area could affect
catches in other sea areas. Therefore, regional tuna fishing management organizations have been created to
implement management measures such as total allowable catch and national quota systems and quantitative
restrictions on tuna-fishing vessels.
Recent major decisions
CCSBT (Commission for the Conservation of
Southern Bluefin Tuna)
ICCAT (International Commission for the
Conservation of Atlantic Tunas )
䊶Atlantic bluefin tuna catch
quotas will be reduced
gradually (from 34,700 tons in
2006 to 27,600 tons in 2010)
䊶Introduction of a catch
documentation scheme
10,000 tons䇭䇭䇭Total Catches
10,000 tons䇭䇭Catch Quotas
䊶Total southern bluefin tuna
catches will be reduced from
14,925 tons in 2006 to 11,530
tons in and after 2007.
4.0
3.0
2.0
34,700䌴
27,600䌴
1.0
0.0
2.0
1.5
1.0
0.5
14,925䌴
11,530䌴
0.0
2006
2010
2006
From 2007
IOTC (Indian Ocean Tuna Commission) IATTC (Inter-American Tropical Tuna
Commission)
䊶Restrictions on the number of fishing boats for
bigeye tuna, yellowfin tuna, swordfish and
albacore tuna
䊶Encircling net fishing ban season in 2007
䊶Restrictions on bigeye tuna catches with the long
line fishing method in 2007
WCPFC (Western and Central Pacific Fisheries Commission)
䊶Limiting bigeye and yellowfin tuna fishing capacity or efforts with encircling nets to levels for recent years
䊶Limiting 2006-2008 bigeye tuna catches with the long line fishing method to levels for recent years
(HP) Tuna information http://www.jfa.maff.go.jp/j/tuna/index.html
ᾣ
ᾞ
ᾟ
ᾘ
ᾒ
ὲ
Expectations on Tuna Aquaculture
Japan’s bluefin tuna aquaculture production has increased year by year. Such production was expected to exceed 4,000 tons in
fiscal 2007. As bluefin tuna demand is growing globally, efforts are required to secure stable bluefin tuna supply for the future.
But seed supply has been unstable and assorted feed has yet to be developed. Given these problems, the government has been
promoting development of artificial seed production technology and assorted feed in a bid to build infrastructure for stable
bluefin tuna supply.
Hopes placed on progress in studies on complete tuna aquaculture
Young
tuna
Grown in
a farm
Adult tuna
Egg Fertilized eggs
laying
(Some
5 years)
100-150 kg
Tuna
aquaculture
Adult tuna
Complete tuna
aquaculture
(Some
5 years)
Seed
production
Young
tuna
Shipment
Grown in a farm
About 20 kg
11
What Is Japan Doing to Improve the Marine Environment?
Marine forests and tidelands have declined
Japan’s coastal areas have had marine forests and tidelands that are suitable for fish spawning and growth as
well as purification of water. But their space has declined substantially.
Functions of Tidelands
(10,000 ha)
Total Area of Tideland
100
Ingestion and decomposition of organic
matters by organisms in tidelands
Decreased by 40%
over 50 years
80
60
82.6
40
Domestic
wastewater
Recreation area
49.4
20
Stopover for migratory birds
0
1945
(organic matter,
nitrogen, phosphorus)
Microorganisms
decomposing organic matter
into inorganic matter
1998
Birds’ feeding ground
Eating organic matter
such as plankton
Place for playing
with water
High production ability
of microalgae
Offshore
Stabilization of
sea-bottom mud
Water
purification
CO2
Abundant benthic biota
O2
Spawning ground for
aquatic organisms
(10,000 ha)
25
Total Area of Underwater
Plant Beds
Decreased by 40%
over 30 years
20
Photosynthesis
Absorption of CO2
Supply of O2
Diverse biota on and
between seaweeds
Absorption of
nitrogen and
phosphorus
Fry rearing ground
15
10
20.8
Functions of Marine Forests
14.5
12.5
5
0
1978
1998
Absorption of nitrogen and phosphorus
by underwater plant bed
2007
Sources: “Basic Survey on Natural Environment Conservation,” Ministry of the Environment; Fisheries Agency
Rocky-shore denudation
on disappearance of kelp
“Rocky-shore denudation” has emerged
nationwide to affect fish living in marine
forests.
“Rocky-shore denudation” means the
disappearance of marine algae due to rising
“Rocky-shore denudation” emerging
water temperatures or an increase in sea
on sea urchin’s feeding damage
urchin and rabbitfish.
(Saimura Fisheries Cooperative,
Aomori Prefecture)
12
Rocky-shore denudation on
disappearance of seaweed
Rocky-shore denudation on
disappearance arame and
kajime weeds
Promotion of conservation of marine forests and tidelands
In a bid to conserve marine forests, fishermen have taken leadership in culling sea plant eaters including sea
urchin and setting up nets to prevent sea plants from being eaten.
Exterminating sea urchin
Disappearance of seaweeds
on rocky-shore denudation
(Kuroshio, Kochi
Prefecture)
Recovery from rockyshore denudation
Source: Guidelines against rockyshore denudation, Kochi Prefecture
Monitoring after sea urchin
culling
We also dredge up tideland mud regularly and eliminate unnecessary sand and
sea lettuce to restore and conserve tidelands.
Countermeasures for Global Warming
In May 2007, Japanese Spanish mackerel that usually live in warmer
waters were caught in the northeastern Japanese prefectures of Aomori
and Iwate. Catches have increased in the Sea of Japan as well.
These changes may be attributable to a medium-term rise in water
temperatures. Environmental changes are feared to affect fisheries.
Therefore, we are assessing global warming’s effects on the fisheries
industry and developing projected technologies and considering
countermeasures.
13
Japanese Spanish mackerel caught in fixed netting (off
Misawa, Aomori Prefecture)
Source: Asahi Newspaper
How Many People Are Fishing in Japan? How Have Fuel
Price Hikes Affected Fishing?
Shrinking and aging fishermen population
The fisherman population has been on the decline, standing at 204,000 as of 2007, of which those over 65 years old
accounted for 37.4%. Despite the progress in aging, only about 1,200 people newly joined the fishery workforce.
Changes in Number of Fishery Workers
Harsher reality of fishing businesses
The average earnings of coastal fishing households have been on the decline. Many fishery companies offset the losses in
fishery business by the profits in fishery processing business and other non-fishery business and by non-operating profits.
Financial situation of coastal fishing households
(Unit:
thousand yen)
䋨න䋺ජ䋩
㪈㪊ᐕ
2001
Fishery earnings
Fishery income
Fishery expenditure
Fuel expenses
Proportion to the expenditure
Non-fishery earnings
Business earnings
㪉㪃㪉㪌㪎
㪌㪃㪈㪍㪇
㪉㪃㪐㪇㪊
㪋㪈㪈
㩿㪈㪋㪅㪉㪀
㪉㪏㪉
㪉㪃㪌㪋㪇
㪈㪋
2002
㪈㪌
2003
㪉㪃㪉㪍㪎
㪌㪃㪈㪌㪊
㪉㪃㪏㪏㪎
㪋㪇㪈
㩿㪈㪊㪅㪐㪀
㪉㪍㪋
㪉㪃㪌㪊㪇
㪈㪍
2004
㪉㪃㪈㪌㪍
㪌㪃㪇㪇㪉
㪉㪃㪏㪋㪍
㪋㪈㪍
㩿㪈㪋㪅㪍㪀
㪉㪊㪏
㪉㪃㪊㪐㪋
㪈㪎
2005
㪉㪃㪈㪌㪊
㪋㪃㪐㪋㪊
㪉㪃㪎㪐㪇
㪋㪉㪊
㩿㪈㪌㪅㪉㪀
㪈㪐㪇
㪉㪃㪊㪋㪊
㪈㪏
2006
㪉㪃㪈㪋㪊
㪋㪃㪐㪇㪏
㪉㪃㪎㪍㪍
㪋㪏㪉
㩿㪈㪎㪅㪋㪀
㪈㪏㪇
㪉㪃㪊㪉㪊
㪉㪃㪋㪍㪍
㪍㪃㪊㪉㪈
㪊㪃㪏㪌㪌
㪎㪊㪇
㩿㪈㪏㪅㪐㪀
㪏㪋
㪉㪃㪌㪌㪇
Source: Prepared by the Fisheries Agency based on the “Fishery Business Management Report” issued by the Ministry of
Agriculture, Forestry and Fisheries
Note: Since the survey of 2006 was conducted under a significantly modified survey system, the results of the survey in
2006 do not have continuity from those of previous years.
Number
of boats
㓲ᢙ䋨㓲䋩
Fishing boats are aging too.
Although the lifespan of fishing boats is usually 15 years,
about 40% of the boats used in offshore trawl net fishing
have been in use for 20 years or longer (See the graph on
the right). The aging of boats could decrease the
productivity and safety while increasing the maintenance
costs.
30
25
20
15
10
5
0
0
5
10
15
Age
of boats
⦁㦂䋨ᐕ䋩
14
20
25
30䌾
Rising fuel prices
The crude oil price has been on the rise worldwide. In the fishery industry, the proportion of fuel expenses in the total costs is
higher than in other industries. As a result, the rising fuel prices have greatly impacted fishery business management.
Trend in the price of Bunker A supplied by the National
Federation of Fisheries Cooperative Associations
Proportion of furl costs in the total
fishery expenditure
/䌫䌬
yen/kl
140,000
䋨䋦䋩
120,000
100,000
2004
ᐔ㪅㪈㪏
2008
㪉㪇ᐕ
ዊဳᐩ䈶䈐✂
fishing
Small bottom trawl
㪉㪊㪅㪏
㪊㪈㪅㪊
Gill net fishing
ೝ✂
㪈㪌㪅㪏
㪉㪈㪅㪋
ᴒวᐩ䈶䈐✂
fishing
㪉㪊㪅㪍
㪊㪈㪅㪇
Coastal squid fishing
ᴪጯ䈇䈎㊒Ṫᬺ
㪊㪇㪅㪎
㪊㪐㪅㪊
80,000
60,000
Offshore bottom trawl
40,000
䈀ోṪㅪ䌁㊀ᴤଔᩰ䈁
[Price of Bunker
A supplied by the Cooperative]
20,000
䋨 䌈䋱䋶䋮䋳䋩
(Mar.
2004)
䋴䋲䋬
䋵䋰䋰䋯䌫䌬
42,500
yen/kl
䋨 䌈䋲䋰䋮䋹䋩
(Sep.
2008)
113,600 yen/kl
䋱䋱䋳䋬䋶䋰䋰䋯䌫䌬
Source: Fisheries Agency
Note. The data for 2008 was calculated in consideration of an
increase in the fuel cost while assuming that the non-fuel
fishery expenditure remains the same. (Calculation was made
based on the average fuel costs in 2008 on the assumption that
the fuel price stays at the level in September (¥113,600).)
䋼⚂䋲䋮䋷䋾
About
2.7 times higher
0
Jan.
2004
16ᐕ1
Jan. 2005
17ᐕ1
Jan.
2006
18ᐕ1
Jan. 2007
19ᐕ1
Jan.
2008
20ᐕ1
Source: Fisheries Agency
The characteristics of fishery products, such as great fluctuations in production volume, wide variances in terms of type and
size, and rapid deterioration of quality, have contributed to the development of a diversified distribution system.
Producer
Catch and
landing of fishes
Shipper at the
landing area
Wholesaler
Retailer/foodstuff
Wholesale store
Intermediate
wholesaler
Wholesaler
Consumer
Wholesale market at
the consuming area
Wholesale market at
the landing area
As a result, the diversified distribution system coupled with the high cost of processing and freshness maintenance tends to
raise distribution costs. The prices of fish are determined based on the market mechanism regardless of high fuel prices.
Consequently, the rising production costs are not sufficiently reflected in the product prices in the fish market of production
location.
Trend in the wholesale prices in the fish market
of production location
yen/kg
/䌫䌧
200
150
133
146
154
149
160
144
138
121
122
128
140
154
100
50
0
䋹ᐕ
1997
11ᐕ
1999
13ᐕ
2001
15ᐕ
2003
17ᐕ
2005
19ᐕ
2007
Source: Source: Prepared by the Fisheries Agency based on the “Fishery Product Distribution Statistics” issued by
the Ministry of Agriculture, Forestry and Fisheries
Note: The data for 2008 was calculated based on the weighted average for a period up to July.
15
What Is Japan Doing for Fishermen Capacity Building and
for Competitive Fisheries Industry Building?
Measures have been taken to promote the entry of new workers
and companies into the fishery industry.
In addition to fishery job information service, a 6-month on-the-job training program is offered to young people in cities.
Measures have been taken to support the initiatives of groups of fishery operators lead by veteran fishery operators.
Experience-based education
program for fishery
Fishery job placement fair
I want to become
a fisherman!
ᾣ
ᾞ
ᾟ
ᾘ
ᾒ
ὲ
Training program at fishing sites
Formation of “The Ryoshi’s (The Fishermen)”
For the Fishery Job Placement Fair 2008,
“The Ryoshi’s” was formed to convey the
appeal of fishery and fishing villages.
The four fishermen forming the group are
called “fishery executives,” who quit their
previous jobs to become fishermen. They
are eager to convey the thrill of being
fishermen.
Job placement at
the training site!
(HP) National Fisherman Recruiting and Training Center, Ryoshi jp http://www.ryoushi.jp/
New business developed through cross-industry collaboration
Efforts have been made to revitalize the fishery industry and fishing villages by encouraging companies and entrepreneurs
in non-fishery fields to use their know-how and skills to make business out of fishery resources and develop new business
models.
Consignment
of production
and
processing
Fishery
operators
Shipment of
fish catches
(New entry)
Dairy Company X
•Provision of machinery
•Instructions on processing
•Instructions on management
Distributor
•Sterilization procedures
•Processing
•Packaging
(Enhancement of
hygiene control)
• Stable shipment of fish
catches
• Stable fishery income
• Job creation
Major foods
supermarket
Local co-op stores
•
•
•
•
Extension of best-before periods
Improvement in the loss rate
Differentiation of products
Development of high-value
added products
For example, in the case of Chirimen (boiled and dried baby sardines) and Kounago (boiled and dried baby
sand lance), for extension of best-before periods, efforts have been made to enhance hygiene control and
improve the loss rate through better bacterial control.
16
Support for the Initiatives to Promote the Structural Reform of
the Fishing Boat Operation and the Fishing Industry
(Round haul netter)
(Two searching
boats)
Smaller
fleet
[Mini fleet]
(Round
haul netter)
(Two carrying
boats)
(Searching and
carrying boat)
[Initiative 2: Human-resource-saving,
energy-saving boats]
Replacement of an old
boat with a low-cost boat
•Introduction of human-resource-saving
machines (Automatic net hauler)
•Introduction of energy-saving fish-luring
lights
Use of humanresourcesaving, energysaving fishing
boats
[Initiative 1: Smaller fleet of round haul netter]
Reduction of
operation costs
Measures have been taken to promote managerial changes through introduction of high-profit operation and production
systems and replacement of old boats with human-resource-saving, energy-saving boats.
(HP) Structural reform of fishing boat fisheries http://www.jfa.maff.go.jp/j/enoki/gyosen/index.html
New Program to Stabilize Fishery Business Management: “Reserve Plus”
A program called “Fishery Business Stabilization Program” has been offered since 2008 in order to realize “effective and
stable fishery business management.” This is a new program targeted at fishery operators seeking proactive and strategic
improvement of their fishery business management. This program is designed to supplement the currently available
management stabilization programs offered by the Fishery Mutual Relief Fund in order to alleviate the negative effect of
income reduction on fishery business management.
Image of New Fishery Business Stabilization Measures
(HP) Fisheries Agency “Tsumitate Purasu (Reserve Plus)” http://www.jfa.maff.go.jp/j/hoken/keieiantei.html
17
Measures against Rising Fuel Costs
To cope with the rising fuel costs, measures have been taken to promote energy-saving initiatives of fishery operators.
Furthermore, Japan has been promoting a structural reform of fishery business management.
䂾Measures to increase the residual income by taking advantage
of diversification of distribution channels
In order to increase the residual income of fishery operators, the
following measures have been taken:
(1) Increase in the purchase size of fishery products, (2) Improvement
of measures to support direct transactions, and (3) Promotion of direct
purchase of fish farm bait
䂾Demonstrative project with the focus on fuel cost increase
In this project, Japan will subsidize 90% of the increase in fuel
costs upon request from fishing groups that cut fishery fuel
consumption by 10% or more.
Supply of fuel for fishery operation
from the Fishery Cooperative
Association (No payment is necessary
at this point)
Fish market of production location
Fish markets of consumer locations
Conventional
distribution
channels
After landing, the following
payment must be made to the
Association:
(1) Fuel costs at the level of
2007
(2) 10% of the increase in fuel
costs
(90% of the increase in fuel
cost is subsidized in practice)
Distribution cost: ¥300/kg
Fishery
operator
Fishery
organization
Residual income
of fishery operator
¥100+㱍 /kg
Fuel-saving operations
(10% or larger reduction of fuel
consumption)
Energy-saving
operation
䂾Measures to enhance fishery business management
culture
Measures have been taken to promote group operations
(use of jointly-used searching boat and carrying boats) and
replacement of old facilities with energy-saving facilities.
Consumers
Distribution cost: ¥300-㱍/kg
Retail price
¥400/kg
<Image of direct transaction>
Suspended
Suspended
Suspended
Suspended
Suspension
of fishing
Introduction of the latest energy-saving
engines by receiving an interest-free loan
Introduction
Retailer
䂾Suspension of fishing and decrease in the number of fishing
boats
In view of the rising fuel cost, financial obligation on fishery
operators has been eliminated. Further measures that best suit the
reality of each fishery type have been taken such as the suspension of
fishing and decrease in the number of fishing boats.
䂾Interest-free loan system to promote energy saving
The criteria for receiving the Coastal Fishery Improvement Fund
were modified in such a way that allows fishery operators to receive
fund repeatedly for introduction of energy-saving facilities and
equipment and provides them with interest-free loans for energysaving fishery operations.
Latest engines
direct
transaction
Cost reduction by
Purchase
* Financial burden on fishery operators, etc., during the suspension period
Burden on the Nation
(Conventional rule) 1/3㸢 (New rule) 1/3
Burden on prefectural and city governments (Conventional rule) 1/3 㸢 (New rule) No requirement
Burden on fishery operators
(Conventional rule) 1/3 㸢 (New rule) No requirement
䂾Measures to support the activities of energy-saving promotion
organizations
Measures have been taken to promote initiatives taken by fishery
operators suspended under the rotational fishery suspension system.
Maintenance of fish-gathering forests
Rotational fishery suspension
Production increase
during the suspension
period
Maintenance of tidelands
Removal of drifting and drifted objects
Maintenance of marine forests
(HP) Fisheries Agency: Measures against Rising Fuel Costs in Fishery http://www.jfa.maff.go.jp/j/keiei/nenyu/index.html
Initiatives by fishermen are indispensable for sustainable use
of fishery resources for stable fishery business and
conservation of marine ecosystem.
18
How Is Seafood Treated before Becoming Available for Eating?
Measures to Distribute Seafood Efficiently
In order to provide fresh, safe seafood stably, fish-landing areas should enhance sales capacity and exactly meet
consumers’ needs.
As for great seafood demand for mega-supermarkets, efforts are ongoing to develop distribution bases for stable supply
through unification of lots and standards.
Fish-landing
area
Distribution-base market
Direct sale
Stabilize supplies by selling products by lot
- Increasing the number of purchasers to stimulate transactions
- Establishing a centralized system controlling landing, selecting,
storing, and shipping of seafood in order to improve the freshness of
products and produce high value-added products
[Number of fish markets of production locations:
922 in 2001 㸢 500 in 2010 (Target)]
Buyer
Fish-landing
area
Retailer/food
wholesaler
Consumption-area
market
Physical and
Commercial
distribution
As for a wide variety of products for small-lot foreshore production and distribution, diverse distribution channels
including direct sales to consumers should be developed to reduce distribution costs.
Producer
Consumer
٤Landing various fishes
٤Sales channels are not ready for fresh,
delicious fish
٤Fish prices slumping in absence of buyers
٤Willing to eat fresher, safer fish
٤Willing to eat various fishes, while failing to
know what fish to buy
Matching
Hygiene Control and Quality Control
In order to provide consumers with safe, reliable seafood, fishery industry workers are improving quality control through such
measures as introduction of the HACCP system at fishery processing plants and development of facilities at fish-landing area
markets.
ϥHACCPϥ
HACCP is a system to control hazards (biological, chemical, and physical factors that could cause disease or injury) by
establishing critical control points in the manufacturing processes from food ingredients to the final product.
HACCP
(Hazard Analysis)
Check
Process 3
Check
Process 2
Check
Process 1
Ingredients
(Critical Control Point)
Check
Controlling the processes in real time
Creating and storing process-control records
19
Product
Food safety
assured
Outline of the Hachinohe Area Project Reform Plan
(large and midsize round haul net fishing)
-Improvement of the hygiene control of fish market facilities 㸢 Promoting the structural reform of the fish market of
production location and the distribution of seafood
- Enhancement of the value added to fish catches and development of new sales channels including export 㸢
Establishment of new business models
Consolidation of three fish markets
䉕⛔ว
䋳䈧䈱↥Ꮢ႐
of production locations
Rationalized fleet
วℂൻ⦁࿅
䋨䋲㓲 䋳䋳ੱ䋩
(33 fishermen on two boats)
Improvement
of hygiene control of packaging
⩄䈘䈳䈐ᣉ⸳䈱ⴡ↢㜞ᐲൻ䋨㐽࿐ൻ䇮ቯ
facilities
(introduction
of an enclosed system, room
᷷▤ℂ䇮
䊐䉞䉾䉲䊠䊘䊮䊒᳓឴䈕╬䈮䉋䉍
temperature
management system, and fish pump
㪜㪬㩷㪟㪘㪚㪚㪧䈮ኻᔕ䋩
landing system to conform to the EU HACCP)
Increase in the average fish price by
ᄙᲑ㓏⥄േㆬᯏ䈱ዉ䈮
introducing
automatic multi-level
sort䉋䉎ᐔဋ㝼ଔ䈱ะ
machines
Transportation
by sealed containers
ኒ㐽䉮䊮䊁䊅䈮䉋䉎ャㅍ
Net hauling and
✂⦁
ㆇ៝⦁
carrying boat
Freazer
಄ಓᐶ
•Introduction of facilities for new
products
(skipjack, mackerel,
䊶ᣂຠ䋨䉦䉿䉥䇮䉰䊋䇮䊑䊥䈱
yellowtail
frozen on board)
⦁ಓຠ䋩↢↥䈱䈢䉄䈱⸳䈱
•Saving of human resources by
⸳⟎
introducing a new machine to handle
䊶ᣂ✂䈘䈳䈐ᯏዉ䈮䉋䉎⋭ੱ
nets
ൻ
•Improvement
of the working and
䊶ഭዬⅣႺ䈱ᡷༀ
living
environments
Marketing of new products
(skipjack,
mackerel,
ᣂຠ䋨䉦䉿䉥䇮
yellowtail
frozen on board)
䉰䊋䇮䊑䊥䈱⦁ಓ
ᧅ⽼ᄁ䈮
Introduction of
e-commerce to
㔚ሶขᒁ
bid
selling
䉕ዉ
Shipment of
↢㞲⩄
fresh
seafood
ຠ䋩䈱⽼ᄁ
Shipment of
Processor
ടᎿᬺ⠪
಄ಓ⩄
(conforming
to the EU HACCP) frozen seafood
䋨 㪜㪬㩷㪟㪘㪚㪚㪧䈮ኻᔕ䋩
Supply
of safe and reliable fishery products
ో䈪ᔃ䈭᳓↥‛䈱ଏ⛎
Carrying and
ㆇ៝⦁
ត⚝⦁
Domestic
࿖ౝ
shipment
⩄
searching boat
ᾒ
ᾞ
ᾛ
ᾤ
ᾜ
ᾝ
Export
ᶏᄖ
shipment
ャ
Development of overseas
㪜㪬㩷㪟㪘㪚㪚㪧䈱ቯข
sales channels by obtaining
ᓧ䈮䉋䉍䇮ᶏᄖ䈻䈱⽼
an
EU HACCP certification
〝ᄢ
In-Store Fish Advisor
Fresh fish promoting communication with customers
In a supermarket in Tokyo, a sales assistant of the fish section is busy helping customers. He
recommends which cooking method best suits a certain kind of fish, advises which fish are in
season, and cuts fish for sashimi or for any other purpose upon request.
The presence of such a fish sales assistant has contributed to the recent increase in the number of
young housewives shopping there. Face-to-face sales of fresh fish is an effective way to promote
communication with customers.
Important roles to be played by Fish Meisters
A private qualification system, “Fish Meister” was started in October 2007 to foster
experts who can convey the appeal of fish and promote fish consumption. In August
2008, 31 people were certified as the first generation of Fish Meisters. They are
expected to become intermediaries between consumers and producers in the future.
(HP) Fish Meister: http://www.osakana-center.com/meister/meistertop.html
Distributors play an important role in delivering fishermen’s catches to
consumers in such a way that minimizes waste and deterioration in quality and
taste. Distributors are also exploring new markets and providing consumers
with the thrill of new discoveries and the joy of enjoying good fish.
20
3 Getting Familiar with Seas and Fish to Conserve
Bountiful Seas
Why Is It Good to Eat Fish?
To convey the fish-eating culture full of wisdom and wishes of ancestors
Japan is surrounded by bountiful seas and is also blessed with highly productive brackish waters and lakes.
Here, seafood are closely related to people’s daily lives. They are also incorporated in seasonal ceremonies such
as “osechi” dishes for new year and carp streamers.
“Osechi” dishes are full of Japanese spirit
There are many dishes that use fish in “osechi,” which is the series of traditional
dishes for celebrating new year.
You can find the Japanese spirit in its traditions, such as using shrimp, whose bent
back symbolizes old age and therefore longevity, with a wish for long life, or eating
“tazukuri,” which means to make a rice paddy, with a wish for abundant harvest.
Whale-eating culture
Japanese lifestyle is also closely related to whales. It became a popular foodstuff among the
general public in the Edo era. Art and culture related to whales also developed.
Whale meat is rich in vitamin A, good for the eyes. It contains more protein and less
cholesterol compared to beef, pork or chicken, so it is a healthy food.
ᾒ
ᾞ
ᾛ
ᾤ
ᾜ
ᾝ
Number of whales is increasing except for certain kinds
Because of the temporary ban of whale hunting by the IWC (International Whaling Commission), Japan stopped commercial
whaling other than for scientific research from 1998. Whales consumed in Japan are mainly those caught in accordance with a
treaty, for the purpose of examining whether the number of whales is increasing and what whales are eating.
It became clear from this research that the number of whales is increasing except for certain kinds. Because whales eat
massive amounts of fish, it is important to use the increased whales as a resource, from the perspective of not only supporting
human lives but also to ecologically maintain the numbers of other fish.
Whales with numbers increasing
minke whale
Bryde‘s whale
sperm whale
[HP] Fisheries Agency: http://www.jfa.maff.go.jp/whale/indexjp.htm
21
sei whale
Illustration source: Institute of Cetacean Research
Seafood is very nutritious!
It is widely known that DHA included in fish oil has a brain-enhancing function, and EPA works to improve the
flow of blood. Recent research results show that people eating more fish are less likely to have a myocardial
infarction.
Eicosapentaenoic acid (EPA)
Docosahexaenoic acid (DHA)
Helping develop or maintain brain and nerve system functions,
working against allergy and inflammation
(น㘩ㇱ100g䈅䈢䉍(䌭䌧))
(per
100g of edible part
(unit: mg))
Preventing blood clots and vascular constriction, reducing
blood lipid
0
(per 100g of edible part
1000 2000 3000 4000 (น㘩ㇱ100g䈅䈢䉍(䌭䌧))
0
1000
2000
(unit: mg))
1,700
䉰䊮䊙䋨↢䋩
Saury (raw)
Wagyu ‐䊶䈎䈢䊨䊷䉴⢽り䈧䈐
beef, chuck with fatty meat
580
Eel (cultured, raw)
䉡䊅䉩䋨㙃ᱺ䊶↢䋩
970
䉦䉿䉥䋨⑺₪䉍䋩
Bonito (caught
in autumn)
890
䉰䊮䊙䋨↢䋩
Saury (raw)
1,100
䉡䊅䉩䋨㙃ᱺ䊶↢䋩
Eel
(cultured, raw)
1,200
True䊙䉟䊪䉲䋨↢䋩
sardine (raw)
1,300
True䊙䉟䊪䉲䋨↢䋩
sardine (raw)
1,400
䉪䊨䊙䉫䊨䋨⢽り䋩
Bluefin
tuna (fatty meat)
3,200
䉪䊨䊙䉫䊨䋨⢽り䋩
Bluefin
tuna (fatty meat)
500
Chub mackerel
(raw)
䊙䉰䊋䋨↢䋩
0
Wagyu ‐䊶䈎䈢䊨䊷䉴⢽り䈧䈐
beef, chuck with fatty meat
0
Source: STANDARD TABLES OF FOOD COMPOSITION IN JAPAN Fifth Revised and Enlarged Edition
Functional
components
Major seafood containing
functional components
Major functions
Taurine
Adjusting blood pressure, eliminating cholesterol,
improving liver functions, maintaining eyesight
Squid, oyster, octopus, abalone,
scallop, prawn, salmon
Calcium
Forming bone, adjusting blood pressure and nerve systems
Small fish
Iron
A main component of blood erythrocyte (hemoglobin),
helping maintain human body functions
Laver, hizikia, lam
Japanese seafood now attracts people worldwide.
Due to reasons such as stronger health concerns in Western countries, the global trend of a Japanese-cuisine
boom and increase in wealthy people based on the economic development of Asian countries, export of seafood
is increasing.
Changes in Japan’s Seafood Export Volume and Value
Value
Volume
(1,000 tons for volume, 㪳100 million for value)
Total
Dried sea cucumber
Salmon/trout
Mackerel
Total
Pearl
Dried sea cucumber
Salmon/trout
Mackerel
㪈㪐㪎㪌
㪍㪇㪊
㵺
㪌
㵺
㪈㪃㪍㪏㪎
㪈㪎㪎
㵺
㪏
㵺
㪈㪐㪏㪌
㪎㪏㪍
㵺
㪈㪌
㵺
㪉㪃㪏㪎㪍
㪏㪉㪉
㵺
㪌㪋
㵺
㪈㪐㪐㪎
㪊㪋㪊
㵺
㪌㪏
㪋㪐
㪈㪃㪍㪐㪏
㪌㪎㪊
㵺
㪈㪌㪇
㪊㪊
㪉㪇㪇㪌
㪋㪍㪏
㪇㪅㪉㪊㪇
㪉㪌
㪌㪏
㪈㪃㪎㪋㪏
㪊㪇㪉
㪎㪐
㪏㪐
㪊㪎
㪉㪇㪇㪍
㪌㪐㪋
㪇㪅㪉㪎㪊
㪉㪍
㪈㪏㪇
㪉㪃㪇㪋㪈
㪊㪊㪏
㪈㪉㪍
㪈㪇㪈
㪈㪉㪎
Source: Created based on “Japan Trade Statistics,” Ministry of Finance
ᾣ
ᾞ
ᾟ
ᾘ
ᾒ
ὲ
Japanese cuisine featured also at Toyako
Summit
During the period of the Hokkaido Toyako Summit, dishes such as frozen salmon, spitroasted scallops and Ishikari-style stew were offered to foreign press/media personnel at the
international media center, which was the base for news coverage. On this occasion, food
culture of Japan, the appeals of Japanese cuisine and the attractiveness of Japanese foodstuff
were extensively communicated to other parts of the world.
Frozen salmon
(HP) Ministry of Agriculture, Forestry and Fisheries, “Promotion of the export of agricultural and marine products”:
http://www.maff.go.jp/sogo_shokuryo/yusyutu.html
22
㪉㪇㪇㪎
㪍㪈㪉
㪇㪅㪊㪋㪌
㪋㪏
㪈㪌㪍
㪉㪃㪊㪏㪉
㪊㪍㪌
㪈㪍㪎
㪈㪌㪈
㪈㪋㪈
What Fish Are Good for Eating?
Let’s eat seafood more ecologically
Fish resources such as saury and bonito found in waters near Japan are currently abundant. Moreover, they are
relatively low-priced and rich in seasonal taste. Eating these fish in season will also raise the self-sufficiency rate
and will result in conservation of the sustainable fisheries and food culture.
If each Japanese person eats more fish in the respective seasons than before, Japan’s self-sufficiency rate will increase!
Spring
Japanese
Bonito
Summer common squid
Katsuo-no-tataki
Canned bonito
A dish per month
½ cans per month
Sugatayaki
Grill with welsh onion
One per month
A pack per month
or
(Seven slices
per plate)
(80g
per
(1➧80g)
can)
1% UP!
Autumn Saury
or
(One squid per
plate)
Winter
1% UP!
(One squid
per pack)
Yellow
tail
Shioyaki
Pouch-pack
Buri-daikon
Teriyaki
A dish per month
½ pack per month
A dish per month
A dish per month
or
or
(One large
saury per dish)
1% UP!
(Four fillets,
220g per pack)
(A fillet per
dish)
1% UP!
(A fillet per
dish)
Source: “Food Balance Sheets (FY2007),” Ministry of Agriculture, Forestry and Fisheries
Photos: Marine Foods Corp.; National Association of Saury Fishery; Kushiro Shi Fisheries Cooperative Association
Consumption of local-caught seafood is also expected to have a significant favorable impact on environment.
Intake of seafood produced in the
waters surrounding Japan
23
Nitrogen
Phosphorus
What Can We Do In Addition to Eating Fish?
Fisheries industry and fishing communities have various roles (multiple roles) other than their intrinsic role to
supply seafood stably.
Regional environment
conservation
Recharging water
reservoirs
Landslide prevention and soil conservation
Biodiversity conservation
Substance production
Soil erosion prevention
Landslide prevention
Water retention or storage to prevent
landslide
Creating nice scenery
Disseminating
cultures
Climate relaxation
Comfortable environment Cultural functions
development
Water purification
Protection and recreation
Recharging water reservoirs
Biodiversity conservation
Eco-system
conservation
Disposing of organic wastes
Providing opportunities
for exchanges
Inheriting traditional fishing methods
Nitrogen,
phosphorus
Water purification
Tidelands
Fishing to complement nitrogen and
phosphorus cycles
Eco-system
conservation
Phytoplankton
Marine environment
conservation
Seaweed beds
Marine salvage
Border surveillance
Disaster relief
Marine environment
monitoring
Recycling
Source: Created by the Ministry of Agriculture, Forestry and Fisheries based on the Reports by the Science Council of Japan
Let’s go out to the sea and fishing communities!
There are fresh seafood, abundant nature and beautiful scenery in fishing
communities. People can enjoy recreational activities such as clam digging,
and the places have their own attractiveness different from that of urban areas.
Recently, an increasing number of communities are offering opportunities to
experience fisheries and establishing product stands and morning markets.
Efforts to revitalize the town through “marine business” are emerging by
fusing fisheries with tourism and leisure, with a view to creating a new value
to the citizen.
The website below includes information on events held around the country.
Using these kinds of information as a reference, let’s go out to the sea and
fishing communities!
(HP) Let’s go to fishing communities!: http://www.gyoson-go.com/index.html
Sea industry: a collective term for “businesses in which people
make a living by using the sea and beaches, including fisheries
and marine leisure.”
“The best 100 agriculture, forestry and fisheries guest house mothers” Guest House Maruni-maru,
Ms. Masae Hashimoto [Saiki City, Oita Prefecture]
“No extravagant measures, no pretense” is the true
hospitality, zest for living is given from natural wind,
tide and sky.
Ms. Hashimoto manages a fishery guest house that use a building built
as a private residence as-is, and provides dishes using abundant seafood to
guests. With “Kamae Blue Tourism Study Group” serving the central role
of activities, she offers opportunities to experience fisheries and study
about them. Ms. Hashimoto is also making exertions to vitalize the Kamae
area as the president of the tourism association.
(HP) Guest House Maruni-maru: http://marunisuisan.at.infoseek.co.jp
24
Implanting peal cores
PR of lobster (woman wearing the costume of a fish
boat banner is Ms. Hashimoto. She is in the photo
with governor Higashikokubaru.)
Let’s join forces to conserve the sea.
In accordance with the rising awareness of environmental problems among citizens, there is a growing interest in programs
for citizens to participate in maintaining underwater plant beds and tidelands.
In addition, the idea of “Satoumi (home-sea)” is proposed to conserve biodiversity and maintain the high productivity of the
sea, and to nurture traditional culture, through interaction between nature and human. The number of such programs is
increasing for participation by city residents.
Kanazawa Hakkei - Council for restoring Amamo (eelgrass)
beds (Yokohama City, Kanagawa)
Recover bountiful Tokyo Bay through the restoration of Amamo
This council was established 15 years ago with an aim to recover the rich nature in
Kanazawa Hakkei through the restoration of Amamo and to transmit valuable nature and
culture of the sea to future generations. Various sectors, including fishermen, fisheries
research institutes, universities, companies and local schools are cooperating to restore
Amamo beds.
Planting of Amamo
(HP) Kanazawa Hakkei -Tokyo Bay Amamo Bed Restoration Conference: http://www.amamo.org/
The sea is a mirror reflecting our lifestyle.
Contaminants and wastes
generated in our daily lives
are ultimately washed out
to the sea.
Lives of consumers are
connected with the sea via
rivers. It is necessary for us
to live in such a way to
take care of resources and
the environment.
ᾣ
ᾞ
ᾟ
ᾘ
ᾒ
ὲ
Eco-label system has started!
Eco-label shows that the fishery product was caught in a way that gives little impact on the ecosystem
and the sustainability of resources.
In December 2007, Japan’s own eco-label system was established, reflecting the characteristics and
advantages of the Japanese fisheries production and resource management. Products with this eco-label
are scheduled to be on sale by the end of 2008. It is expected that purchasing fishery products with this
eco-label attached will result in conservation of the ecosystem and promotion of the sustainable use of
resources.
(HP) Marine Eco-Label Japan: http://www.melj.jp/
25
Slow Seafood Movement
Neighboring waters of Japan are bountiful seas, where there are both warm and cold currents and which produce various
seafood such as originating from the north or in warm currents. Do you know what kinds of fish are caught and what kinds of
dishes are eaten in your homeland?
Different types of fish are caught according to the four seasons in Japan. When it becomes the time when the fish is most
delicious to eat, we say the fish is “shun” (“in season”). This means that the fish in season is abundant and has high nutritional
value at the same time. The fish are also sold at reasonable prices. Why not enjoy the delicious local fish and feel the change
of seasons?
In season in spring: Pink
In season in summer: Green
In season in fall: Orange
In season in winter: Blue
Atka mackerel
Salmon
Scallop
Codfish
Yellowtail
Swellfish
Sandfish
Japanese common squid
Saury
Snow crab
Spotted mackerel
Short-necked Oyster
clam
Crusian
carp
Sweet fish
Brown seaweed Marbled founder
Spotlined sardine
Japanese jack
mackerel
Kuruma shrimp
Red sea-bream
Tuna
Chub mackerel
Bonito
Let’s cook!
By reading up to here, you might now feel like eating fish. How about making seafood dinner today? Here are
some simple tips to make your daily seafood dishes even more delicious!
Spring
Katsuo-no-tataki (lightly roasted bonito)
䃩Ingredients (for four servings)
Bonito
half a fish
Daikon radish 200g
Garlic
2 cloves
Point!
You can add a slightly
different touch to the dish
by sprinkling on fried
garlic slices and chopped
cashew nuts.
Welsh onion
Ginger
Soy sauce
Pon-zu
8 stems
40g
5 tablespoons
3 tablespoons
㽲 Grate daikon and drain briefly. Slice garlic. Chop welsh onion, and grate ginger.
㽳 Skewer three sticks into bonito. Roast the surface of one side using the highest flame of the stove. Dip it in ice
water to cool and wipe off the water.
㽴 Slice the bonito putting the roasted side up. (Tosa-zukuri)
㽵 Place the bonito slices on a dish. Put grated daikon and ginger evenly on top, sprinkle welsh onion and garlic
and put into the refrigerator.
㽶 Serve with soy sauce mixed with pon-zu.
[HP] Japan Fisheries Association “Fish World”:: http://www.fishworld.or.jp/
JF Zengyoren “The Complete Seafood Recipes”: http://www.jf-net.ne.jp/jf-net/syun/recipe_index.html
26
Summer
Squid saute with garlic
䃩 Ingredients (for four servings)
Japanese common squid
Garlic
Red chili
Celery
Bell peppers (red, yellow)
1
1 clove
1 husk
1 stick
1 each
White wine
Salt
Pepper
Olive oil
½ cup
as needed
as needed
2 tablespoons
䃩 Direction
㽲 Remove arms, insides and skin the squid. Cut the body in rings in widths of about 7-8mm. Cut fins and arms
into adequate sizes.
㽳 Finely chop the garlic. Remove fibers of celery and cut diagonally into widths of about 7-8mm. Chop bell
peppers into pieces of about 1cm size.
㽴 Heat 2 tablespoons olive oil in a frying pan, and saute garlic and red chili. When it becomes aromatic, add squid
and saute until covered evenly with oil. Add celery and bell pepper, pour white wine in and saute thoroughly.
Season with salt and pepper.
Autumn
Point!
Be careful to keep the
garlic from burning.
Rice bowl with lightly fried saury
䃩 Ingredients (for four servings)
Saury
4 fish
Flour
as needed
Cooking oil
3 tablespoons
Green pepper 6 husks
Rice, white sesame as needed
A (seasoning)
Soy sauce 3 tablespoons
Sugar
3 tablespoons
Japanese sake 3 tablespoons
Mirin
3 tablespoons
䃩 Direction
㽲 Remove the head of saury. Cut the stomach diagonally to remove insides and wash thoroughly under
running water. Fillet the saury and coat in flour. Poke a few holes into green pepper with bamboo skewer.
㽳 Heat oil in a frying pan and saute the saury fillet with the skin down. When the surface is browned, turn
over and saute the other side as well. Add green pepper and saute together.
㽴 Briefly wipe off excessive oil and pour in mixed A. Season the fillet evenly.
㽵 Fill the bowl with cooked rice, place 㽴 on top and sprinkle white sesame.
Winter
Point!
Remember to wipe off
excessive oil in 㽴, which
allows the seasoning cover the
saury thoroughly.
Buri-daikon (yellowtail stewed with daikon
radish)
(Mixed seasoning)
䃩 Ingredients (for four servings)
Lean parts of yellowtail 800g
Daikon radish
1 stick
Konbu seaweed
10cm long
Some salt
Water
Japanese sake
Mirin
Soy sauce
Some ginger
6 cups
1 cup
½ cup
½ cup
䃩 Direction
㽲 Cut lean meats of yellowtail into adequate size, sprinkle salt and leave for a while, and blanche to
wash away blood and unclean parts.
㽳 Cut daikon into large rounds. Peel the skin, plane off the corners and boil.
㽴 Cut ginger into fine strips.
㽵 Put konbu, 㽲 and 㽳 into a pot, add mixed seasoning, cover with drop lid and stew.
㽶 When the daikon becomes soft, add soy sauce and stew until the liquid is reduced to about 1/3 of the
original amount.
㽷 Place konbu cooked in 㽶 in the dish, put daikon and yellowtail on it, and sprinkle ginger strips on
top.
Point!
Sprinkling salt and blanching
removes the unpleasant smell
of lean meat. This process is
very important!
To have interest in the sea and marine industry and to enjoy eating
seafood in season results in protecting the fisheries industry and food
culture.
27
北海道水産林務部
Department of Fisheries and Forestry, Hokkaido Government
はじめに
本道は太平洋、日本海、オホーツク海の3つの海に囲まれ、北方に広く展開する大陸棚や、
黒潮から分かれて北上する暖流と北からの親潮(寒流)が交錯する道東太平洋沖などの好漁場
を有しており、ホタテガイやスケトウダラ、サケ、ホッケ、コンブなど様々な水産資源に恵ま
れた我が国最大の水産基地となっています。
道では平成14年に「北海道水産業・漁村振興条例」を制定し、「将来にわたっての安全かつ
良質な水産物の安定的な供給」、「地域を支える活力のある産業としての水産業の発展」、「水産
業の基盤のみならず、自然とのふれあいなど多様な機能を発揮する漁村の発展」という水産業
や漁村の振興を図るための基本理念を定めるとともに、15年から「北海道水産業・漁村振興推
進計画」の基本方針のもとに、施策を展開してきました。
しかしながら、近年は漁業生産の減少や漁業就業者数の減少・高齢化がさらに進んでいるほ
か、若者を中心とした「魚離れ」が問題となっています。その反面、海外では欧米や中国等を
中心に、水産物需要が高まっており、世界人口の増加と相まって、将来の水産物不足が危惧さ
れています。
このため、道では、これら水産業をめぐる情勢の変化や、これまでの施策の効果に関する評
価を踏まえ、20年3月に「北海道水産業・漁村振興推進計画(第2期)」を策定したところで
す。
本道水産業・漁村の振興のためには、条例や計画に基づき、道民の皆さんの声に耳を傾けな
がら、効率的・効果的な施策を展開することが重要です。
本書は、本道の漁業生産やこれに携わる人々の様子、栽培漁業や試験研究の状況などを写真、
グラフ等によってわかりやすく紹介するために作成しました。本書が本道の水産業、漁村のす
がたを理解していただく一助となれば幸いです。
Preface
Surrounded by the Pacific Ocean, the Sea of Japan and the Sea of Okhotsk, and with good fishing grounds
that include a broad continental shelf to the north and an intersection in the Pacific Ocean off eastern
Hokkaido between a warm current flowing northward separately from the Kuroshio current and the Oyashio
Current (cold current) flowing from the north, Hokkaido is Japan’s largest fishery base and abounds in fishery
resources such as scallop, Walleye pollock, Arabesque greenling, salmon and kombu.
In 2002, the Hokkaido Government enacted the "Hokkaido Fisheries and Fishing Villages Promotion
Ordinance" in order to boost fisheries and fishing villages in Hokkaido. The Ordinance clarifies the basic
principles of "ensuring a long-term stable supply of safe and high-quality marine products", "achieving sound
development of fisheries that vigorously supports our local community" and "developing fishing villages that
have various functions including a basis of the fisheries industry as well as a place where people can
experience nature". Since then, measures have been taken to promote the industry, under the philosophy of
the "Hokkaido Fisheries and Fishing Villages Promotion Plan" in 2003.
In recent years, however, fisheries have faced the difficult problems of the decline in fishery production, the
decrease and aging of fishery workers, and the reduced consumption of fish, particularly by young people. At
the same time, with an increase of global population, more concerns have arisen over a shortage of marine
products, stemming from a higher demand in seafood across the world, especially the US, Europe and China.
Following these changes in fishery trend and evaluations of past measures, Hokkaido settled upon the
second term of the "Hokkaido Fisheries and Fishing Villages Promotion Plan" in March 2008.
In order to promote Hokkaido's fisheries and fishing villages, it is vital to follow related ordinances and plans,
to listen to our citizens and to build up efficient and effective measures.
This pamphlet is designed to clarify the current state of fishery production and workers involved with
commercial fishing in Hokkaido as well as the actual conditions of aquiculture and fishery experiments and
research through photographs and graphs. We would be grateful if this pamphlet could help enhance your
understanding of the present situations of fisheries and fishing villages in Hokkaido.
-1-
王蝶(マツカワ)
"Oucho" (barfin flounder)
目
次
Table of Contents
Part1
北海道水産業の概要
1 北海道水産業の位置
2 水産業の生産状況と生産構造
(1)漁業・養殖業生産量
Profile of Hokkaido Fisheries
1 Hokkaido Fisheries Statistics
2 Current Status and Structure of Fisheries Production
(1) Quantities of fishery and aquaculture production
3
5
5
(2)漁業・養殖業生産額
(3)漁業経営体数
(4)漁業就業者数
(2) Value of fishery and aquaculture production
(4) Number of people working in fisheries
6
7
7
(5)漁船数
(5) Number of fishing boats
8
(6)水産加工品生産量
(6) Production of processed marine products
8
Part2
豊かで魅力ある北海道水産業を目指して
(3) Number of fishery management units
Aiming to Create Rich & Attractive Fisheries in Hokkaido
1 栽培漁業の推進
1 Promotion of Stock Enhancement and Farming Fishery
2 資源管理型漁業の展開
3 漁業経営の安定と漁業経営体の育成・確保
2 Establishment of Resource Management-Oriented Fisheries
9
9
3 Stabilization of Fishery Management and Security in Fishery 10
Management Entities
4 安全・安心な水産物の供給と競争力の強化
4 Supply of Safe, Reliable Seafood and Strengthening of
10
Competitiveness
5 環境と調和した水産業の展開と環境保全
5 Development of Environmentally-Sustaining Fisheries and
11
Environmental Conservation
6 快適で活力ある漁村地域の創出
6 Creation of Comfortable, Vital Fishing Villages
11
7 試験研究の充実強化と技術普及
7 Enhancement of Research and Experimentation and
12
Dissemination of Technologies
8 国際漁業の情勢
8 International Fishery Trends
-2-
12
Part1
Part1
1
北海道水産業の概要
Profile of Hokkaido Fisheries
北海道水産業の
北海道水産業の位置
本道の水産業の全国に占める割合をみると、漁業生産量(属人)は26.6%、漁業生産額(属人)は19.2%、水産加工品生産量(陸
上加工)は19.1%で、また、漁業経営体数、漁業就業者数、漁船数(海水動力漁船)も1割を超えており、本道は我が国最大の水
産基地となっています。
1 Hokkaido Fisheries Statistics
Hokkaido is Japan's largest fishery base as described in its various fishery ratios vis-a-vis the national totals:26.6% in quantity of catches (by Hokkaido
fishermen only); 19.2% in the value of catches (by Hokkaido fishermen only); 19.1% in production of processed marine products (land processing); and over
10% in the number of fishery management units, people working in fisheries and motorized fishing boats.
海面漁業・
海面漁業・養殖業生産量 平成20
平成20年
20年
Production volume of marine fisheries and aquaculture 2008
■全 国
■北海道
26.6%
5,515千トン
1,465千トン
(資料:農林水産省統計部「漁業・養殖業生産統計年報 」
)
■ National
■ Hokkaido
5,515,000 tons
1,465,000 tons
Source: "Annual Statistics on Fishery and Aquaculture Production"
by Statistics Department, Ministry of Agriculture, Forestry and Fisheries
海面漁業・
海面漁業・養殖業生産額 平成20
平成20年
20年
19.2%
Production value of marine fisheries and aquaculture 2008
■全 国
■北海道
15,421億円
2,958億円
(資料:農林水産省統計部「漁業・養殖業生産統計年報 」
)
■ National
■ Hokkaido
1,542.1 billion
295.8 billion
Source: "Annual Statistics on Fishery and Aquaculture Production"
by Statistics Department, Ministry of Agriculture, Forestry and Fisheries
水産加工品生産量(
水産加工品生産量(陸上加工)
陸上加工) 平成20
平成20年
20年
Production of processed marine products (land processing) 2008
■全 国
■北海道
19.1%
3,890千トン
743千トン
(資料:農林水産省統計部「水産物流通統計年報」等)
■ National
■ Hokkaido
3,890,000 tons
743,000 tons
Source: "Annual Statistics on Marketing of Fishery Products"
by Statistics Department,Ministry of Agriculture, Forestry and Fisheries
漁協数(
漁協数(沿岸地区漁業協同組合)
沿岸地区漁業協同組合) 平成20
平成20年
20年
Number of coastal water fishery cooperatives 2008
■全 国
■北海道
1,094組合
74組合(平成22年4月1日現在は72組合)
(資料:水産庁「水産業協同組合年次報告」等)
■ National
■ Hokkaido
1,094
74(72as of April 1,2010)
Source: "Annual Report on Fishery Cooperatives" by Fisheries Agency
-3-
6.8%
漁業経営体数 平成20
平成20年
20年
12.8%
Number of fishery management units 2008
■全 国
■北海道
115,196経営体
14,780経営体
(資料:農林水産省北海道農政事務所統計部「北海道農林水産統計年報」
)
■ National
■ Hokkaido
115,196
14,780
Source: "Annual Report on Agricultural, Forestry and Fisheries Statistics in Hokkaido"
by Statistics Department, Hokkaido District Agliculture Office,
Ministry of Agriculture, Forestry and Fisheries
漁業就業者数 平成20
平成20年
20年
19.1%
Number of people working in fisheries 2008
■全 国
■北海道
221,908人
33,568人
(資料:農林水産省北海道暴政事務所統計部「北海道農林水産統計年報」
)
■ National
■ Hokkaido
221,908
33,568
Source: "Annual Report on Agricultural, Forestry and Fisheries Statistics in Hokkaido"
by Statistics Department,Hokkaido District Agliculture Office,
Ministry of Agriculture, Forestry and Fisheries
9.8%
漁港数 平成20
平成20年
20年(平成20年4月1日現在)
Number of fishing ports 2008 (as of April 1, 2008)
■全 国
■北海道
2,921港
285港
(資料:水産庁漁港漁場整備部)
■ National
■ Hokkaido
2,921
285
Source: Fisheries Infrastructure Department, Fisheries Agency
漁船数(
漁船数(海水動力漁船)
海水動力漁船) 平成20
平成20年
20年(平成20年12月31日現在)
10.4%
Number of motorized fishing boats 2008 (as of December 31, 2008)
■全 国
■北海道
289,456隻
30,062隻
(資料:水産庁「漁船統計表 」
)
■ National
■ Hokkaido
289,456
30,062
Source: "Annual Statistics on Fishing Vesseles" by Fisheries Agency
※生産量・額は北海道水産林務部「北海道水産現勢」による属地統計
※ Quantity and value of catches are based on statistics within territories as described in the
(属地統計:漁獲量・額を水揚げされた地域に計上したもの。水揚げした経営体の所
在地域に計上したものは属人統計といい、農林水産省統計部「漁業・養殖業生産統計
“Annual Statistics on Fishery and Aquaculture Production in Hokkaido”by the Department
of Fishries and Forestry,Hokkaido Government.
年報」はこれによる。
)
.(Statistics within territories:Statistics within territories refer to the quantity and value of catches added up to
harvesting districts. Those added up to areas where harvesting fishery establishments are located are referred to
as statistics by Hokkaido fishermen only,which is applicable to the “ Annual Statistics on Fishery and
Aquaculture Production ”by the Statistics Department,Ministry of Aqriculture, Forestry and Fisheries.)
-4-
北海道水産業の概要
Part1
Part1
Profile of Hokkaido Fisheries
2 水産業の
水産業の生産状況と
生産状況と生産構造
2 Current Status and Structure of Fisheries Production
(1)Quantities of fishery and aquaculture production
(whitin territories)
(1)漁業・
漁業・養殖業生産量(
養殖業生産量(属地)
属地)
平成20年の本道の海面漁業・養殖業生産量は141万トンで、
前年に比べて2万1千トン(1.5%)減少しています。
本道の生産量は、昭和62年に過去最高の316万トンを記録
しましたが、その後、国際的な漁業規制の強化やイワシの資源
水準の大幅な低下などから急激に減少し、平成5年までの6年間
で2分の1程度にまで落ち込みました。
それ以後、持ち直しの動きも見られましたが、ここ数年は、
140万トン前後の低い水準で推移しています。
平成20年の海面漁業・養殖業生産量のベスト5は次のとおり
です。
① ホタテガイ
42万9千トン
② スケトウダラ 19万1千トン
③ ホッケ
16万5千トン
④ サケ
13万トン
⑤ サンマ
13万トン
Hokkaido's production volume by marine fisheries and aquaculture was 1.41
million tons in 2008, a decline of 21,000 tons (1.5%) from the previous year.
The catch reached an all-time high of 3.16 million tons in 1987, but has
declined due to reinforced restrictions on international fishing operations and
the drastic decline of the sardine resource level. It was almost halved over the
six years until 1993.
Although there were some signs of recovery, Hokkaido's production remains
low with 1.4 million tons during the past few years.
The top five fish caught in 2008 were as follows:
①
②
③
④
⑤
Scallop
Walleye pollock
Arabesque greenling
Salmon
Saury
生産量の
生産量の推移(
推移(属地)
属地)
3,500
Production volume by fish species (within territories)
沖合・遠洋漁業
Offshore and Pelagic Fishery
沿岸漁業
Coastal Fishery
3,13 5
(Unit: 1,000tons)
魚種別生産量(
魚種別生産量(属地)
属地)
Production volume in fishery (within territories)
千トン
(Unit: 1,000tons)
429
191
165
130
130
3,000
13.1%
30.4%
6.1%
2,500
2,000
1,982
1 ,621
1,65 0
518
589
1,6 68
437
1,103
1,061
1,231
1,500
6.7%
412
1,000
500
1,153
141万トン
(1,410)
1,4 10
9.2%
998
13.6%
9.2%
0
S63
(1988)
H5
(1993)
H10
(1998)
H15
(2003)
11.7%
H20
(2008) 年
ホタテガイ
scallop
スケトウダラ
walleye poliock
ホッケ
arabesque greenling
サケ
salmon
サンマ
saury
コンブ
kombu
スルメイカ
japanise common squid
その他
others
(Unit:1,000tons)
各海域の
各海域の生産量(
生産量(属地)
属地)
日本海海域(
日本海海域 (稚内市~
稚内市~ 函館市(
函館市( 旧椴法華村))
オホーツク海海域
オホーツク海海域(
海海域( 斜里町~
斜里町~ 猿払村)
猿払村)
Sea of Japan Area (Wakkanai City ~ Hakodate City (former Todohokke))
Sea of Okhotsk Area (Syari Town ~ Sarufutsu Village)
15.3%
2.5%
3.9%
38.4%
30万2千トン
(302)
6.7%
6.7%
12.2%
14.3%
(Unit:1,000tons)
ホッケ
arabesque greenling
ホタテガイ
scallop
スルメイカ
japanise common squid
コンブ
kombu
スケトウダラ
walleye poliock
イカナゴ
japanese sand lance
ミズダコ
north pacific giant octopus
その他
others
0.9%
0.8%
2.3%
4.8%
6.7%
9.7%
37万9千トン
(379)
11.4%
63.6%
(Unit:1,000tons)
ホタテガイ
scallop
サケ
salmon
ホッケ
arabesque greenling
スケトウダラ
walleye poliock
マス
trout
イカナゴ
japanese sand lance
スルメイカ
japanise common squid
その他
others
えりも以西太平洋海域
えりも 以西太平洋海域(
以西太平洋海域( 函館市(
函館市(旧南茅部町)~
旧南茅部町 )~えりも
)~ えりも町
えりも町 )
えりも以東太平洋海域
えりも 以東太平洋海域(
以東太平洋海域 (広尾町~
広尾町 ~羅臼町)
羅臼町 )
Pacific Ocean Area West of Erimo (Hakodate City (former Minamikayabe Town)~Erimo Town)
Pacific Ocean Area East of Erimo (Hiroo Town ~ Rausu Town)
1.2%
1.8%
9.6%
7.3%
35.9%
11.5%
31万トン
(310)
11.8%
20.9%
(Unit:1,000tons)
ホタテガイ
scallop
スケトウダラ
walleye poliock
スルメイカ
japanise common squid
コンブ
kombu
サケ
salmon
カタクチイワシ
japanese anchovy
ホッケ
arabesque greenling
その他
others
2.8%
12.3%
30.0%
4.3%
8.0%
41万9千トン
(419)
9.2%
14.1%
19.4%
(Unit:1,000tons)
サンマ
saury
スケトウダラ
walleye poliock
サケ
salmon
コンブ
kombu
ホタテガイ
scallop
タラ
pacific cod
コマイ
saffron cod
その他
others
資料:北海道水産林務部「北海道水産現勢」 Source: ”Annuall Statistics on Fishery and Aquaculture Production in Hokkaido" by Department of Fisheries and Forestry,Hokkaido Government
-5-
(2)Value of fishery and aquaculture production
(whitin territories)
(2)漁業・
漁業・養殖業生産額(
養殖業生産額(属地)
属地)
平成20年の本道の海面漁業・養殖業生産額は2,806億円で
前年に比べて95億円(3.3%)増加しています。
本道の生産額は、平成3年に過去最高の4,065億円を記録し
ました後、イワシやスケトウダラの生産量の減少、ホタテガイ
や秋サケの価格の低下などから減少しており、ここ数年は、秋
サケの価格回復やナマコの価格向上などによりやや上向いたも
のの、3,000億円を下回る水準で推移しています。
平成20年の海面漁業・養殖業生産額のベスト5は次のとおり
です。
①
②
③
④
⑤
サケ
ホタテ
コンブ
スケトウダラ
スルメイカ
549億円
540億円
263億円
220億円
157億円
Hokkaido's value of catch by marine fisheries and aquaculture was 280.6
billion JPY in 2008, a decline of 9.5 billion yen (3.3%) from the previous
year.
After the peak of 406.5 billion yen in 1991, Hokkaido has suffered a slump
in the value of catches. This is mainly due to the reduced production
quantities of sardines and walleye pollock and the lower prices of scallops and
autumn salmon.
Values over the recent years remain less than 300 billion yen, though higher
prices for autumn salmon and sea cucumber slightly increase the total figure.
The top five fish in production value of marine fisheries and aquaculture in
2008 are as follows:
①
②
③
④
⑤
Salmon
Scallop
Kombu
Walleye pollock
Japanese commom squid
生産額の
生産額の推移(
推移(属地)
属地)
4,000
3,7 85
3,500
796
3,000
2 ,758
568
2,500
553
21.2%
28.6%
2,80 6
2,30 9
420
2,806億円
(280.6)
344
2,000
1,500
Production value by fish species (within territories)
沖合・遠洋漁業
Offshore and Pelagic Fishery
沿岸漁業
Coastal Fishery
3 ,238
2,989
2,670
2,205
1,000
3.9%
2,386
1,965
19.3%
4.2%
5.6%
500
0
S63
(1988)
H5
(1993)
H10
(1998)
(Unit: billion yen)
魚種別生産額(
魚種別生産額(属地)
属地)
Production value in fishery (within territories)
億円
(Unit: hundred million yen)
54.9
54.0
26.3
22.0
15.7
H15
(2003)
7.9%
H20
(2008) 年
9.4%
サケ
salmon
ホタテガイ
scallop
コンブ
kombu
スケトウダラ
walleye poliock
スルメイカ
japanise common squid
サンマ
saury
ホッケ
arabesque greenling
その他
others
(Unit: billion yen)
各海域の
各海域の生産額(
生産額(属地)
属地)
日本海海域(
日本海海域 (稚内市~
稚内市~ 函館市(
函館市( 旧椴法華村))
オホーツク海海域
オホーツク海海域(
海海域( 斜里町~
斜里町~ 猿払村)
猿払村)
Sea of Japan Area (Wakkanai City ~ Hakodate City (former Todohokke Village))
Sea of Okhotsk Area (Syari Town ~ Sarufutsu Village)
13.5%
37.6%
10.8%
636億円
(63.6)
10.7%
9.0%
4.9%
5.7%
7.8%
(Unit: billion yen )
スルメイカ
japanise common squid
ホッケ
arabesque greenling
コンブ
kombu
ナマコ
sea cucumber
ホタテガイ
scallop
ミズダコ
north pacific giant octopus
キタムラサキウニ
northern sea urchin
その他
others
1.9%
2.7%
10.5%
3.3%
3.8%
646億円
(64.6)
4.5%
44.0%
29.4%
(Unit: billion yen )
ホタテガイ
scallop
サケ
salmon
スケトウダラ
walleye poliock
マス
trout
ケガニ
hair crab
ホッケ
arabesque greenling
ミズダコ
north pacific giant octopus
その他
others
えりも以西太平洋海域
えりも 以西太平洋海域(
以西太平洋海域( 函館市(
函館市(旧南茅部町)~
旧南茅部町 )~えりも
)~ えりも町
えりも町 )
えりも以東太平洋海域
えりも 以東太平洋海域(
以東太平洋海域 (広尾町~
広尾町 ~羅臼町)
羅臼町 )
Pacific Ocean Area West of Erimo (Hakodate City (former Minamikayabe Town)~Erimo Town)
Pacific Ocean Area East of Erimo (Hiroo Town ~ Rausu Town)
17.2%
23.6%
2.4%
3.3%
631億円
(63.1)
8.1%
16.7%
12.9%
15.9%
(Unit: billion yen )
ホタテガイ
scallop
サケ
salmon
コンブ
kombu
スケトウダラ
walleye poliock
スルメイカ
japanise common squid
ヤナギダコ
chestnut octopus
ツブ類
whelk
その他
others
20.1%
31.3%
2.2%
862億円
(86.4)
6.5%
6.7%
13.2%
9.6%
10.3%
(Unit: billion yen )
サケ
salmon
サンマ
saury
コンブ
kombu
スケトウダラ
walleye poliock
タラ
pacific cod
ホタテガイ
scallop
エゾバフンウニ
short-spined sea urchin
その他
others
資料:北海道水産林務部「北海道水産現勢」 Source:”Annuall Statistics on Fishery and Aquaculture Production in Hokkaido" by Department of Fisheries and Forestry,Hokkaido Government
-6-
北海道水産業の概要
Part1
Part1
(3)漁業経営体数
3 Number of fishery management units
There were 14,780 fishery management entities in 2008; of those, entities
that engaged in coastal fishing numbered 13,904 (94.1%).
By size of fishing boat, those using motorized fishing boats under 10 tons
(including fishery management units using non-motorized fishing boats and
those without using fishing boats) accounted for 67.9% at 10,041.
Due to business suspension and discontinuance caused by the aging of the
fishing population and lack of successors, the number of fishery
management units has continued to decrease since 1985.
平成20年における本道の漁業経営体数は14,780で、このう
ち、沿岸漁業層経営体数は13,904で94.1%を占めています。
また、漁船規模別にみると、10トン未満の動力漁船を使用し
ている経営体(無動力漁船を使用している経営体及び漁船非使
用の経営体を含む。
)が10,041で67.9%を占めています。
漁業経営体数は高齢化や後継者不足に伴う休廃業などから昭
和60年以降減少しています。
漁業経営体数の
漁業経営体数の推移
Number of fishery management units
23 ,22 2
217
1,345
25,000
100
100tons or over
18 ,92 7
3,524
20,000
148
951
1,641
10
14 ,78 0
3,025
15,000
85
791
1,655
1,347
16,148
12,882
Coastal Fishery
9,748
5,000
347
0
資
Marine culture
Offshore and
Pelagic Fishery
2,516
10,000
S63
(1988)
H10
(1998)
H15
(2003)
料:農林水産省統計部「漁業センサス」
Set-net fishery and
others
10
Below 10tons
Non-use,nonmotorized
fishing boats
293
266
H5
(1993)
10 100
100tons
H20
(2008)
Source: “Fishery Census” by Statistics Department , Ministry of Agriculture, Forestry and Fisheries
注:平成20年はデータの集計方法が異なっており、他の年と単純に比較できない
Note: The method of collecting data used in 2008 was different from the method used in other years; therefore
a simple comparison cannot be made between thefigures for 2008 and figures for other years.
(4)漁業就業者数
4 Number of people working in fisheries
The number of people working in fishery was 33,568 in 2008: 28,862
(86%) were male.
Out of all the male fishery workers, 32.4% were 60 years old or over,
signalling that the industry continues to face an aging population.
平成20年における本道の漁業就業者数は33,568人で、男女
別にみると、男子が28,862人で86%を占めています。
また、男子就業者に占める60歳以上の割合は32.4%となっ
ており、漁業者の高齢化が進んでいます。
漁業就業者数の
漁業就業者数の推移
Number of people working in fisheries
50,000
43,688
Women
45,000
40,000
35,000
5,412
33,568
60
Men: age 60 and over
4,299
4,706
40 59
Men: age 40 59
10,220
9,349
25 39
Men: age 25 39
8,414
30,000
25,000
32,878
17,175
20,000
15,000
10,000
資
11,881
11,499
9,532
5,000
0
15 24
Men: age 15 24
5,991
5,459
3,155
S63
(1998)
1,401
H5
(1993)
H10
(1998)
料:農林水産省統計部「漁業センサス」
注:平成20年はデータの集計方法が異なっており、他の年と単純に比較できない
1,641
H15
(2003)
H20
(2008)
Source: “Fishery Census” by Statistics Department , Ministry of Agriculture, Forestry and Fisheries
Note: The method of collecting data used in 2008 was different from the method used in other years; therefore
a simple comparison cannot be made between thefigures for 2008 and figures for other years.
-7-
(5)Number of fishing boats (motorized fishing boats)
(5)漁船数(
漁船数(海水動力漁船)
海水動力漁船)
There were 30,062 registered shipping boats in Hokkaido in 2008,decreasing
by 686 (2.2%) from the previous year. The number has declined annually
after recording an all-time high of 51,138 in 1980.
By tonnage, fishing boats below 3 tons, which are used primarily for
shellfish and seaweed gathering fishery (both shallow-water gathering fishery
and aquaculture) and gill net fishery, accounted for 74.2% of the total at
22,294.
By material, FRP (fiber reinforced plastic) boats accounted for 94.9% at
28,514, and the construction of light alloy ships (aluminum boats) has
increased recently.
平成20年における海水動力漁船隻数は30,062隻で、前年に
比べて686隻(2.2%)減少しており、昭和55年の51,138隻
をピークとして減少傾向が続いています。
規模別にみると、採介藻漁業(浅海における海藻、貝類の採
取及びその養殖業)や刺し網漁業に使用される3トン未満の漁
船が22,294隻で全体の74.2%を占めています。
また、材質別にみると、FRP(繊維強化プラスチック)船が
28,514隻で全体の94.9%を占めていますが、近年は軽合金船
(アルミ船)の建造が増えています。
漁船数の
漁船数の推移
Number of fishing boats
隻
46,515
(規模別) By size
50,000
723
1,803
38,622
347
1,596
8,049
40,000
30,062
7,221
184
1,408
30,000
20トン以上
20tons or over
10~20トン
10~20tons
3~10トン
3~10tons
3トン未満
Below 3tons
隻
(材質別) By material
50,000
1,435
413
792
40,000
769
379
34,760
30,000
軽合金船
Light alloy boats
鋼船
Steel boats
FRP船
FRP boats
木船
Wooden boats
6,176
20,000
35,028
20,000
35,940
28,514
29,458
22,294
10,000
10,000
10,320
2,389
0
資
S 63
(1988)
H5
(1993)
H 10
(1998)
H15
(2003)
料:北海道水産林務部「北海道漁船統計表」
0
H 20
(2008) 年
S 63
(1988)
H5
(1993)
H 10
(1998)
400
H 20
(2008) 年
H15
(2003)
Source:"Statistical Table for Fishing Boats in Hokkaido" by Department of Fisheries and Forestry, Hokkaido Government
(6)Production of processed marine products (land processing)
(6)水産加工品生産(
水産加工品生産(陸上加工)
陸上加工)
There were 1,079 seafood manufacturers in 2008, a decline of 18 (1.6%)
from the previous year. The figure continues to drop.
The production of processed marine products (on land) in Hokkaido in 2008
was 743,000 tons.
The breakdown of processed marine products for the year showed that
frozen marine products accounted for 58.0% of the total at 431,000 tons,
followed by salted products (83,000 tons; 11.2%) and feed and fertilizer
(41,000 tons; 5.6%).
平成20年の水産食品製造事業所数は1,079で、前年に比べ
て18(1.6%)減少しており、年々減少する傾向にあります。
また、平成20年における水産加工(陸上加工)品の生産量は
74万3千トンとなっています。
このうち、冷凍水産物が43万1千トンで58.0%を占めてお
り、これに続いて塩蔵品が8万3千トンで11.2%、飼肥料が4
万1千トンで5.6%なっています。
水産食品製造事業所数の
水産食品製造事業所数の推移
水産加工品生産量の
水産加工品生産量の推移
Number of seafood manufacturers
Production of processed marine products
(Unit:1,000tons)
千トン
1,800
事業所数
1,600
1,437
1,373
冷凍水産物
Frozen products
1 ,6 7 3
塩蔵品
Salted products
1,600
1,400
1,400
1,079
1,200
595
1,000
1,000
800
800
600
600
400
400
飼肥料
Feed and fertilizer
1 ,0 5 4
1,200
192
油 脂
Fats and oils
743
584
冷凍食品
Frozen foods
422
200
0
資
200
S63
(1998)
H5
(1993)
H10
(1998)
H15
(2003)
0
H20
(2008) 年
料:北海道総合政策部「工業統計調査結果」
資
431
133
266
30
11
25
41
174
168
S63
(1988)
21
117
H5
(1993)
H10
(1998)
83
144
H15
(2003)
その他
other
32
H20
(2008) 年
料:農林水産省北海道暴政事務所「北海道農林水産統計年報」
(財)日本水産油脂協会「水産油脂統計年鑑」
Source: "Census of Manufacturers report" by Department of Policy Planning and Coordination,
注:平成15年以降はデータの集計方法が異なっており、他の年と単純に比較できない。
Hokkaido Government
Source:“Annual Report on Agricultural, Forestry and Fisheries Statistics in Hokkaido” by Statistics Department,
Hokkaido District Agriculture Office, Ministry of Agriculture, Forestry and Fisheries
"Statistical Yearbook on Oil and Fat from Fishery Products" by Japan Marine Oil Association
Note:The method of collecting data used after 2003 was different from the method used in other year
therefore a simple comparison cannot be made between the figures.
-8-
かで魅力
魅力ある
ある北海道水産業
北海道水産業を
目指して
豊かで
魅力
ある
北海道水産業
を目指
して
Part2
Part2
Aiming to Create Rich & Attractive Fisheries in Hokkaido
1 栽培漁業の
栽培漁業の推進
本道では、サケ・マスのふ化放流やホタテガイの地まき放流・養殖、コンブの養殖などが盛んに行われており、これ
らは本道の基幹漁業となっています。
また、各地でウニの種苗放流が行われているほか、日本海のヒラメ、ニシン、アワビ、えりも以西太平洋のマツカワ※
の種苗生産・放流など、海域の特性に応じた栽培漁業が行われています。
さらに、近年急激に需要が高まっているナマコの資源を増やすため、道や漁協が協力し、栽培漁業技術の開発に取り
組んでいます。
※マツカワ:ブランド名「王蝶(おうちょう )
」で売り出し中の大型のカレイ
1 Promotion of Stock Enhancement and Farming Fishery
The hatching and releasing of salmon and trout, seabed releases and cultivation of scallops and kombu, etc. have been flourishing in Hokkaido, making up the key
fishery of the prefecture.
Stock enhancement varies from seed release of sea urchins in many places to seed production and release of Japanese flounder, herring and abalone in the Sea of
Japan, and of Barfin flounder in the Pacific Ocean area west of Erimo Town, respectively.
More recently, demand for sea cucumber has increased drastically. In order to increase the resource quantity, the Hokkaido Government, together with
fishermen's cooperatives, works on the development of the technology in its enhancement.
* Barfin flounder: a large species of flounder, with the brand name of "Oucho (king flounder)"
種苗の
放流実績( シロサケ)
シロサケ)
種苗の放流実績(
種苗放流一覧(
種苗放流一覧( 主要魚種)
主要魚種 )
Past record on seed releasing(Chum salmon)
A list of seed releasing (major fish)
(U n it :M illio n )
百 万 尾
1 ,5 0 0
1 ,1 1 4
1 ,0 4 4
1 ,2 0 0
900
1 ,0 2 1
985
600
S63
(1988 )
H5
(19 93)
H 10
(1998)
H 15
(2 003)
4 ,737
5,540
4 ,809
6,4 53
ヒ ラメ
japane se flou nder
2,34 2
1 ,158
2,482
1 ,786
2,7 63
17 3
138
1,330
1 ,449
1,4 99
2,94 3,67 3
2 ,895 ,425
3,07 4,998
3 ,186 ,453
3,1 91,5 39
5 6,74 1
56 ,075
5 3,564
52 ,364
51,8 15
エゾ バ フンウ ニ
sho rt-spined sea urch in
H 20
(2008) 年
料:独立行政法人水産総合研究センターさけますセンター
資
北海道立総合研究機構さけます・内水面水産試験場
単 位: 千 尾、 千 個 (Un it:1 000)
H18
H1 9
H20
(200 6)
(2007 )
(2008)
4,01 4
ホ タテ ガ イ
scallop
0
H17
(2 005 )
ニシ ン
herrung
マツ カワ
barfin flo und er
300
資
H 16
(2004)
区 分
料:(社)全国豊かな海づくり推進協会「栽培漁業種苗生産、入手・放流実績」
Source: “Materials on the production and release of fingerlings for stock enhancement”
Source: Incorporated Administrative Agency National Salmon Resources Center, Fisheries Research Agency;
by the National Association for the Promotion of Productive Seas
and Hokkaido Research Organization, Salmon and Freshwater Fisheries Reseach Institute
2 資源管理型漁業の
資源管理型漁業の展開
本道周辺水域の水産資源は総じて減少しており、今後、漁業経営や水産物供給の安定を図るためには、資源管理型漁
業のより積極的な展開が必要です。
道では、行政・研究機関等で構成する「水産資源管理会議」において検討された主要23魚種の資源評価と管理方法な
どを「北海道水産資源管理マニュアル」として周知するなど、資源管理型漁業の促進に努めています。
2 Establishment of Resource Manegement-Oriented Fisheries
In recent years, fishery resources in the seas surrounding Hokkaido have been decreasing. Given such circumstances, further promotion of resource
management-oriented fisheries will be required to ensure stable fishery management as well as a stable supply of marine products.
The Hokkaido Government has strived to promote resource management-oriented fisheries. As part of the efforts, government officials, researchers and other
related members met at the Marine Resource Management Conference to define the methods of evaluating and managing 23 key fish species. Those methods are
now available in the Manual for Management of Fishery Resources in Hokkaido.
北海道水産資源管理マニュアル
北海道水産資源管理マニュアル(
マニュアル( 北海道水産林務部)
北海道水産林務部)
資源管理(
資源管理(ケガニの
ケガニの 検量)
検量)
The Manual for Management of Fishery Resources in Hokkaido
(Department of Fisheries and Forestry, Hokkaido Government)
Resource management by measurement of hair crab
-9-
3 漁業経営の
漁業経営の安定と
安定と漁業経営体の
漁業経営体の育成・
育成・確保
本道の漁業経営は、漁獲量の減少や燃料価格の高騰による漁業経費の増大などから厳しい状況にあるほか、漁業就業
者の減少・高齢化等が課題となっています。
道では、漁業経営の体質強化に向けた取組を促進するとともに、道立漁業研修所において漁業者や後継者の技術修得
研修を行っています。また、道内各地では、担い手の確保や育成に向け、市町村や漁協の連携による様々な取組が行わ
れています。
3 Stabilization of Fishery Management and Security in Fishery Management Entities
Fishery management in Hokkaido is experiencing severe hardships with the decline of catches, in addition to higher expenses followed by a rise in fuel prices.
The fewer number and aging of fishery workers are also serious concerns.
In order to overcome these challenges, the Hokkaido Government promotes actions towards stronger fishery management, and provides both active and
prospective fishery workers with training programs.
Various efforts are also conducted by municipal governments and fishermen's cooperatives, hoping to secure the workforce.
漁業経営体数及び
漁業経営体数及び 高齢比率の
高齢比率の推移
漁業研修所の
漁業研修所の研修の
研修 の様子
Number of fishery management entities and the rate of aging of fishery workers
経 営体
27 .5 %
2 5 ,0 0 0
2 3.5 %
3 0 .0 %
23 .1 %
2 0 ,0 0 0
1 7 .3%
1 5 ,0 0 0
A training session at the fishery training institute
2 5 .0 %
2 0 .0 %
1 2.2%
1 5 .0 %
1 0 ,0 0 0
1 0 .0 %
5 ,0 0 0
23 ,2 22
2 0 ,8 80
1 8 ,9 27
1 6,50 0
1 4 ,78 0
S63
(1 9 8 8 )
H5
(1 9 9 3 )
H10
(1 9 9 8 )
H1 5
(2 0 0 3 )
H2 0
(2 0 0 8 ) 年
0
5 .0 %
0 .0 %
漁業経営体
Fis h e ry m an age m e n t e n t ity
男 子 漁 業 就 業 者 に占 め る 6 5歳 以 上 の 割 合
P e rc e n tage o f m ale fish e ry w o r ke r s 6 5 ye ar s o ld o r o ve r
資
料:農林水産省統計部「漁業センサス」
注:平成20年はデータの集計方法が異なっており、他の年と単純に比較できない。
Source: "Fishery Census" by Statistics Department, Ministry of Agriculture, Forestry and Fisheries
Note: The method of collecting data used in 2008 was different from the method used in other years; therefore a simple comparison cannot be made between the figures for 2008 and figures for other years.
4 安全・
安全・安心な
安心な水産物の
水産物の供給と
供給と競争力の
競争力の強化
近年、国内では食の安全・安心に対する関心が高まる一方、全世代で「魚離れ」が進んでいることから、道内各地で
衛生管理体制の整備等による水産物の高品質化の取組や漁業者等によるPR活動、食育活動などを通じた愛食運動が行
われています。
また、世界的に水産物需要が増大する中、国内消費の拡大や輸出増大に向けた取組が進められています。
4 Stabilization of Fishery Management and Improvement of Fishery Cooperatives Management Base
Today in Japan, a stronger interest in food safety and reliability does not result in larger fish consumption. There is a series of programs running in an effort to
encourage people to eat safer and more tasty seafood: quality improvement of seafood with hygiene control systems, promotional activities by fishery workers, and
diet education as well as other food campaigns.
Looking at increasing worldwide demands for seafood, Hokkaido has strived to expand both domestic and international consumption of local marine products.
漁業者による
漁業者 による出前事業
による 出前事業の
出前事業の様子
「 魚介類及び
魚介類及び同調整品」
同調整品 」の道内港からの
道内港からの輸出額
からの輸出額
A lecture on demand, given by a fisherman
Change in export value of "seafood" and "prepared seafood" from Hokkaido ports
中 国以 外向 け
Expo rt value to c o u n trie s th an Ch in a
中 国向 け
Expo rt value to Chin a
(Un it: millio n ye n )
百 万円
3 5 ,0 00
3 0 ,0 00
11,587
2 5 ,0 00
1 5 ,0 00
13,470
10,074
22,648
1 0 ,0 00
5 ,0 00
14,284
9,661
2 0 ,0 00
11,297
16,202
19,358
10,750
0
H1 6
(2 0 0 4)
資
- 10 -
料:函館税関
H1 7
(2 0 0 5)
Source: Hakodate Customs
H1 8
(2 0 0 6)
H1 9
(2 0 0 7)
H2 0
(2 0 0 8)
年
かで魅力
魅力ある
ある北海道水産業
北海道水産業を
目指して
豊かで
魅力
ある
北海道水産業
を目指
して
Part2
Part2
Aiming to Create Rich & Attractive Fisheries in Hokkaido
5 環境と
環境と調和した
調和した水産業
した水産業の
水産業の展開と
展開と環境保全
水産資源を維持増大して持続的に漁業を行うためには、水産資源の生息環境を保全する取組や、漁業に大きな被害を与えているト
ド等の野生生物との共存対策が必要です。
道内各地で漁業者等が連携し、磯焼け解消に向けた取組や藻場・干潟の保全活動、植樹活動、外来魚の駆除等が進められています。
5 Development of Environmentally-Sustaining Fisheries and Environmental Conservation
It is essential for sustainable fishery with equivalent and larger resources to safeguard favourable habitats for marine resources. Measures must be introduced to
make the industry coexist with wild animals: Steller's sea lions have thus far presented significant damages for the industry.
In cooperation with fishery workers across Hokkaido, the government is making countermeasures against rocky shore denudation, while taking actions to protect
seaweed beds and tidal wetlands, planting trees, and exterminating introduced fish species.
トドによる
による 漁業被害の
漁業被害の推移
トド による漁業被害
藻場の
保全活動(
岩盤清掃)
藻場
の保全活動
(岩盤清掃
)
Change in the fishery damage caused by Steller's sea lion
漁具 被 害 額
V alue of d am a ge caused to
fishing gear
漁獲 物 被 害 額
V alue of d am a ge caused to
caughe m a rine p roducts
(U nit: m illiom yen)
百万円
1 ,800
1 ,600
1,612
1,480
1,481
76 9
7 30
8 09
71 1
16
(2 00 4)
17
(20 05 )
1,481
1 ,400
1 ,200
Cleaning bedrock, as a part of seaweed bed maintenance
8 03
1 ,000
1,40 5
70 3
5 80
7 09
77 8
8 25
18
(2 00 6)
19
(2 007 )
20
(20 08)
8 00
6 00
4 00
2 00
0
資
料:北海道水産林務部
年
Source: Department of Fisheries and Forestry, Hokkaido Government
注:トド来遊期の10月から6月までを集計
Note: The data was collected from October to June each year, when Steller's sea lions make their annual migration to Hokkaido.
6 快適で
快適で活力ある
活力ある漁村地域
ある漁村地域の
漁村地域の創出
快適で活力ある漁港・漁村づくりを進めるため、漁船の係留や水産物の陸揚に必要な漁港の基本施設の整備に加え、漁業集落排水
施設や防風防除施設などの就労・生活環境の整備が進められています。
また、海洋性レクリエーションや体験漁業など、漁村に対するニーズの高まりから、道内では海を生かして地域を活性化させる取
組が進められています。
6 Creation of Comfortable, Vital Fishing Villages
Infrastructure is under development to build better boat mooring and unloading facilities, in an effort to create comfortable, lively fishing ports and villages.
Drainage facilities, windbreaks and snowbreaks are also installed for better working and living environments in fishing communities.
Meanwhile, many sea-focused programs have been introduced to revitalize the community. They are backed by a higher need for fishing villages with marine
recreation and hands-on fishery experience.
屋根付き
屋根付 き岸壁(
岸壁 (標津漁港)
標津漁港)
体験漁業の
体験漁業の取組
Roofed quay, Shibetsu Fishing Port
Hands-on fishing approach
- 11 -
7 試験研究の
試験研究の充実強化と
充実強化と技術普及
道では、本道水産業の持続的な発展にむけて、水産資源の増養殖・管理に関する技術開発や付加価値の高い製品づくり、環境保全
のための調査・研究を推進するとともに、知識や技術の普及に取り組んでいます。
7 Enhancement of Research and Experimentation and Dissemination of Technologies
For sustainable development in local fisheries, Hokkaido has been upgrading marine resource enhancement and management technology: inventing value-added
products, studying environment conservation, and disseminating new knowledge and technology across the prefecture.
アカガレイの
アカガレイ の耳石採取
船上での
船上 での調査状況
での調査状況(
調査状況( プランクトン調査
プランクトン 調査)
調査)
Research being conducted on the deck of a ship(Plankton research)
Otolith picking from flathead flounder
8 国際漁業の
国際漁業の情勢
我が国は、平成8年の国連海洋法条約の発効に伴い「排他的経済水域及び大陸棚に関する法律」を制定し、排他的経済水域を設定
しました。韓国や中国との間で漁業協定を発効しているほか、ロシアとの間では、毎年、政府間協定や民間協定による操業が行われ
ています。また、北方四島周辺水域における日本漁船の操業については、平成10年に協定が締結され、スケトウダラやタコなどが漁
獲されています。
8 International Fishery Trends
With the enforcement of the United Nation's Convention on the Law of the Sea, the Japanese Government enacted the Law Concerning Exclusive Economic
Zones and Continental Shelves in 1996, to establish an exclusive economic zone.
Japan has entered into fishery agreements with South Korea and China. Meanwhile, Japan and Russia renew governmental and private agreements about fisheries
each year.
In 1998, an agreement concerning the operation of Japanese fishing boats around the northern territories was concluded for catching walleye pollock and octopus.
2010年
2010年 の日本漁船の
日本漁船の操業水域図
Fishing zone for japanese fishing boats in 2010
○相互入漁水域
第 Ⅰ-1水域
第 Ⅰ-2水域
第 Ⅱ-1水域
第 Ⅱ-1-1水域
第 Ⅱ-2水域
第 Ⅱ水域
第 Ⅴ水域
千島(
千島 (オホーツク海側北部
オホーツク 海側北部)
海側北部) 底はえなわ
千島(
千島( オホーツク海側南部
オホーツク海側南部)
海側南部) 底はえなわ
千島(
中層及び着底トロール
千島( 太平洋側北部)
太平洋側北部 )
底はえなわ
千島(
中層及び着底トロール
千島(太平洋側北部)
太平洋側北部)
底はえなわ
千島(
底はえなわ、いかつり
千島( 太平洋側南部)
太平洋側南部 )
千島(
棒受網
千島( 太平洋側)
太平洋側)
日本海水域
いかつり
○有償入漁水域
第 Ⅱ-2水域
- 12 -
千島(
千島 (太平洋側南部)
太平洋側南部)
中層及び着底トロール
北海道の
北海道の水産
(平成22
平成22年
22年4月)
発 行
行 北海道水産林務部
企画・
企画・編集 編集 北海道水産林務部総務課
〒060
〒060060-8588 8588 札幌市中央区北3
札幌市中央区北3条西6
条西6丁目
TEL:(
TEL:(011)
011)231231-4111
FAX:(
FAX:(011)
011)232232-4140
表紙の
表紙の写真 写真 コンブ干場
コンブ干場(
干場(浦河町) 浦河町) 写真提供「
写真提供「北海道の
北海道の漁業図鑑(
漁業図鑑(北海道水産業改良普及職員協議会)」
北海道水産業改良普及職員協議会)」
Hokkaido Fisheries
( Published in April 2010 )
Published by Department of Fisheries and Forestry , Hokkaido Government
Planned and edited by the Administrative Division ,
Department of Fisheries and Forestry
Nishi 6 , Kita 3 , Chuo-ku , Sapporo , Hokkaido 060-8588 Japan
Tel : 011-231-4111
Fax : 011-232-4140
Front cover : SunSun-drying kombu on the ground(
ground(Urakawa Town)
Town)
Food Safety Surveillance System and
Countermeasures against Food Poisoning
September 8th, 2010
Ryuusuke Matsuoka
Deputy Director
Inspection and Safety Division
Department of Food Safety
Pharmaceutical and Food Safety Bureau
The Ministry of Health, Labour and Welfare
1
Food safety-related system of law
The Food Sanitation Law
Order for Enforcement of
the Food Sanitation Law
Ordinance for Enforcement of
the Food Sanitation Law
Standards and criteria for food
and food additives, etc.
Ministerial Ordinance
Concerning the Ingredient
Standards for Milk and Dairy
Products
The Slaughterhouse Act
The Poultry Meat
Inspection Law
Order for Enforcement of the
Slaughterhouse Act
Ordinance for Enforcement
of the Slaughterhouse Act
Order for Enforcement
of the Poultry Meat
Inspection Law
Ordinance for Enforcement
of the Poultry Meat
Inspection Law
2
Sharing roles among businesses, consumers and the government
Food-related businesses
As providers of foods, etc., businesses are primarily
responsible for securing food safety.
Consumers
・Deepening knowledge in securing food safety, etc.
・Striving to express opinions regarding policies to secure food safety
The government
Conducting monitoring and guidance to make sure that
food-related businesses are carrying out their responsibilities and
providing safe foods.
3
Administrative System
※Prefectures, etc.: 47 prefectures, 66 cities with healthcare centers, and 23 wards
Regional
Bureau of
Health and
Welfare
Quarantine
stations
(13 main offices and
14 branch offices)
Slaughterhouse Food and food-related
businesses
(manufacturers, sellers, etc.)
Registration and
inspection
institutions
Application
Approval, renewal,
cancellation/on-site
inspection
National Institute of Health Sciences
National Institute of Infectious Diseases
National Institute of Public Health
Registration, renewal,
cancellation/on-site
inspection
Prefectural
The Pharmaceutical
Institutes
Affairs and Food
of Public
Sanitation Council
Health
Application
Monitoring and guidance
Application for business licensing
(7 sites)
Food-related
businesses
(HACCP facilities)
Notification of imports
(136 sites)
Ministry of Health,
Labour and Welfare,
the main building
(Department of
Food Safety)
Inspection
Health center
Monitoring and guidance/
Business licensing
Construction permits
Inspections at slaughterhouse
Meat
inspection
center
Prefectural
government
building※
Food-related
businesses
(Importers)
4
Food Sanitation Law
【Purpose】
Article 1
The purpose of this Act is to prevent
sanitation hazards that result from food
consumption and drinks, by enforcing
regulations and other measures necessary
from the standpoint of public health, to
ensure food safety and thereby to protect
citizens' good health.
5
• Foods not permitted for marketing 1
(Food Sanitation Law, Article 6)
・Deteriorated, rotten, or immature foods
(But exclude those that are determined to generally pose no risk to human health and
recognized as edible.)
・Foods that contain or are covered with toxic or harmful
substances, or are suspected of containing or being covered
with such substances
(But exclude cases where the Minister of Health, Labour and Welfare specifies that
such items involve no health risk to humans. )
・Foods which are contaminated with pathogenic organisms or
are suspected to be so, and involve a risk to human health.
・Items which involve a risk to human health due to
uncleanliness and contamination or addition of foreign
substances or on other grounds.
6
• Foods not permitted for marketing 2
・Foods that are consumed in extraordinary ways, and thus
prohibited from marketing. (Article 7)
(Foods that are served in a manner extraordinarily different from regular
manners, or foods that have not been generally consumed, etc.)
・Foods that are banned from importing and marketing due
to their repeated violation of regulations. (Article 8)
・Meat of livestock that is suspected to have contracted
with or died from specific diseases, etc. (Article 9)
・Unapproved additives or foods containing unapproved
additives, etc. (Article 10)
7
• Foods not permitted for marketing 3
・Foods that are produced by any method not conforming
to the stated criteria and standards (*1), etc. (Article
11)
・Foods without labeling that conforms to criteria (*2)
(Article 19)
・Foods with false or exaggerated labeling, which may
cause harm to public health (Article 20)
*1 Ministerial Ordinance concerning the Ingredient Standards for Milk and Dairy
Products, Standards and Criteria for Foods, etc.
*2 Ministerial Ordinance concerning the Ingredient Standards for Milk and Dairy
Products, Ordinance for Enforcement of the Food Sanitation Law
8
Standards and Criteria
Standards and criteria for food and food additives, etc.
(Ministry of Health and Welfare, Notification No. 370, 1959)
Ministerial Ordinance concerning the Ingredient Standards
for Milk and Dairy Products
Standards and criteria for manufacturing, processing, use,
cooking and preservation of food, etc.
Example Standards and criteria for carbonated drinks
○ Ingredient standards for carbonated drinks
・Arsenic, lead and cadmium should not be detected
・Negative for coliform bacterium, etc.
○Manufacture standards for carbonated drinks
・Original water should be drinking-quality
・Drinks of pH 4.0 or over should be sanitized by heating
(85 degrees C, 30min or longer, or equivalent methods), etc.
○Preservation standards for carbonated drinks
・Frozen fruit drinks, etc. should be preserved at -15 degrees C, etc.
○Cooking standards for carbonated drinks served by cup vending machines
・The liquid should be kept 10 degrees C or below, or 63 degrees C or above, etc.
9
Business approval
From the perspective of public health, prefectures, etc.
shall establish an ordinance that set criteria for each type
of business (*).
(Food Sanitation Law, Article 51)
*34 types of businesses including restaurants.
(Businesses with an extraordinary impact on public health, thus specified by the ordinance.
1 Restaurant businesses
2 Coffee shop businesses
3 Confectionery businesses
(including bakery businesses)
4 Bean jam producing businesses
5 Ice cream producing businesses
6 Milk processing businesses
7 Special milking and processing businesses
8 Dairy product producing businesses
9 Milk collecting businesses
10 Milk sales businesses
11 Slaughtering businesses
12 Processed meat sales businesses
13 Processed meat product producing businesses
(meaning businesses for producing ham,
sausage, bacon and such like)
14
15
16
17
18
19
20
21
22
23
24
25
26
27
Fish and seafood sales businesses
Fish and seafood auction businesses
Fish jelly product producing businesses
Food freezer or cold storage businesses
Food irradiation businesses
Carbonated drink producing businesses
Lactic acid bacteria beverage producing
businesses
Ice producing businesses
Ice sales businesses
Edible fat and oil producing businesses
Margarine or shortening producing
businesses
Miso producing businesses
Soy sauce producing businesses
Sauce producing businesses
28 Alcoholic beverage producing
businesses
29 Bean curd producing
businesses
30 Fermented soybeans producing
businesses
31 Noodles producing businesses
32 Daily dish producing
businesses
33 Canned or bottled food
producing businesses
34 Additive producing businesses
10
Business approval
A person who intends to conduct business prescribed
in the preceding Article, shall obtain approval from
the prefectural governor pursuant to an ordinance of
the Ministry of Health, Labour and Welfare. (Food
Sanitation Law, Article 52)
11
Slaughterhouse Act
Purpose
To protect national health by establishing necessary regulations
and other measures, from the perspective of public health, to
secure proper slaughterhouse operation and processing of
livestock for human consumption
Subject (=Livestock)
Cattle, horses, pigs, sheep and goats
Approval for slaughterhouse
Approval from the prefectural governor, etc. is required to
establish a slaughterhouse.
If necessary from the public health perspective, the prefectural
governor, etc. shall limit the number and kind of animals
processed per day, in proportion to the scale of the facility.
12
Restriction on refusal of slaughterhouse use, etc.
Without justified grounds, slaughtering of livestock and use
of slaughterhouse for slaughtering and dressing of livestock
shall not be refused.
Slaughtering and dressing of livestock
No person shall slaughter livestock for the purpose of
human consumption at a place other than a
slaughterhouse.
Exceptions
・Instant slaughtering required due to the lethal injury of
livestock by an accidental disaster.
・ Instant slaughtering required in livestock due to dystocia,
parturient paresis, acute bloat or other diseases that are
stipulated by ordinance of the Ministry of Health, Labour and
Welfare, etc.
13
Slaughtering and dressing inspection of livestock
・Livestock, other than those inspected by the
prefectural governor, shall not be slaughtered.
・Livestock, other than those inspected by the
prefectural governor, shall not be dressed.
・Meat, internal organs, blood, bones, and skin shall
not be taken outside of the slaughterhouse without
inspection by the prefectural governor. (There are
exceptions.)
Slaughterhouse inspectors
The prefectural governor shall appoint slaughterhouse
inspectors (veterinarians) from the staff of the prefecture,
in order to implement slaughtering and dressing
inspections of livestock, or to take measures such as the
prohibition of slaughtering and dressing.
14
Abnormality
Prohibition
of
slaughtering
Abnormality
Prohibition
of
dressing
Pass
Dressed
carcass
BSE testing
Inspection of
internal organs
Inspection of
dressed carcass
Inspection
passed
Testing
required
Post-dressing
inspection
Antemortem
inspection
Pre-dressing
inspection
Internal
organs
Dressing
Slaughtering
Carry-in
Carry-in
Livestock
Flow of slaughterhouse inspection
On hold
Detailed
examination
Failed
Abnormality
Slaughterhouse inspection
(slaughterhouse inspector)
Partial or total disposal
15
Diseases subject to
slaughterhouse inspection
○Animal infectious diseases under provision of the Domestic
Animal Infectious Diseases Control Act, Article 2, Paragraph 1,
and notifiable infectious diseases under provision of the said act,
Article4, Paragraph 1
Example: BSE, foot-and-mouth disease, anthrax, rabies, etc.
○Additional diseases designated by the Ministry of Health,
Labour and Welfare
Example: Q-fever, malignant edema, leukemia, Listeriosis, etc.
○Abnormal conditions, such as those covered with lubricating oils,
designated by the Ministry of Health, Labour and Welfare
Example: Trauma, inflammation, degeneration, contraction, deformation, etc.
16
Countermeasures against BSE at the
slaughterhouse
Removal and incineration of Specific Risk Material (SRM) from all cattle
Removal based on the management method for
slaughtering business
Stored in designated containers
Confirmation by slaughterhouse
inspectors
Head(includingtonsils)
Tongue and cheek meat are used for
human consumption
Tongue should be removed with care
not to touch tonsils
Distal ileum
The distal 2m from the cecum,
including the part for the sake of
safety, is removed.
Washing and sanitizing of machinery
and equipment, etc.
Complete incineration (800 °C or above)
Spinal cord
Removal of spinal cord before
splitting
Decontamination by high-pressure
washing
Vertebral column
Prevention of contamination from
dorsal root ganglion during
vertebral column removal
17
Regulation for poultry slaughtering
business and law for poultry
slaughtering inspection
Purpose
To protect the national health in regard to the poultry slaughtering
business, by preventing the occurrence of sanitary hazards due to
poultry meat with measures such as setting regulations and other
methods necessary from the perspective of public health and
establishing the poultry slaughtering inspection system.
Subject (= poultry)
Chickens, ducks, turkeys or other commonly consumed poultry
that are designated by Cabinet Order*)
* Currently, no other poultry is designated by Cabinet Order.
18
• Permission for poultry slaughtering business
Those who intend to conduct poultry
slaughtering business need to acquire
permission from their respective prefectural
governor.
• Poultry Slaughtering inspection
In order to conduct poultry slaughtering
business, the poultry meat should be inspected
as follows:
1) Antemortem inspection, 2) Inspections after
plucking, 3) Inspections after evisceration
19
Abnormality
Abnormality
Prohibition of
slaughtering
Prohibition of
dressing
Poultry meat inspection
(Poultry meat inspector)
Mandates from
municipalities
Pass
Carcass with
organs removed
Inspection
after evisceration
Evisceration
Inspection
after plucking
Plucking
Slaughtering/
exsanguination
Antemortem
inspection
Carry-in
Poultry
Flow of poultry slaughtering inspection
Inspection
passed
Inspection
required On hold
Detailed
Abnormality inspection
Failed
Partial or total disposal
* Overall safety and health controllers can conduct and confirm
inspections after plucking and evisceration under the supervision of
poultry meat inspectors.
20
Diseases subject to poultry
meat inspection
○Animal infectious diseases under provision of the Domestic
Animal Infectious Diseases Control Act, Article 2,
Paragraph 1, and notifiable infectious diseases under
provision of the said act, Article 4, Paragraph 1
Examples: highly-pathogenic avian influenza, New Castle disease,
etc.
○Additional diseases designated by the Ministry of Health,
Labour, and Welfare
Examples: infectious coryza, salmonellosis, inclusion body
hepatitis, etc.
○Abnormal conditions, such as covered with lubricating oils,
designated by the Ministry of Health, Labour, and Welfare
Examples: trauma, inflammation, degeneration, contraction,
deformation, etc.
21
Occurrence of food
poisoning
50,000
40,000
35,000
30,000
25,000
20,000
Occurrence of food poisoning, 2008
Number of patients 24, 303
15,000
10,000
Number of cases
1,369
5,000
Number of death
4
2008
2005
2002
1999
1996
1993
1990
1987
1984
0
1981
Number of patients
45,000
22
Occurrence of food poisoning by cause
2006
Food type
Total
Cases
2007
Rate (%)
Cases
2008
Rate (%)
Cases
Rate (%)
1,491
100
1,289
100
1,369
100
80
5.4
68
5.3
106
7.7
8
0.5
22
1.7
15
1.1
71
4.8
83
6.4
96
7.0
Raw and processed eggs
7
0.5
8
0.6
10
0.7
Milk and processed milk
1
0.1
1
0.1
0
0.0
Cereal and processed cereal
26
1.7
22
1.7
23
1.7
Raw and processed vegetables
97
6.5
78
6.1
87
6.4
Confectionary
11
0.7
12
0.9
9
0.7
Composite cooked food
141
9.5
95
7.4
103
7.5
Others
582
39.0
547
42.4
531
38.8
Unknown
467
31.3
353
27.4
389
28.4
Fish and seafood
Processed fish and seafood
Raw and processed meat, etc.
23
Year by year transition of case numbers by
pathogens (mainly micro-organisms)
Salmonella spp.
Staphylococcus spp.
Vibrio parahaemolyticus
Pathogenic Escherichia coli
Clostridium perfringens
Campylobacter jejuni/coli
2008
2007
2006
2005
2004
2003
2002
2001
2000
1999
1998
Norovirus
24
Year by year transition of patient numbers by
pathogens (mainly microorganisms)
30,000
Salmonella spp.
Staphylococcus spp.
Vibrio parahaemolyticus
Pathogenic Escherichia coli
Clostridium perfringens
Campylobacter
Norovirus
25,000
20,000
15,000
10,000
5,000
2008
2007
2006
2005
2004
2003
2002
2001
2000
1999
1998
0
25
Government responses to food poisoning
Food poisoning
Related Bureau, Department,
Ministry and Agency
Cooperation
Health center
○ Contact by medical doctors (within 24 hours of examination), patients,
business operators, etc.
○ Detection by health center staff
○ Investigation by the health center
・ Investigation and understanding of the scale of case, etc.
・ Investigation・・・Search for consumption circumstances, on-site inspection
hearing from responsible cooks, examinations of related foods
and patients’ samples, etc.
○ Measures by health center
・ Countermeasures against increase in patient number・・・・Prohibition
and suspension of business
Recall order for the causative foods and materials
・ Recurrence prevention・・・ Guidance for reform of sanitary conditions in
the facility
Information provision for business operators, consumers, etc.
Information provision for each municipality
○ Report from health centers to their respective prefectures, etc.
Prefectures, etc.
○ Report from prefectures, etc. to the Ministry of Health, Labour and
Welfare
The Ministry of
Health, Labour
Welfare
○ Request prefectures, etc. for investigation in case of large-scale,
wide-spread food poisoning
26
Preventative measures against food poisoning by
Vibrio parahaemolyticus 1
Year 2001
○ Labeling criteria established for fresh fish and seafood, etc. to be eaten raw.
Addition of fresh fish and seafood, etc. to the list of foods that require
labeling.
○ Standards and criteria established for fresh fish and seafood, etc. to be eaten
raw.
Establishment of ingredient standard, processing criteria, and preservation
criteria for fresh fish and seafood, etc. to be eaten raw.
・Ingredient standard:
Vibrio parahaemolyticus
Boiled octopus and crabs: Negative
Fresh fish and seafood to be eaten
raw: 100g or less
・Processing criteria:
Used for processing
Water should be
drinking-quality, etc.
・Preservation criteria:
10 degrees C or below
(Cases)
(Patients)
14000
900
800
12000
700
10000
600
500
8000
400
6000
300
4000
200
2000
100
0
0
1995
1996
1997
1998
1999
2000
NumNuber of Cases
2001
2002
2003
2004
2005
2006
Number of patients
27
Preventative measures against food poisoning by
Vibrio parahaemolyticus 2
Food poisoning by Vibrio parahaemolyticus especially
occurs in the summer season, mainly due to consumption
of fresh fish and seafood.
Through domestic distribution・・・monitoring by each prefecture, etc.
(Summer-time overall check-up, etc. )
Upon importation・・・monitoring imported foods at quarantine stations
(Strengthening summer-time monitoring and inspections, etc.)
28
Vibrio vulnificus
Every year, cases of Vibrio vulnificus infection occur in summer time
(June-October). This bacterium adheres to fish and seafood, especially
crustaceans (shrimps, etc.) captured in brackish water area (where fresh
and salt water intermingle with each other) and salt water fish and seafood
captured at river mouths. When eaten raw or not cooked thoroughly,
consumption of these foods can cause oral infection.
Recently, results were compiled from studies that were aided by grants for
scientific research, financed by the Ministry of Health, Labour and
Welfare. Consequently, the Ministry developed on May 31, 2006 ‘Q&A
for Vibrio Vulnificus’, aiming at providing correct information and
deepening the understanding of preventative measures among the public.
Web Site of the Ministry of Health, Labour and Welfare
http://www.mhlw.go.jp/topics/bukyoku/iyaku/syoku-anzen/qa/060531-1.html
29
Measures to secure sanitation of
raw oysters for consumption 1
○Partial amendment of Ordinance for Enforcement of the Food
Sanitation Law,
Released in December 28th, 1998, Sei-ei No. 1825
In addition to establishing a system to enable emergency
investigation through to the area of oyster fishing, names of the
fished sea area should appear on the label in order to prevent
further spreading of damage by food poisoning. (Applied on
October 1st, 1999)
○‘Q&A for preventing norovirus food poisoning’,
Released in February 4th, 2004,
by the Ministry of Health, Labour and Welfare
(The final version was released on March 1st, 2005)
30
Year by year transition of norovirus food poisoning cases
numbers by causative food types (Cases)
2001
Total
2002
2003
2004
2005
2006
269
268
278
277
274
499
Fish and seafood
98
83
73
39
45
26
(Bivalves only)
94
81
70
38
42
22
Processed fish and seafood
1
3
0
1
3
0
Raw and processed meat, etc.
0
1
1
1
1
1
Raw and processed eggs
0
0
0
0
0
0
Milk and processed milk
0
0
0
0
0
0
Cereal and processed cereal
0
3
3
2
3
3
Raw and processed vegetables
0
2
1
1
1
2
Confectionary
1
0
2
2
3
3
Composite cooked food
9
11
15
21
19
77
106
131
145
162
172
310
6
3
6
4
5
11
100
128
139
158
167
299
54
34
38
48
27
77
Others
Food identified
Food unidentified
Unknown
31
Measures to secure sanitation of raw
oysters for consumption 2
Safety management of oyster aquafarming, production and shipment
Web Site by Fisheries Agency
Sanitary management at
production/processing stages
Oyster producers strive to provide safe products.
During production and
shipment, oysters should be
sufficiently washed with
sanitary water at processing
stages such as the removing
of shells and packaging, or
submerged in pasteurized
salt water for a certain period
of time.
Rolling up the
oysters
Washing shells
on board
Shelling process
of oysters
Efforts, such as repeated washing through to
shipment and sanitization, are taken under
sanitary management.
Primary washing (Removal
of shell debris, etc.)
Shipment in a
sealed package
UV sanitizer
Secondary washing
(Final process
before packing)
http://www.jfa.maff.go.jp/norovirus/index.htm
32
Measures to secure sanitation of
raw oysters for consumption
・Importation of raw oysters for consumption
Importation of raw oysters is permitted after confirming that
the condition of the raw oysters is equivalent or superior to
the sanitary management standards stated by the processing
standards, etc. of the Food Sanitation Law, provided that
the mandatory sanitary certification, etc. attachment is
fulfilled .
Currently permitted exporters
Total of 6 countries: Australia, New
Zealand, US, Canada, Korea, and Ireland
33
Measures against natural toxins
1) Countermeasures to prevent puffer toxin (tetrodotoxin)
poisoning
December 2nd, 1983
Notification to secure sanitation of Fugu puffer fish
This notification established the types, parts and the sea area of
captured puffer fish eligible for distribution. Operators, facilities, and
methods of Fugu puffer fish processing were also stated.
34
Measures against natural toxins
2) Importation of Fugu puffer fish
March 3rd, 1984
Notification about imported Fugu puffer fish
・Limiting types and sea areas for capturing eligible Fugu puffer
fish to be imported
・Fish should be either unprocessed or only eviscerated to make
visual identification of fish types easy at the time of import
・Certificate issued by the exporting country's government
should be attached
35
Year-by-year transition of food poisoning cases caused by
Fugu puffer fish
Number of food poisoning attributed
to only Fugu puffer fish
Total number of food poisoning
Cases
Patients
Deaths
Cases
Patients
Deaths
1965
1,208
29,018
139
106
152
88
1970
1,133
32,516
63
46
73
33
1975
1,783
45,277
52
52
75
30
1980
1,001
32,737
23
46
90
15
1985
1,177
44,102
12
30
41
9
1990
926
37,561
5
32
52
1
1995
699
26,325
5
30
42
2
2001
1,928
25,862
4
31
52
3
2002
1,850
27,629
18
37
56
6
2003
1,585
29,355
6
38
50
3
2004
1,666
28,175
5
44
61
2
2005
1,545
27,019
7
40
49
2
2006
1,491
39,026
6
26
33
1
2007
1,289
33,477
7
29
44
3
2008
1,369
24,303
4
40
56
3
36
Measures against natural toxins
3) Shellfish poison
July 1st, 1980: Notification about handling of
shellfish that became poisonous due to accumulation
of paralytic shellfish toxins, etc.
Shellfish containing higher levels of toxins than the
following concentrations will be handled as a
violation against the Food Sanitation Law, Article 6
Paralytic shellfish toxin: 4MU
Diarrhetic shellfish toxin: 0.05MU
37
Food origins of Campylobacter food poisoning
(including presumed cases)
Consumption of raw chicken meat and liver
48 cases, 438 patients
Consumption of raw beef liver
15 cases, 96 patients
Consumption of other types of raw meat (including cases with
unknown animal species)
7 cases, 71 patients
Dishes of chicken meat that were not designated for raw
consumption
18 cases, 230 patients
Secondary contamination
11 cases, 321 patients
Excerpt from Food Poisoning Status, 2005
38
In order to prevent Campylobacter food poisoning
Countermeasures at farms
Countermeasure at poultry slaughterhouse
Sanitary management with HACCP method at poultry
slaughterhouses
Countermeasures at trimming factory, during distribution
and sales
Temperature management, sanitary handling of food
(Regarding guidelines about management and administration
standards that food businesses, etc. have to implement –
Guidelines)
Disseminating and raising awareness among food-related
business persons and consumers
How to prevent Campylobacter food poisoning (Q&A)
6 points for preventing food poisoning, etc. at home
39
Measures against parasites
Investigation on amberjack imported from China since the fall of 2004 and
chicken grunt originally captured wild in China and then aquafarmed in Japan,
turned out to have anisakis larva at a high rate.
1) In addition to the high rate of parasitism, larva was even found
in some fish meat.
2) Those meats are sold for human consumption.
3) The public was not generally aware of the high rate of anisakis infestation in
those types of fish.
In conjunction with the Ministry of Agriculture, Forestry and Fisheries, our
ministry has issued guidance for direct measures such as freezing (-20 degrees
C or below for 24 hours or longer) for those fish originally captured wild and
imported from China, then domestically aquafarmed. In addition, another
guidance was issued for aquafarming businesses to halt importing amberjack
and chicken grunt that were originally captured wild and raised in China.
40
Introduction of positive list system to the regulation of pesticide
residues in food, etc. 1
Before the regulation
Pesticide,
Pesticide, feed
feed additives,
additives, and
and veterinary
veterinary
medicinal
products
medicinal products
Items with criteria already established for their
residual levels in foods (residual standards)
Residual standards stated for 250 pesticides
and 33 veterinary medicinal products, etc.
When residual pesticide levels, etc. are found to be
above residual standards, the food is banned from
marketing.
Foods with no defined standards
(residual standards) for their
ingredients
Even with pesticide residues, etc. detected,
there is basically no regulation to indicate
prohibition of sales, etc.
41
Introduction of positive list system to the regulation of pesticide
residues in food, etc. 2
After introduction of positive list system
(Executed on May 29th, 2006)
Pesticide,
Pesticide, feed
feed additives,
additives, and
and veterinary
veterinary
medicinal
medicinal products
products
Pesticides with already established standards
(residual standard) as food ingredient
Based on Article 1, Section 1 of the
current law, the ministry aimed to
establish a harmonized standard with the
Agricultural Chemicals Control Act,
international standards, and American
and European standards before the
implementation of the positive list system
Promotion to establish residual
standards, such as establishing residual
standards coupled with a registration
system of pesticide based on the
Agricultural Chemicals Control Act, etc.
Prohibition of selling foods that contain
pesticides above their residual standards, etc.
Pesticides with no
established standards
(residual standards)
The Minister of Health,
Labour and Welfare
publicly announces certain
levels of pesticides as they
are not likely to harm
people’s health.
(Across-the-board
recommendation)
Prohibition of
selling foods that
contain pesticides
above a certain level
(0.01 ppm).
Substances designated
by the Minister of
Health, Labour and
Welfare
Public announcement
of chemicals that are
clearly unlikely to
harm people’s health
(substances not
subjected)
Outside the scope
of the positive list
system
42
Contamination of fish meat, the raw material for feed, with
malachite green and leuco-malachite green
Past circumstances
(1) A survey was conducted on the actual contents of MG and LMG in corf
aquafarming and aquafarming feed. The survey was initiated by “basic research
on harmful chemicals’ risk management 2006” by the Ministry of Agriculture,
Forestry and Fisheries.
(2) LMG was detected in a portion of corf-aquafarmed fish.
(3) Pursuit of the LMG positive cases of fish revealed that MG and LMG were also
detected in their fed feed produced by certain feed manufacturers.
(4) The Fertilizer and Feed Inspection Station (an independent administrative agency)
has confirmed the presence of MG/LMG contamination in fish meat that was
imported from China as a raw material for feed by manufacturers (3).
43
Measures
(The Ministry of Agriculture, Forestry and Fisheries)
Handling of the aquafarmed fish that were fed feed possibly
contaminated with malachite green and leuco-malachite green
(December 8th, 2006)
(The Ministry of Health, Labour and Welfare)
Handling of aquafarmed aquatic animals for human
consumption that were fed feed possibly contaminated with
malachite green and leuco-malachite green
(December 8th, 2006)
44
Guidelines and Plans for Monitoring and Guidance
(Related to Food Sanitation Law, Article 22-24)
Guidelines
Guidelinesfor
forFood
FoodSanitation
SanitationMonitoring
Monitoringand
andGuidance
Guidance
(Compiled
by
the
government)
(Compiled by the government)
A) Basic direction such as roles related to monitoring and guidance by the government and prefectures, etc.
B) Basic items for monitoring and guidance, such as those that should be intensively monitored based on past
violation record and hazard information, etc.
C) Basic items related to implementation system for monitoring and guidance, such as inspection facilities.
D) Others; the key items related to public disclosure of the outcomes, implementation of monitoring and guidance
based on surveillance and research.
Plan
Planfor
forImported
ImportedFood
FoodMonitoring
Monitoringand
and
Guidance
Guidance
(Compiled
(Compiledby
bythe
thegovernment)
government)
A)
Sanitary regulation of food in exporting
countries, occurrence of food sanitary
problems, items that require highly prioritized
monitoring and guidance that are drawn up
based on the past circumstances of violation.
B)
Promotion of self-initiated sanitary
management by importers, etc. through
convening workshops.
C)
Others; Necessary items for implementation of
monitoring and guidance, such as public
disclosure of monitoring/guidance outcomes
Call for public
opinion from
citizens and
residents in regard
to formulation and
changes
Publicly disclose
how the plan has
been
implemented
Plans
Plansfor
forFood
FoodSanitation
SanitationMonitoring
Monitoringand
andGuidance
Guidance
by
byprefectures,
prefectures,etc.
etc.
(Compiled
(Compiledby
byprefectures,
prefectures,etc.)
etc.)
A)
Items that require highly prioritized monitoring and
guidance, drawn up based on the food production,
distribution, circumstances of manufacturing and
processing, occurrence of sanitary problem of food in the
region.
B)
Hosting workshops, etc. to promote education, in order to
disseminate the concept of HACCP among businesses, etc.,
and to promote self-initiated sanitary management based
on the mass cooking facility manual.
C)
Items related to communication and adjustment with
neighboring communities, and with national institutions
for tests and inspections to accommodate investigations, on
occasions of food poisoning.
D)
Others: items necessary to implement monitoring guidance,
such as public disclosure of monitoring/guidance outcomes.
45
Responsibilities of food business operators
(Related to Food Sanitation Law, Article 3)
1. Measures in ordinary times
•Gain knowledge and techniques
•Secure safety of raw materials
•Proactively exercise self-inspection, etc.
2. Making and keeping records
To the necessary extent, endeavor to make and keep records of suppliers names.
This can be used, during the occurrence of food poisoning, to expedite the investigation of
causes and prevention of further expansion of damage
3. Measures during an emergency
Endeavor to accurately and expediently,
•Provide government and municipalities with records mentioned in ‘2’ and
•Implement measures such as disposal, etc.
*”Food business operators” refers to businesses and mass food services that carry out collection,
manufacturing, importation, processing, marketing, etc. of foods.
46
Obligatory effort to keep records
by food business operators
(Related to Food Sanitation Law, Article 3, Section 2 and Section 3)
Flow of raw materials and products, etc.
Manufacturers
Keep records of
suppliers names
Keep records of
suppliers names
Keep records of
suppliers names
Consumers
Importers
Keep records of
suppliers names
Keep records of
suppliers names
Retailers
Investigation of causes
Wholesalers
Manufacturers
Processing businesses
Importers
Occurrence
of food
poisoning
Keep records of
suppliers names
Referring to the records of suppliers
names to identify causes and
prevent the expansion of damage
47
Approval System for Comprehensive Sanitary Management and
Manufacturing Process
HACCP method
Raw materials
Inspection and recording at
acceptance
Mixing
Confirmation and recording of
mixing ratio
Filling
Confirmation and recording of
temperature and filling volume
Sealing
Confirmation and recording of
sealing tightness
Critical control point
Heat treatment (CCP)
Continuous monitoring of
pasteurizing temperature/time
Chilling
Confirmation and recording of
water quality and temperature
HACCP is a sanitary management method to secure the safety of products by analyzing
hazards such as contamination with microorganisms, which might occur at any stage of
food manufacturing/processing (Hazard Analysis), establishing the CCP (critical control
point) that indicates at which stage of processing and by what measures the safety of
products can be more secured based on the hazard analysis and continuously monitoring
the described points.
The Comprehensive Sanitary Management and Manufacturing Process is a
manufacturing process that incorporates the concept of HACCP. It was established,
after the amendment to the Food Sanitation Law, as an approval system by the Minister
of Health, Labour and Welfare for the voluntary application of business operators.
Approval status of Comprehensive Sanitary Management for
Manufacturing Process (End of December, 2006)
Milk
Milk products
Meat products
Fish jelly products
Retort pouch food
Carbonated drinks
161 facilities (238 cases)
178 facilities (258 cases)
79 facilities (137 cases)
25 facilities (34 cases)
35 facilities (41 cases)
107 facilities (155 cases)
Packaging
Confirmation and recording of
impact and temperature
Shipment
Others
○ Instructions to improve sanitary management by establishing ‘the mass cooking facility
sanitary management manual’ for mass cooking facilities, etc.
○ Offering financial and tax privileges, in order to promote the introduction of HACCP.
○ Introduced in February 2004 and renewed in every 3 years, to ensure safety
48
The Ministry of Health, Labour and Welfare
Food Safety Information
Emergency information
Food Safety Qs & As
Risk Communication in
Food Safety
Implemented policies by
types of area
Food poisoning
Food additives
Residual pesticides,
veterinary medical
products, and feed
additives in food
bovine spongiform
encephalopathy(BSE)
Genetically modified
foods
・・・
Health food products
Imported foods
http://www.mhlw.go.jp/topics/bukyoku/iyaku/syoku-anzen/index.html
49
© Copyright 2026 Paperzz