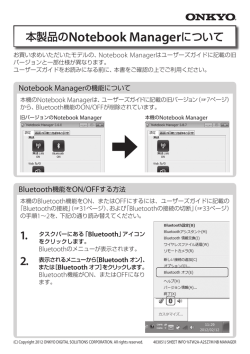
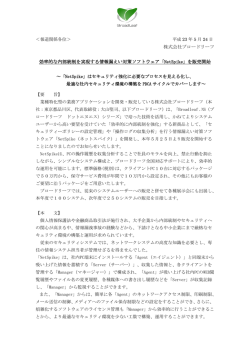
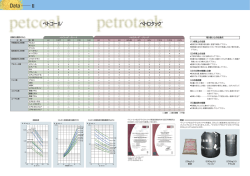
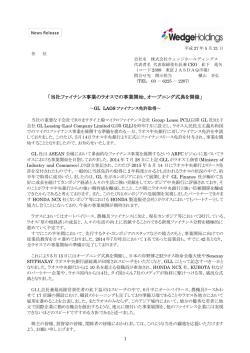
MPA(日本版)利用ガイド 平成 17 年 3 月 マーサー・インベストメント・コンサルティング 目次 ページ 1. MPA の立ち上げ 1 2. メニュー 2 3. 設定 3 4. 四分位、リスク/リターン、超過収益、その他のチャート 4 5. 四分位チャート 7 6. マーサー・ツールバー 8 7. 登録プロダクト名の変更 9 8. リスク/リターン・チャート 10 9. ローリング・ピリオド・チャート 12 10. スキャッター・プロット 13 11. 指数化グラフ 14 12. リスク/リターン特性 15 13. パフォーマンス分析 17 14. リターン持続性分析 18 15. 上昇・下降相場パフォーマンス分析 19 16. 相関分析 20 17. 付加価値の信頼度 21 18. マーサー・サーベイ 22 19. ユーザー・データベース 25 19’. コンポジット(合成)リターンの作成 33 20. エクスポート・データ 35 21. スネイル・トレイル 36 ii 22. スタイル分析 37 23. 用語集 41 24. ユニバースの種類と定義 55 (注記) 58 iii 1.MPA の立ち上げ PC のハードディスクにインストールして、スタート・メニューから始める方法とサーバーに MPA のフォルダー(下記参照)を置き、その 中の”Menu.xls”のショートカットを作成して、デスクトップに貼り付けて、クリックして、スタートする方法があります。なお、ネットワー ク・サーバーに保存して利用される場合は、 “ネットワーク ドライブの割り当て”をしてからご利用ください。CD-ROM に保存されたもの を提供された場合は、保存機能を利用するものは、そのままでは利用できない機能がありますので、CD-ROM から PC にフォルダーを移動 してください。 Menu.xls こ れ を ク ッ リ ックすると MPA のメニュ ーが開く。 1 2.メニュー “Menu.xls“をクリックすると下記のメニューが開きます。表示されている各メニューをクリックすることで、各機能を始めることになりま す。全般的な設定は、”MPA Options”をクリックします。 各種設定をす る。 個別運用プロダクトを選 択してのチャートなど 運用プロダクトのパフ ォーマンス結果などを 一覧で表示 データベースに含まれて いない運用パフォーマン スやインデックスデータ をユーザーが追加 データベース内のすべての 数値をスプレッドシートに 出力 時間の経過によるリス ク・リターンの変化を図示 データベース内の運 用プロダクトの検索 およびユニバースの リストの出力 リターン・ベースの スタイル分析 2 3. 設定 “MPA Options”をクリックすると次のウインドウが表示されて、各種の設定の変更ができます。 各チャートなどのタイトルで、最初に入力されてい る名称 このボックスがチェックされている場合、チャートなど のタイトルが選択運用機関名称に自動的に更新される。 各チャートなどで示される運用機関のパフォーマンスのランキング の表示で、実際の順位か、百分率で示すか、非表示かの選択。 メニュー等の言語の選択。日本語、英 語、仏語の選択非対応部分もあり。 3 4. 四分位、リスク/リターン、超過収益、その他のチャート メイン・メニューの「四分位、リスク/リターン、超過収益、その他のチャート」をクリックしますと、次のウインドウが表示されて、プル ダウン・メニューから、望む分析を選択することになります。 組み込まれているユニバースが表示される。 日本版では、日本語で表示されたユニバースと 英語で表示されたユニバースがあるが、名称が アルファベットで表示されるか日本語で表示さ れるかの違いで、中身のデータは同じ。但し、 データベースは別個のものとして位置づけられ ているので、後に述べるユーザーのデータを入 れる場合は、選択したデータベースにのみしか 入らないことになる。 英語でのマニュアル と同じ内容を表示 マーサー東京への代表電話番号。MPA に 関する質問と言えば、わかる者が対応。 4 ユニバースを選択すると、登録されているインデックスから表示され、次に運用プロダクト名が表示されます。運用機関がその名前の公開を 望まない場合、その名称は Z で始まり、そのあとを数字で表示する格好になっていますが、この数字はデータ更新ごとに変更されますので、 運用機関の特定が容易ではない仕組みになっております。 表示できるタイプのチャ ート、表の種類を選択す る。 登録されている運用プロ ダクト名が表示される。 名前の公開を希望しない 運用機関名は Z で始まる コードで表示される。 直近のデータがない運用プロダクトもデータベ ースに組み込まれているが、このボタンをクリ ックすると直近のデータがあるプロダクト名の みが表示される。 5 分析をしたい運用プロダクトをクリックして選択します。ひとつのチャート等で選択できる個数(インデックスを含む)は、5個までとなっ ています。 日本株の場合は、スタイル分 類されたサブ・ユニバースが あるので、サブ・ユニバース で表示可能。 チャートのタイトル:タイプして 変更可能 データの終わりの 年月を選択でき る。 これをクリックす るとグラフ等のア ウトプットが表示 される。 期間の選択が可能 これをクリックする とメイン・メニュー に戻る。 6 5. 四分位チャート(Quartile Chart). 上記を実行するとこのチャートが表示されます。 括弧内は順位 n.a. は デ ー タ が ないということ 7 6. マーサー・ツールバー チャートとは別に、次のツールバーが表示されて、クリックすることでいくつかの機能を実行できます。ポインターを近づけると英語でその メニューが表示されます。 コピー。ワードやパワーポ 印刷プレビュー イントなどへの貼り付け ピクチャーとしてセーブして、他の が可能。 ソフトで読み込むなどして利用。 印刷 前のメニューに戻る ヘルプで英語マニュ アルの表示 矢印をチャー ト上に追加 ワードへ直接コピ ーする テキストの追加 追加した矢印 やテキストの 削除 ビュー・データ。 スタイル分析など で、チャートとし て表示されている 具体的な数字がス プレッドシートに エキスポートされ る。 いつも決まって作成するチャート がある場合、そのフォーマットをセ ーブするとデータ更新時に新たな 作成に便利。メニューの右肩の “Saved Charts”から保存したチ ャートを利用。 8 7. 登録プロダクト名の変更 チャート上、表示されるプロダクト名は、登録上、”Short Name”として入力されている名称ですが、この名称は、メニュー上の”Change Names”をクリックすることで以下のように変更のためのウインドウが表示されます。 変更したいプロダクト の選択 これをクリック して名称変更。 タイプして 変更可能 変更の保存 9 8. リスク/リターン・チャート (Risk/Return Chart) リスクとリターンで散布図となっています。リスクとリターンは、標準偏差とリターン、あるいは、トラッキング・エラーと超過収益を選択 できます。 リスク/リターン・ チャートの選択 トラッキング・エラ ーはベンチマークの 選択が可能 10 上記を実行して、出力されたチャート。 点線が中央値 (メジアン) を示す 11 9. ローリング・ピリオド・チャート(Rolling Period Chart) ユニバースに対してではなく、個々の運用プロダクトごとの超過収益、トータル・リターン、標準偏差、トラッキング・エラー、そして、イ ンフォメーション・レシオをローリング・ピリオドで表示。 12 10. スキャッター・プロット(Scatter Plot) 選択したインデックスとの関係を図示。 青い線は、回帰分析 で得られたライン 対角線 13 11. 指数化グラフ(Growth of ¥100 Invested) 選択した期間の開始時点を 100 として指数化してグラフ化。 14 12. リスク/リターン特性 (Risk/Return Characteristics) 選択した 1 期間で、いくつかのリスクやリターンの観点でのユニバースの位置を表示する。 選択すべき項目が表示 されて、プルダウン・メ ニューで選択肢が示さ れる。 15 上記を実行して表示。 16 13. パフォーマンス分析(Performance Analytics) 英語で、いくつかの観点からのパフォーマンス数値が表で表示される。 17 14. リターン持続性分析(Return Consistency Analysis) 選択したサイクル(月次、四半期、1 年、3 年、5 年)のリターンで、四分位に分けて、ある期間中に、どの位置に属している頻度が高いの かを表で確認。この例では、月次で当該 3 年間(36ヶ月中)の内、最上位四分位内に、キャピタルは 10 ヶ月(28%)属しており、最下位 の四分位には 9 ヶ月(25%)属していたということ。 18 15. 上昇・下降相場パフォーマンス分析(Up and Down Markets Performance Analysis) 相場の上昇時、下落時に分けて、選択された運用プロダクトのパフォーマンスに特徴があるかを確認。例に挙げたこの表では上から 2 番目 (FIDEL2K)のフィデリティは、上昇相場での勝率が 67%と高いが、下落相場では 50%で、上昇相場では超過収益が平均的に達成されて いるが、下落相場では平均超過収益はマイナスとなっている。 Up and Down Markets Performance Analysis 日本株 (all funds) Monthly Returns - before fees for the 3 Year period from Apr 2001 to Mar 2004 Manager ALLIAK FIDEL2K APSGJE PICTETK JARDINK CAPITALJ RSNBH TKIOMAK Benchmark: TOPIX Upper Quartile Median Lower Quartile Up Markets Down Markets All Markets Average Excess Return (%) Outperformance Average Outperformance Average Outperformance Average Manager Manager No. % Ex Ret (%) No. % Ex Ret (%) No. % Ex Ret (%) Outperformed Underperformed 4 22 -0.63 12 67 0.38 16 44 -0.12 1.48 -1.41 12 67 0.60 9 50 -0.13 21 58 0.23 1.33 -1.30 6 33 -0.65 11 61 1.24 17 47 0.30 3.45 -2.53 9 50 0.10 13 72 0.79 22 61 0.44 1.57 -1.33 8 44 -0.19 7 39 0.20 15 42 0.00 1.16 -0.82 8 44 0.17 9 50 0.00 17 47 0.08 1.31 -1.02 7 39 -0.21 7 39 -0.34 14 39 -0.28 1.03 -1.11 9 50 -0.02 6 33 -0.16 15 42 -0.09 1.20 -1.02 18 18 36 10 56 0.13 11 61 0.29 21 58 0.18 1.12 -0.71 8 44 -0.16 9.5 53 0.03 17 47 -0.02 0.87 -0.92 6 33 -0.41 8 44 -0.17 14 39 -0.24 0.68 -1.15 19 16. 相関分析(Returns Correlation Analysis) トータル・リターンと超過収益ベースの 2 種類で計算が可能。下の例は超過収益ベースで計算。上の段で、個別の運用プロダクトの超過収益 とトラッキング・エラーを表示。下段で、相関(右斜め上)とリスクの低減幅(左斜め下、50 対 50 で2プロダクトを組み合わせた場合のト ラッキング・エラーの低減効果)を表示。 Returns Correlation Analysis 日本株 Monthly Returns - before fees Excess Return against the TOPIX Index - for the 3 Year period from Apr 2001 to Mar 2004 Manager Excess Return Tracking Error APSGJE ALLIAK CAPITALJ DAISMV 3.5 -1.4 0.8 4.4 13.4 6.6 5.3 3.8 0.38 0.60 -0.30 Risk Reduction / Correlation APSGJE ALLIAK -1.48 0.67 CAPITALJ -0.79 -0.50 DAISMV -2.23 -2.22 -0.44 -0.31 -1.83 Notes: Correlation is shown in the right hand side of the table. Risk Reduction is shown in the left hand side of the table. Risk Reduction is defined as the reduction in tracking error from diversification when using a 50:50 mix of the two managers. 20 17. 付加価値の信頼度(Confidence of Value Added) 統計的に、アルファが獲得される確率(アルファがゼロである可能性から、どれだけ遠いか)をユニバース内で表示。50%未満は、選択期 間において、マイナスであったことを示す。 21 18.マーサー・サーベイ 運用プロダクトのリターン結果などを一覧表やチャートで表示。 アウトプット・タ イプをプルダウ ン・メニューで選 択。 日本株のようにサブ・ユニ バースがある場合、サブ・ ユニバースで区分されて表 示される。このチェックを 外すとサブ・ユニバースで 区分されない。 リストから除 外が可能 22 日本株 2004年3月末までの期間のリターン 運用機関名/プロダクト名 直近四半期 (%) 順位 過去1年間 (%) 順位 コア CAAM日本株アクティブ CSAM日本株コアコンポジ DTB国内株式アクティブ 大和住銀内株アルファ MHTB日本株市場型21 野村日本株アクティブ・コア りそな株式口市場型A ラッセル 日本株式ファンド SG山一日本株アクティブバリュー SG山一市場志向型日本株 シュローダー日本株アクティブ UBSグローバル日本株式アクティブ Z018 Z020 Z123 Z146 Z148 Z219 Z274 Z427 Z584 Z829 Z837 Z876 Z931 Z958 Z975 Median 8.8 12.3 9.0 14.5 14.2 11.7 13.3 14.8 12.9 12.9 12.3 11.9 15.4 13.6 12.3 10.7 11.0 16.0 10.1 9.1 12.8 12.4 12.0 14.0 14.4 12.6 10.7 12.4 (27) (15) (26) (4) (6) (20) (9) (3) (10) (10) (15) (19) (2) (8) (15) (22) (21) (1) (24) (25) (12) (14) (18) (7) (5) (13) (22) 40.2 45.4 52.8 56.1 48.7 52.3 52.5 61.1 52.4 51.0 39.6 44.1 55.5 50.2 45.8 46.8 49.6 58.0 49.0 39.7 52.5 55.4 48.2 52.3 56.6 50.4 44.1 50.4 (25) (22) (7) (4) (18) (11) (8) (1) (10) (13) (27) (23) (5) (15) (21) (20) (16) (2) (17) (26) (8) (6) (19) (11) (3) (14) (23) -1.1 3.0 4.9 9.0 5.6 6.2 5.8 9.2 7.4 7.2 1.4 3.8 11.4 6.9 3.1 3.7 6.9 9.8 5.2 1.2 3.1 7.8 4.3 6.2 9.9 6.7 2.4 5.8 (27) (23) (17) (5) (15) (12) (14) (4) (7) (8) (25) (19) (1) (9) (21) (20) (9) (3) (16) (26) (21) (6) (18) (12) (2) (11) (24) -6.3 -4.3 -4.6 1.1 -2.1 -1.5 -2.6 2.3 -1.6 -1.5 -3.0 -3.5 2.0 -2.1 -2.9 -4.5 -1.9 0.3 -3.1 -4.6 -4.9 -0.9 -3.7 -1.5 2.4 -2.1 -5.2 -2.1 (27) (21) (23) (4) (12) (7) (15) (2) (10) (7) (17) (19) (3) (12) (16) (22) (11) (5) (18) (23) (25) (6) (20) (7) (1) (12) (26) -4.5 -2.3 -2.5 3.3 -1.6 0.9 na na -0.4 -0.3 0.5 -0.9 3.5 -1.2 -1.8 -1.6 -1.0 2.8 0.0 -0.8 -2.1 1.0 0.8 0.3 3.4 -1.9 -1.6 -0.8 (25) (23) (24) (3) (17) (6) バリュー 大和住銀内株バリュー ラザード日本株式バリュー 三井生命国内株式バリュー型 りそな株式口バリュー重視F りそな株式口バリューL SSTB 国内株式 Active Z089 Z212 Z314 Z369 Z500 Z592 Z923 Median 15.3 9.6 14.9 16.4 18.7 15.9 16.1 12.3 13.0 15.1 14.8 13.3 14.7 14.9 (5) (13) (7) (2) (1) (4) (3) (12) (11) (6) (8) (10) (9) 61.0 39.7 48.7 50.9 55.4 60.5 56.9 61.5 51.7 57.0 56.1 58.6 46.8 56.1 (2) (13) (11) (10) (8) (3) (6) (1) (9) (5) (7) (4) (12) 11.2 6.3 6.9 7.8 11.8 11.2 8.7 9.5 10.1 15.2 10.2 9.3 6.6 9.5 (3) (13) (11) (10) (2) (3) (9) (7) (6) (1) (5) (8) (12) 2.8 -3.8 0.7 -0.7 3.5 2.4 1.5 1.2 1.1 7.5 1.1 1.4 -1.3 1.2 (3) (13) (10) (11) (2) (4) (5) (7) (8) (1) (8) (6) (12) 5.2 1.2 0.3 na na 3.6 1.7 na 3.7 9.1 1.9 1.9 -1.5 1.9 (2) (8) (9) グロース ABN AMROジャパン・エクイティ フィデリティジャパングロース2 フィデリティージャパンマネージドグロー JF 日本株式 GARP MHTB日本株成長型20 野村日本株式グロース ピクテ日本株アクティブ りそな株式口成長株重視H 東京海上AMGARP Z468 Z599 Z918 Z939 Median 11.8 10.9 11.6 9.9 9.1 10.2 8.5 12.6 9.8 11.0 14.6 11.1 10.9 10.9 (3) (7) (4) (10) (12) (9) (13) (2) (11) (6) (1) (5) (7) 37.8 57.0 57.5 48.1 42.5 43.7 59.1 50.9 51.2 47.1 56.7 47.3 45.4 48.1 (13) (3) (2) (7) (12) (11) (1) (6) (5) (9) (4) (8) (10) -1.8 10.6 8.4 6.5 -3.6 1.3 13.0 3.0 4.5 2.9 7.3 5.8 1.0 4.5 (12) (2) (3) (5) (13) (10) (1) (8) (7) (9) (4) (6) (11) -8.7 0.6 0.0 -1.6 -9.3 -3.1 3.7 -5.0 -2.9 -5.1 0.8 -1.9 -5.9 -2.9 (12) (3) (4) (5) (13) (8) (1) (9) (7) (10) (2) (6) (11) -4.4 6.4 5.2 2.6 -4.1 0.8 6.5 na -0.2 -2.8 4.9 2.3 -2.6 1.5 その他 ABNAMROビヘイビアル・ファイナンス APSグロース 日本株式 アバディーン国内株式 アライアンス日本株アクティブ CSAM日本株メガ代表 CSAM日本株コア代表 キャピタル日本株式 大同生命円貨建株式口 第一生命国内株アクティブ 大和住銀内株大型バリュー DeAM日本株式大型アルファ MFS日本株式 MHTB日本株割安型9 三井生命国内株式アクティブS型 明治安田生命円貨建株式口 スパークス日本株式アクティブ 住信アセット 国内株式標準型 東京三菱AM-SPIRIT ウェリントン日本株式 Z003 Z044 Z080 Z093 Z111 Z157 Z174 Z185 Z197 Z211 Z322 Z375 Z395 Z414 Z455 Z511 Z590 Z683 Z689 Z719 Z731 Z757 Z816 Z826 Z888 Z897 Z935 Z936 18.8 13.5 12.8 6.4 9.8 11.0 12.0 10.3 11.0 14.8 7.2 7.8 15.3 9.9 11.5 17.6 10.5 14.2 11.7 14.3 12.9 11.8 14.1 14.6 14.7 12.3 9.5 14.2 10.6 10.1 9.3 9.5 11.7 8.1 16.9 10.9 7.0 11.3 10.1 14.9 11.9 14.0 11.1 10.3 11.5 14.1 12.4 (1) (15) (17) (50) (41) (31) (21) (36) (31) (6) (48) (47) (4) (40) (27) (2) (35) (10) (24) (9) (16) (23) (12) (8) (7) (20) (42) (10) (34) (38) (45) (42) (24) (46) (3) (33) (49) (29) (38) (5) (22) (14) (30) (36) (27) (12) (19) 51.8 37.7 35.4 39.8 41.2 46.3 56.7 42.1 42.4 na 48.4 52.3 55.3 42.2 44.4 74.1 51.0 50.9 42.1 58.6 52.5 52.7 60.7 62.8 60.1 54.9 48.1 48.2 38.2 61.4 50.8 48.4 41.4 36.9 65.7 49.6 37.1 44.4 48.6 53.7 44.6 54.3 47.0 42.1 45.8 48.6 53.6 (17) (46) (49) (44) (43) (30) (8) (38) (36) 5.4 -1.0 3.8 4.0 -2.2 2.1 8.5 1.7 1.9 na 4.8 16.8 10.0 0.9 2.0 14.6 5.9 6.7 4.2 11.3 7.3 6.2 9.1 11.6 11.7 4.9 2.9 5.8 -1.0 na 9.8 2.4 2.6 2.5 12.4 5.5 -4.0 5.2 1.5 9.4 2.4 8.6 3.4 1.7 2.2 1.6 6.6 (20) (45) (27) (26) (47) (35) (12) (39) (38) -4.8 1.9 -0.7 -3.0 -8.4 -4.7 -0.8 -7.7 -5.4 na -2.9 7.2 0.5 -6.1 -4.3 10.0 -0.1 -1.3 -2.4 2.8 -1.1 -0.3 -0.2 2.9 1.4 -3.5 -3.8 -0.6 -5.9 na 3.0 -4.2 -2.1 -4.2 na -2.3 -7.4 -1.4 -6.7 0.2 -7.3 -0.2 -4.7 -7.7 -4.6 -5.4 0.5 (36) (6) (16) (26) (47) (34) (18) (45) (38) na na 1.1 -0.3 -2.6 -2.6 2.5 -3.2 -2.6 na 6.3 na 0.3 -2.4 -2.6 14.0 1.4 -1.3 -0.7 3.7 1.0 na 1.2 na 2.2 0.0 -0.7 1.6 -1.4 na 5.1 -2.8 5.8 0.2 na na -4.0 2.1 -4.0 1.1 -1.4 2.1 -2.2 -3.2 -3.3 -3.7 3.7 Fund Type (25) (16) (9) (37) (34) (1) (18) (19) (38) (7) (15) (14) (5) (3) (6) (10) (28) (27) (45) (4) (20) (25) (42) (48) (2) (22) (47) (34) (23) (12) (33) (11) (29) (38) (31) (23) (13) 過去2年間 (%/年) 順位 (24) (1) (7) (44) (36) (2) (17) (14) (25) (6) (13) (16) (10) (5) (4) (22) (29) (18) (45) (8) (32) (30) (31) (3) (19) (48) (21) (42) (9) (32) (11) (28) (39) (34) (41) (15) 過去3年間 (%/年) 順位 (25) (2) (8) (41) (32) (1) (11) (20) (24) (5) (19) (14) (12) (4) (7) (27) (29) (15) (40) (3) (30) (22) (30) (23) (44) (21) (42) (10) (43) (12) (34) (45) (33) (38) (8) 過去5年間 (%/年) 順位 (12) (11) (8) (14) (1) (16) (20) (17) (15) (4) (10) (13) (22) (5) (7) (9) (2) (21) (17) リターン・サーベイ 上部にメニューが表示 されて、スプレッドシー トへの出力も可能。 (4) (7) (3) (1) (5) (5) (10) (12) (2) (3) (5) (11) (7) (1) (8) (10) (4) (6) (9) (15) (22) (30) (30) (7) (35) (30) (2) (19) (29) (30) (1) (13) (25) (23) (5) (17) (14) (8) (21) (23) (12) (26) (4) (34) (3) (20) (39) (9) (39) (15) (26) (9) (28) (35) (37) (38) (5) 23 トラッキング・エラ ー・チャート 斜めの直線はインフォ メーション・レシオが 1のライン 24 19. ユーザー・データベース まず、New Database をクリックして、データベースを作成する。 ここをクリックして、デ ータベースを作成する。 データベースを作成後、実際 のデータの入力には、ここを クリックする。 25 次のウインドウが表示されるので、名称とファイル名を入力する。文字数の制限があるので、この制限に合わない場合、ウォーニングが表示 される。データベースのファイル名は、”UU****.DB“の形式で入力する必要(****に任意のアルファベットあるいは数字を入れる)がありま す。また、DB の前は 8 文字以内となっています。以下で、例として名前とアルファベットを使った名前を入れております。 26 データベースの作成後に、”New Series”をクリックして、データを入力しますが、まず、次のウインドウが表示されます。Name は 5 文字以 上で入力する必要があります。以下、例として、 “サンプル 01”という名前を入力しました。Asset Class では、 “日本株”を選択しましたが、 これは実際にはユニバースの意味で、入力したデータは選択されたユニバースでのみ表示されます。MPA 日本バージョンでは、最初に述べ ましたように、日本語とアルファベットのユニバースがありますが、ここで Asset Class で、”Japanese Equity”を選択した場合、 “日本株” ユニバースを選択してもユーザーの入力したデータが確認できないことにご注意ください。 Data Type や Fund Type の選択を機能上はあまり関係ありませんが、どのようなリターンを入力したかのメモ代りとして位置づけることが できます。Series Type は、”Portfolio”か”Benchmark/Index”が選択できますが、”Benchmark/Index”を選択すると、MPA の機能上、インデ ックスとして位置づけられて各機能を利用できることになります。 27 次に実際にデータを入力する場合は、2つの方法がありますが、次の例は、”Edit Returns”をクリックした場合に表示される画面です。 28 もうひとつの方法は、”Edit in Spreadsheet”をクリックした場合で、次の画面が表示されます。この画面では、Excel 等のスプレッドシート に入力されているデータをコピーして、この画面に貼り付けることが可能になっています。 29 入力したデータの利用にあたっては、利用したいデータ含まれるユニバースの選択後に、Database の名前の左にある”User”ボタンをクリッ クします。そうするとデータベースの選択画面が表示されますので、利用したいユーザー・データベースを選択します。 ユーザー・ ボタン 30 データベースを選択しますと、そのデータベースに含まれているデータは、マーサーのデータベースに登録されている運用プロダクトの最後 尾に表示される仕組みになっています。 データの最後にユー ザー・データが表示 される。 31 ユーザー・データベースのファイルは、MPA のフォルダーの中に登録した名前で含まれています。MPA を四半期毎にダウンロードする場合 には、このファイルが含まれないような格好で、フォルダーを作成すると、MPA 上でユーザー・データベースが利用できないことになりま す。MPA の更新後に、MPA の利用上ユーザー・データベースが見つからなくなった場合、更新したフォルダーに含まれているかどうかの確 認が必要になります。 MPA のフォルダー内に ユーザー・データベース が保存される。 32 19’. コンポジット・リターンの作成 新たにリターンを登録する場合に、 “Data Type”で“Composites (mix existing managers and indices)”を選択すると登録されているデー タの合成リターンを作成することができます。 属性を選択した後に、“Edit Returns”をクリックすると次の画面があらわれますので、“Manager List”から登録されているプロダクトを 複数(合計 10 プロダクトまで可能)選択して、それぞれのウエイトを合計が 100%になるように入力するとその比率での合成リターンが計 算されます。この合成リターンは、ユーザー・データとして、分析することができます。 33 34 20. エクスポート・データ メイン・メニューのエクスポート・データをクリックすると、次の画面が表示され、エクスポートするユニバースを選択するように指示され ます。データの出力は、リターンの形式(Export Returns)か指数化した数字(Export Index Values)かを選択できます。 35 21. スネイル・トレイル リスクとリターンの時系列の変化をグラフ化したもの。 36 22. スタイル分析 Style Chart 下図の例は2運用機関の例で、スタイル・インデックスのリターンとの関係を統計的に処理して、スタイルを推定するもの。実際にはスタイ ル・インデックスとの関係なので、スタイル・インデックスの作り方が大きく影響を与える。 日本株 Style Analysis 100.0 7 15 90.0 1 80.0 14 43 70.0 % of Total 60.0 RNRISCV RNRISCG 50.0 RNRILCV RNRILCG 40.0 70 30.0 51 20.0 10.0 0.0 Z045 Z105 3 Years ending September 2004 37 Rolling Style Analysis スタイルを時系列でグラフ化したもの。 XXX国内株式 (XXX) 日本株 Style Analysis - Rolling 3 Years from Sep 2001 to Sep 2004 100 Style Coefficient (%) 80 60 RNRISCV RNRISCG RNRILCV RNRILCG 40 20 0 Sep-01 Mar-02 Sep-02 Mar-03 Sep-03 Mar-04 Sep-04 3 Years ending 38 Style Report スタイル調整のパフォーマンス要因分析。推定スタイルの信頼度も Standard Error(標 準誤差)で表示。また、スタイルによる説明度(% of Variation in Excess Return by Style) も表示。 日本株 Style Analysis for the 3 Years ending September 2004 XXX国内株式 (XXX) Index Coefficient Russell/NRI Large Cap Growth Russell/NRI Large Cap Value Russell/NRI Small Cap Growth Russell/NRI Small Cap Value Constant (%pa) 80.0 15.6 0.0 4.4 3.3 Standard Error 11.9 18.5 10.9 16.0 1.0 % of Variation in Excess Return Explained by Style Index Coefficient 40.4 42.1 2.7 14.8 -1.2 31% Correlation of Regressors (Excess Returns) Index RNRILCG RNRILCV RNRISCG Russell/NRI Large Cap Growth Russell/NRI Large Cap Value Russell/NRI Small Cap Growth Russell/NRI Small Cap Value 1.0 -0.7 -0.3 -0.7 -0.7 1.0 0.0 0.3 RNRISCV -0.3 0.0 1.0 0.5 -0.7 0.3 0.5 1.0 Value Added over Benchmark Return % pa Standard Deviation Tracking Error TOPIX XXX国内株式 Value Added 3.6% 5.6% 2.0% 15.3% 13.5% -1.8% 6.4% TOPIX Style Benchmark Value Added 3.6% 2.2% -1.4% 15.3% 15.1% -0.2% 3.5% Style Benchmark XXX国内株式 Value Added 2.2% 5.6% 3.4% 15.1% 13.5% -1.6% 5.3% Return % pa Excess Weight Value Added 0.6% 5.8% 4.3% 13.7% +39.6% -26.6% -2.7% -10.4% -1.2% -0.6% 0.0% -1.0% 1.5% -1.4% Style versus Benchmark Russell/NRI Large Cap Growth Russell/NRI Large Cap Value Russell/NRI Small Cap Growth Russell/NRI Small Cap Value Unexplained TOTAL 39 Style Map ユニバース登録のファンドのスタイル分布を表示。 Mercer 日本株 Universe (all funds) Style Map for 3 years ending 30 June 2004 % Value 100 80 60 40 20 0 10 80 20 70 30 60 40 50 50 40 60 30 70 20 80 10 90 0 20 40 60 80 % Small Cap % Large Cap より大型 90 100 % Growth XXX TOPIX よりグロース 40 23.用語集 Return(リターン) The net increase (or decrease) in value of the invested assets after allowing for cashflow. Returns in Mercer MPA are stored monthly or quarterly. All returns in the system are provided by investment managers. Mercer makes no warranty as to the accuracy of the returns. Returns for periods greater than one year are annualised in MPA. キャッシュフロー考慮後のポートフォリオの価値の増加(減少)のこと。MPA 内のリターンは月次、あるいは四半期次で入力されている。す べてのリターンは運用機関が提供しているものであり、マーサーはその正確性を保証するわけではない。1年よりも長期のリターンは年率化さ れる。 Universe/Peer Group(ユニバース/ピア・グループ) A group of managers' products that approximates the available choice of products in that asset class for an institutional investor. Mercer determines the constituents of a universe after analysis of the appropriateness of each product. The definition of asset classes is based on the types of mandates that our clients typically define when conducting a manager search. Asset classes and universes are defined in such a way that allows an apples-to-apples comparison between the products. Therefore, we consider factors like style, capitalisation, currency hedging, tracking error, and other factors affecting portfolio construction when defining asset classes and the eligibility of particular products. 年金等の機関投資家によって採用されうる運用商品を資産ごとにまとめたもの。ユニバースの構成商品については、マーサーが個別商品の適切 性を分析の後に決定する。 資産の定義は、マーサーの顧客が通常、求める区分を基本とする。 資産とユニバースは商品の適切な比較がなされるように定義される。それゆえ、運用スタイル、時価総額、通貨ヘッジ、トラッキング・エラー、 その他のポートフォリオ特性に影響を与える要因を考慮して、資産や個別商品の適格性の定義をしている。 41 Median(メジアン) If the results in the sample were listed from smallest to largest, the median would be the middle value. データを最小から最大に並べて、メジアンは真中の数字。 Upper/Lower Quartile(75 / 25 パーセンタイル) The lower quartile is value that has 25% of the sample below it and 75% above it. The upper quartile has 75% of the sample below it and 25% above it. 25 パーセンタイルは、下から 25%に位置(それより下に1/4データがある)し、75 パーセンタイルは下から 75%に位置(それより上位には 1/4のデータがある)する。 Mean(ミーン、平均) The mean is the average value of the sample. It is calculated by adding up all of the results and dividing by the number of results. The median is often used in preference to the mean, as the mean is more affected by extreme outliers. データの平均。 Asset-Weighted Mean(資産加重平均) The asset weighted mean is calculated by weighting each sample value according to the size of the fund. The asset weighted mean will be influenced more heavily by the larger funds. ファンドのサイズに応じて加重して計算した平均。資産額の大きなファンドがより影響する。 Correlation(相関) This measures the extent to which the change in one variable is related to the change in another variable. あるデータとあるデータの変化の関係。 42 Risk(リスク) Risk refers to the variation or volatility of returns. It is generally measured by the standard deviation or the tracking error リスクはリターンの変動性のこと。一般的に、標準偏差あるいはトラッキング・エラーのこと。 Excess Return(超過収益) The Excess Return is the portfolio return for the period minus the relevant index return for the period. For periods greater than one year, it is the annualised portfolio return minus the annualised index return. 選択されたインデックスのリターンとポートフォリオのリターンとの差。1 年以上の数字は年率化されて表示。 Standard deviation(標準偏差) Standard deviation is a measure of the absolute variability of returns. volatility of returns or investment risk. Standard deviation is the most commonly used measure of the Standard Deviation is calculated as the square root of the sum of the squared deviations from the mean of the sample. In general, the standard deviation will be annualised. リターンの変動性の1計算手法。標準偏差は最も一般的に使われるリスク。 データの平均との差の2乗の合計の平方根。一般的に年率の数字を使う。 Standard Deviation is calculated according to the following formula: 次の計算式で標準偏差は計算される。: ∑ (r − r ) n Annualised Standard Deviation = σ, = 100* 12 * i =1 2 i 43 Unbiased estimator of annualised σr = 100* 12 * 1 n 2 1 n 2 ∑ r i − (∑ r i ) (n − 1) i =1 n i =1 Where ri = return in the ith month n = the number of months in the period Reward to Risk Ratio(リワード・ツー・リスク・レシオ) The reward to risk ratio is the annualised return divided by the annualised standard deviation. risk and return. The higher the result the greater the level of return per unit of risk taken. It is a measure of the trade-off between リターン(年率)を標準偏差(年率)で割った数字。リスクとリターンのトレード・オフを図る。数字は大きいほうが 1 単位当たりのリスクに 対してリターンがよいということ。 Tracking Error(トラッキング・エラー) Tracking error is a measure of a manager's risk or volatility compared to a benchmark. It is a relative measure and does not attempt to measure absolute return or absolute risk. In essence, it measures the risk of significant departures from the benchmark. ベンチマークに対する運用機関のリスクあるいは変動性の測り方。相対的なリスクで絶対的なリスクではない。ベンチマークからの乖離のリス ク。 A portfolio with a low tracking error will follow the index closely while a portfolio with a high tracking error may depart from the index significantly. Mercer calculates the tracking error as the standard deviation of the monthly or quarterly excess returns. This standard deviation is then annualised by multiplying it by root twelve (monthly) or root four (quarterly). 低トラッキング・エラーのポートフォリオはインデックスのリターンに近く、高トラッキング・エラーのポートフォリオはインデックスのリタ ーンと大きく異なる。マーサーはトラッキング・エラーを月次あるいは四半期次の超過収益の標準偏差として計算している。この標準偏差を年 率化しているが、月次データの場合、12 の平方根、四半期データの場合は4の平方根を乗じて計算している。 Annualised Tracking Error = 100 * 12 * 1 n 1 n 2 − (∑ er i ) 2 ∑ er i (n − 1) i =1 n i =1 44 Where eri= excess return in the ith month (portfolio return - index return) n = the number of months in the period Tracking error is best used to evaluate managers who manage portfolios directly against the index. This is best thought of as a manager who starts with an index portfolio and then makes specific ‘tilts’ or ‘bets’ away from the index. Most managers can be classified in this manner. トラッキング・エラーはインデックスを意識した運用を行っている運用機関を評価するにあたって使うことが適切である。まず、インデックス と同じポートフォリオから始めて、そこから、“ティルツ”(偏らせる)あるいは“ベット”(賭ける)する運用に対して適切で、ほとんどの運 用機関はそのような運用をしていると考えられる。 Information Ratio(インフォメーション・レシオ) Tilts or bets away from the benchmark lead to tracking error in the portfolio. The information ratio measures the success of these ‘tilts’ away from the index. ベンチマークに対する“ティルツ”と“ベット”によりトラッキング・エラーが生ずる。インフォメーション・レシオはこのインデックスから の差に対する成功度を測る指標である。 The information ratio measures the amount of ‘information’ that the manager can extract from the market. Expressed in another way this is the amount of excess return generated per unit of risk or tracking error added. Therefore, インフォメーション・レシオは、運用機関が抽出する“情報”を測るものである。このことはリスク、つまりトラッキング・エラー1 単位当た りの超過収益であり、次の式で計算される。 Information Ratio = Excess Return (%pa) Annualised Tracking Error One of the advantages of looking at the information ratio is that the more aggressive managers can be evaluated on the same basis as the conservative ones. Consider two managers who, with equally sized portfolios, make the same bets away from the index. Manager A takes bets that are double the size of manager B. If the bets add value, manager A will achieve a higher return and a higher ranking in the performance surveys. However, the information ratios will be the same for both managers. Managers should not necessarily be rewarded for using the same information but achieving a higher return through higher risk. インフォメーション・レシオの利点のひとつは、リスクのとり方で積極的な運用機関と慎重な運用機関を同じベースで評価できるということ。 例えば、運用機関AとBがあり、同じ投資判断をしたが、AがBの2倍のリスクをとった場合、Aはより高いリターンを獲得する結果になる。 45 しかしながら、インフォメーション・レシオでは同じになる。運用機関は同じ投資判断をしたからと言って、同じリターンになるわけではなく、 高いリスクから高いリターンを獲得するという場合があるのである。 The information ratio is therefore a measure of the skill of the manager. If the information ratio is large and it is measured over a reasonable period of time, then this is an indication that the manager has some skill in managing money. インフォメーション・レシオはそれゆえ運用機関のスキル(能力)を測る数字である。 Mercer defines the information ratio as the annualised excess return divided by the annualised tracking error. Note that others may define this statistic differently. The information ratio (when not annualised) multiplied by the square root of the number of periods over which it was measured is a t-statistic that measures the significance of the value added. マーサーのインフォメーション・レシオの計算は年率超過収益を年率トラッキング・エラーで割ったものであるが、これ以外の計算の仕方もあ る。インフォメーション・レシオ(年率化されていない数字)に対象期間数の平方根を乗じることで付加価値の確かさを計測するt値が得られ る。 T-score(T−スコア) A positive excess return or alpha implies that the manager may have some skill in managing money. It is also possible, through a statistical test, to prove whether or not this result is statistically significant. Statistical significance relates to whether the result is due to chance or whether it implies that the manager has some skill. As the likelihood of the result occurring by chance falls, the significance of the result increases. プラスの超過収益(アルファ)は運用機関の運用能力を示唆するものである。この数字は統計的な有意性の検定が可能である。統計的有意性は 運用結果が運によるものでるか能力であるかを判定するものでる。運による可能性が少なければ、結果の有意性が高まる。 The test for statistical significance makes an allowance for the period of measurement (the longer the period the greater the significance) and the volatility of the results (the more volatile the results the more likely that the outcome was due to chance). A t-score gives an indication of the degree of confidence we can have that the value added by the manager is statistically significant. In general terms, a t-score of greater than 2 is normally taken as being statistically significant, that is, we can be reasonably certain that the manager has some skill. 有意性の検定には、計測期間(長期であれば有意性は高まる)と結果の変動性(変動性が高ければ運である可能性が高まる)を考慮する必要が ある。 t―スコアは運用機関の超過収益に対する信頼度の統計的な有意性を示すものである。一般的にt−スコアが2より大きい場合統計的に有意で あり、運用機関に能力があると考えることができる。 46 The Information Ratio (when not annualised) multiplied by the square root of the number of periods over which it was measured is a t-statistic that measures the significance of the value added. インフォメーション・レシオ(年率化されていない数字)に対象期間数の平方根を乗じることで付加価値の確かさを計測するt値が得られる。 T-score = Average Excess Return (monthly/quarterly) Standard Error of Excess Return The standard error is equal to the standard deviation of the monthly/quarterly excess returns divided by the square root of the number of observations. 標準誤差は月/四半期超過収益の標準偏差を観察数の平方根で割ることで得られる。 Skewness(歪度) Skewness characterises the degree of asymmetry of a distribution around its mean. Positive skewness indicates a distribution of excess return over the benchmark with an asymmetric tail extending towards more positive values. Negative skewness indicates a distribution of excess return over the benchmark with an asymmetric tail extending towards more negative values. 歪度は平均の周りの非対称性の度合いを示すものである。正の歪度は超過収益の分布がよりプラス側に偏って広がっていることを示す。負の歪 度は分布がマイナス側に偏って広がっていることを示す。 The formula for skewness is: n xi - µ (n-1)(n-2) ∑ s 3 where s is the standard deviation. Kurtosis(尖度) Kurtosis characterises the relative peakedness or flatness of a distribution compared to the normal distribution. Positive kurtosis indicates a relatively peaked distribution. Negative kurtosis indicates a relatively flat distribution. 尖度は正規分布に対して分布の尖鋭度を測るもの。正の尖度は比較的尖った分布を示し、負の尖度は比較的平坦な分布を示す。 4 2 3(n-1) n(n+1) xi - µ ∑ The formula for kurtosis is: (n-1)(n-2)(n-3) s - (n-2)(n-3) 47 where s is the Standard Deviation Semi Standard Deviation(下方標準偏差) The semi-standard deviation is a measure of the downside volatility of returns. Therefore, monthly returns that are above a defined level are excluded from the calculation. This is regarded by some as a more appropriate measure of risk as it does not regard positive volatility as inherently risky. The benchmark can be defined in a number of ways. Mercer MPA calculates semi-standard deviation against zero and against the mean. 下方標準偏差はリターンのダウンサイドのチラバリを示すものである。それゆえ、一定水準を上回る月次リターンの数字は計算から除かれてい る。この数字はプラスのチラバリをリスクと考えない場合には適切である。ベンチマークの設定にはいろいろな考え方がある。マーサーMPA では下方標準偏差の計算はゼロと平均に対して可能である。 Regression Results(回帰分析結果) Mercer MPA also presents the results of an ordinary least squares regression between the manager returns and the index returns. A regression attempts to explain the manager’s returns in the form of a straight line with the following formula: マーサーMPA は運用機関のリターンとインデックスのリターンの関係を最小二乗法で計算した結果を表示できる。この計算で運用機関のリタ ーンを次の一次式で説明しようとするものである。 Manager Return = Alpha + Beta * Index Return The Alpha and Beta are mathematically calculated values that give the best fit for the regression line. This alpha and beta should not be confused with alpha and beta defined under CAPM or other market models. ここでのアルファとベータは回帰式で計算されたものであり、CAPM などの市場モデルで定義されたものと混同されてはならない。 Beta(ベータ) Beta is defined as the extent to which the manager’s returns have varied in line with movements in index returns. A beta of greater than 1 indicates that when the market rises, the manager is likely to perform better than the market. A beta of less than 1 indicates that when the market rises the manager will not perform as well as the market. The converse is true in falling markets. Beta is calculated using the following formulae: ベータは運用機関のリターンのインデックスのリターンに対する感応度と定義している。ベータが1より大きい運用機関は、マーケットが上昇 している場合、マーケットを上回るリターンになることになる。ベータが1より小さい運用機関は、マーケットが上昇している場合、マーケッ トを下回るリターンになることになる。ベータは次の式で計算される: 48 ∑( n Srp = i =1 n Spp = ∑ i =1 where ) ri − r pi − p − i n n n 1 − (∑ pi ∑ r i ) p = ∑ r i pi n i =1 i =1 i =1 2 2 n n = p − 1 ( p ) 2 p ∑ ∑ i n i =1 i i =1 ri = the return for the portfolio in the ith month and pi = the return for the index in the ith month and n = the number of months in the period Beta = β = Srp/Spp Most managers would tend to have a beta of around 1, however, a low beta in a period of falling markets or a high beta in a rising market would explain an outperformance by the manager. ほとんどの運用機関のベータは1前後であるが、下落相場での1未満のベータあるいは上昇相場での1を上回るベータはアウトパフォーマンス ということを意味する。 It should be noted that a manager’s beta will change over time. A manager that is trying to ‘time’ the market will change the beta of the portfolio in response to expected market conditions. Therefore, the implicit assumption of the regression analysis, that beta is constant over the period, may be flawed. 運用機関のベータは期間によって変わるものである。マーケット・タイミングをはかるような運用機関のベータは予想される運用環境によりベ ータは変わる。回帰式はベータの不変を前提においているので、必ずしも正確ではないことに注意すべきである。 Alpha(アルファ) In the context of the regression results, alpha is the residual addition to the manager's return, when the effect of a beta different to one has been removed. A positive alpha would imply that the manager was able to add value through sources other than taking on a particular level of market risk. アルファは回帰分析の結果、ベータの影響を取り除いて得られる部分である。正の数字の場合、運用機関は、市場リスク以外の要因で付加価値 を生み出すことができることを示唆するものである。 49 Note that the alpha may vary from the historic excess return because it makes an allowance for the historic level of risk. Alpha may be calculated using the following formula: アルファは過去のリスクを考慮に入れたものであり、実績の超過収益とは異なるものである。アルファは次の式により計算される: ( Alpha = α = 100* r − β p ) = 100* n 1 n ∑ r i − β ∑ pi n i =1 i =1 MPA will annualise the alpha by compounding it for the number of periods in a year. MPA は1年間のうちの期間数を複利計算することで年率化したアルファを計算している。 R-Squared(Rスクエア、決定係数) The r-squared is a measure of the relationship between the manager’s return and the return of the chosen index. It measures the percentage of the manager’s return that can be explained by the return of the chosen index. 決定係数は運用機関と選択したインデックスの関係を示すものである。この数字は運用機関のリターンがインデックスで説明しうるパーセンテ ージを測るものである。 T-score on Alpha(アルファのT−スコア) A t-score gives an indication of the degree of confidence we can have that the value added by the manager is statistically significant. In general terms, a t-score of greater than 2 is normally taken as being statistically significant, that is, we can be reasonably certain that the alpha is greater than zero. t−スコアは運用機関の付加価値が統計的に有意であるかどうかの信頼度を示すものである。一般的に2より大きいt−スコアは統計的に有意であ り、アルファがプラスである可能性がかなり高いと期待できる。 50 The t-score is calculated by dividing the value of alpha by its standard error, where the standard error of the alpha is equal to: t−スコアはアルファを標準誤差で割ることによって計算される。アルファの標準誤差は次の式になる: σ () 1 1 + p n S pp Where: n Srr = 1 n p = ∑ pi n i =1 ∑ ri r i =1 n Spp = 2 ∑ i =1 − p − i and n 2 = ∑ ri 2 − i =1 σ = 1 n ( n Srr − β 2 * S pp ∑ r i) n−2 2 i =1 2 2 n n = p − 1 ( p ) 2 p ∑ i n ∑ i i =1 i =1 Confidence of Value Added(付加価値の信頼度) The confidence of value added by a manager versus the benchmark, which can range from 0% to 100%, is a statistical measure which provides insight into whether the manager's results were due to skill or luck. It takes into account not only the magnitude of excess return, but also the volatility of the excess return. 付加価値の信頼度(0%から 100%で表示される)は、運用機関のパフォーマンス実績が能力によるか運であるかを統計的に計測したものである。 この数字では超過収益の程度だけではなく、その変動性も考慮したものである。 Managers with a positive excess return will have a confidence level for that time period which is greater than 50%. Managers with a negative excess return will have a confidence level for that period which is below 50%. The further the confidence level is from 50%, the stronger the statistical proof that the historical results were statistically different from the benchmark. プラスの超過収益を達成している場合、その計測期間の信頼度は 50%以上となる。マイナスの超過収益の場合は 50%以下の信頼度となる。信 頼度が 50%から離れるほど、ベンチマークとの違いの信頼度がより高いということになる。 51 Confidence levels are determined from the cumulative probability of the students t-distribution underlying the statistical test of whether manager's excess return is significantly different to zero. The confidence level is equal to one minus the p-value. 信頼度は運用機関の超過収益がゼロとは異なるという検定をもとに、スチューデントt分布の累積確率から求めたものである。 Returns-based Style Analysis(リターンから推定するスタイル分析) The monthly returns on a fund/product over a period of time are compared to a selected number of indices. A regression analysis is performed to determine the mix of indices that best replicates the performance of the fund over the period. The analysis is done using excess returns over a specific benchmark. This has been found to yield better results than using total returns. 運用機関のリターンが選択された複数のインデックスのリターンに対して比較される。回帰分析が利用されて、運用機関のリターンがインデッ クスのどのようなウエイトでの組み合わせでよりよく説明されるのかを求める。分析は一定のベンチマークに対する超過収益の数字を使ってな される。超過収益の数字を使うことで、トータル・リターンの数字を使うよりも優れた結果を得ることができる。 The model is of the form: モデル式は次の形になっている: W(t) * (Y(t) - I(t)) = ∑ wi (W(t) * (Xi(t) - I(t))) + ∝ + ε(t) where: Y(t) = the return on the fund for month t Xi(t) = the return on index i at time t I(t) = the return on the benchmark for month t wi = the weighting of index I ∝ = the constant term (excess over the style benchmark) ε = the error term W(t)=the weighting function for month t = 2t/24 OR 1 (default) The residuals ε(t) can be weighted by the model. The Mercer model weights all of the observations equally (default) or you can choose to 52 use a weighting function that has a half life of two years. The purpose of using a weighting function is to give greater emphasis to more recent results. The weighting function used by the Mercer model gives half the weight to an observation two years ago compared to the weight for a current observation. 誤差項ε(t)は、モデルによってウエイトが決定される。マーサーのモデルは通常の設定では、すべてのデータを等ウエイトで分析しているが、よ り最近のデータに重みをつけることができる(“a half life of two years”)。これは 2 年より以前のデータを最近のデータに対して半分のウエイ トとするということで、より最近のデータが結果に反映されるためのものである。 The weights (wi) are estimated such that the sum of the squared error terms is minimised (∑ε2). ウエイト(wi)は、誤差項の二乗の合計が最小化されるように推定される。 Standard errors of the coefficients can be calculated from the multiple regression model. These statistics are important because they give an indication of the quality of ‘fit’ of the model, and also the confidence that we can have in the value of the weights chosen by the model. The model will warn the user if any of the standard errors are greater than 10%. 係数(ウエイト)の標準誤差は重回帰分析により計算される。この数字は得られた結果の質とウエイトの信頼度を示すものであるので重要であ る。標準誤差が 10%より大きい場合には警告メッセージが表示される。 Multicollinearity(多重共線性) Multicollinearity exists in a regression analysis where two or more of the regressors (style indices) are too highly correlated. This means that the regressors contain similar information and the model will have difficulty choosing between them. Multicollinearity will result in higher standard errors of the calculated coefficients. To avoid multicollinearity in style analysis you should choose style indices that are as mutually exclusive and independent as possible. 回帰分析を行う際、2つ以上の変数(スタイル指数)の相関が高い場合、多重共線性が存在する。このことはそれぞれの変数の類似性が高いの で、モデルで正確に判別することが困難になるということで、回帰分析で得られた結果の係数の標準誤差が大きくなる。 スタイル分析で多重共線性を避けるためには、分析に利用するスタイル指数が相互に関連性がなく、独立していることが望ましい。 Percentage of Excess Return Variation Explained by Style (スタイルにより説明される超過収益の比率) This measurement is similar to an R2 but the variation is measured around zero instead of around the mean excess return. This statistic 53 is a measure of the strength of the relationship between the manager’s excess return and the excess return on the style benchmark. この数字は R2 (決定係数)に近いが、乖離は超過収益の平均からの乖離ではなく、ゼロからの乖離として計測している。この統計は、運用機 関の超過収益とスタイル・ベンチマークの超過収益との関係の強さを示すものである。 In most cases this statistic will be small (<20%). This does not mean that the regression is a poor one, only that style is not explaining much of the variation in the manager’s excess return. A better test of the quality of the regression is the size of the standard errors of the coefficients. ほとんどの場合、この数字は小さい(20%未満)である。このことは回帰分析の結果が信頼できないということを意味するものではなく、スタ イルが運用機関の超過収益を説明する度合いが大きくないということにすぎない。回帰分析の信頼性の判断は、標準誤差ですべきである。 Percentage of Excess Return Variation Explained by Style = where ∑ (Y*(t) - I(t))2 ∑ (Y(t) - I(t))2 Y(t) = actual return Y*(t) = predicted return Standard Error(標準誤差) Standard errors of coefficients calculated from a multiple regression model represent the standard deviation of the estimator. These statistics are important because they give an indication of the quality of “fit” of the model, and also the confidence that we can have in the value of the weights chosen by the model. The results of the regression are thought to be unreliable if the standard errors are greater than a pre-defined percentage and the Mercer style analysis gives a warning if this is the case. 多重回帰分析により得られた係数の標準誤差は、推定結果の標準偏差ということ。この統計は結果の正確性およびウエイトの信頼性を示唆する ことになるので重要である。回帰分析で得られた結果は標準誤差が大きい場合には信頼できないということになり、マーサーのスタイル分析で は標準誤差が一定量を超えた場合には警告のメッセージが表示される。 54 24.ユニバースの種類と定義 日本版のユニバースはすべて円表示のリターンで、以下の種類のユニバースが作成されています(平成 17 年 3 月現在)。 ユニバースの中身やユニバースの種類は適宜見直し、追加をしていきます。 ユニバース 国内債券 定義 基本的に大型株を対象とする運用で、主要なベンチマークは TOPIX となるが、 ベンチマークを限定しているわけではない。 TOPIX に対するトラッキング・エラーが比較的低い運用で、大きくグロースや バリューの特性が出ない運用。 マーサーのリサーチャーがバリューとして位置づけた運用で、低 PBR や低 PER の特徴が比較的表れる運用。 マーサーのリサーチャーがグロースとして位置づけた運用で、高 PBR や高成長 率の特徴が比較的表れる運用。 まだ、マーサーのリサーチャーがスタイルを分類していない運用か、運用機関と 分類において意見が異なる運用。 基本的に NOMURA BPI をベンチマークとする運用。 インターナショナル株式(除く日本) 基本的に MSCI KOKUSAI をベンチマークとする運用。 インターナショナル債券(除く日本) 全体 日本を除くグローバルな債券運用で、企業年金に提供される運用で、中心は国債 だけを含むインデックスをベンチマークとする運用。 国債だけのインデックスヲベンチマークとする運用。 国債以外を含むインデックスをベンチマークとする運用。 中小型国内株式を対象とする運用で、必ずしも明確なベンチマークがあるわけで はない。 旧規制下での国内株、国内債、外国株、外国債の4資産を中心に投資する運用。 日本株 サブユニバース 全体 コア バリュー グロース その他 国債型 総合型 日本株(小型株) グローバル・バランス 55 オルタナティブ 全体 日本株(パッシブ) いわゆるオルタナティブと位置づけられている運用で、日本の企業年金で一般的 に採用されており、過大なリスクをとっていないと考えられる運用。海外資産を 対象とする運用は、為替ヘッジにより、通貨の変動によるリターンの変動が避け られていること。基本的に運用報酬控除後のリターン。 上記オルタナティブ運用の中で、複数のヘッジファンドに投資する運用商品を集 めたサブユニバース。投資対象となる個別ヘッジファンドの運用手法、投資対象 資産等の制約はつけていない。 上記オルタナティブ運用の中で、単独で運用を行っており、基本的にマーケッ ト・リスク(いわゆるベータ・リスク)をとらないことを方針としている運用商 品を集めたサブユニバース。投資対象資産による制約はつけていない。 上記オルタナティブ運用の中で、単独で運用を行っており、基本的にマーケッ ト・リスク(いわゆるベータ・リスク)をとらないことを、特に方針として掲げ ていない運用商品を集めたサブユニバース。投資対象資産による制約はつけてい ない。 TOPIX ベンチマーク 国内債券(パッシブ) NOMURA BPI ベンチマーク。 インターナショナル株式(パッシブ) MSCI KOKUSAI ベンチマーク。 ファンドオブファンズ マーケットニュートラル ロングショート ユニバース登録の基本的条件 ・ 企業年金等の投資家へ提供意思がある運用であること。 ・ 顧客口座の運用による実際の運用リターンで、運用残高が 5 億円以上あること。 ・ 基本的に、運用の一部を切り取った(カーブアウトした)運用リターンではないこと。但し、独立した運用と認めることができる場合に、 登録することがある。 ・ ユニバースごとに想定している資産への投資からのリターンが主たるリターンで、キャッシュやその他の資産からの影響が著しく高いとは 認められないこと。 ・ 時間加重収益の計算によるリターンで、オルタナティブなどの例外を除き、運用報酬控除前のリターンであること。 ・ 運用リターンは基本的に月次リターンを提供すること。 56 ・ 登録するリターンはコンポジット(対象講座の合算リターン)を優先的に提供するものとし、それが提供できない場合は代表口座など単独 口座のリターン、また、投資信託のリターンを提供するものとする。 57 (注記) ① TOPIX の指数値及び TOPIX の商標は、株式会社東京証券取引所(以下(東)京証券取引所という。))の知的財産であ り、この指数の算出、指数値の公表、利用など株価指数に関するすべての権利および TOPIX の商標に関するすべての権利は (株)東京証券取引所が有する。 ② (株)東京証券取引所は、TOPIX の指数値の算出若しくは公表の方法の変更、TOPIX の指数値の算出若しくは公表の 停止又は TOPIX の商標の変更若しくは使用の停止を行うことができる。 ③ (株)東京証券取引所は、TOPIX の指数値及び TOPIX の商標の使用に関して得られる結果並びに特定日の TOPIX の 指数値について、何ら保証、言及をするものではない。 ④ (株)東京証券取引所は、TOPIX の指数値及びそこに含まれるデータの正確性、完全性を保証するものではない。また (株)東京証券取引所は、TOPIX の指数値の算出又は公表の誤謬、遅延又は中断に対し、責任を負わない。 ⑤ 本データベースは、(株)東京証券取引所により提供、保証又は販売されるものではない。 ⑥ (株)東京証券取引所は、本データベースの購入者又は公衆に対し、本件使用に関するデータの説明、投資のアドバイ スをする義務を持たない。 ⑦ (株)東京証券取引所は、当社又は本データベースの購入者のニーズを、TOPIX の指数値を算出する銘柄構成、計算に 考慮するものではない。 ⑧ 以上の項目に限らず、(株)東京証券取引所は本データベースの提供に起因するいかなる損害に対しても、責任を有し ない。 58
© Copyright 2026 Paperzz