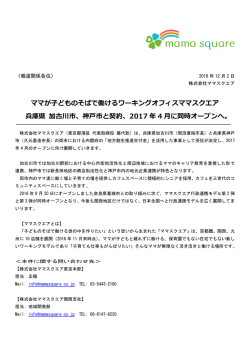
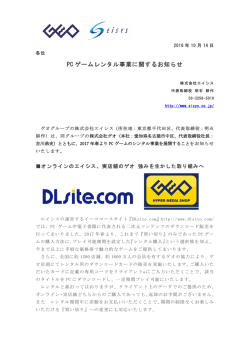
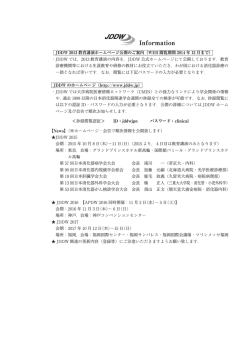
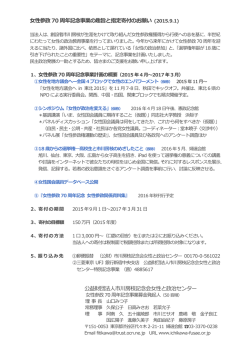
2016年3月期
業績説明会資料
Financial Factbook
Fiscal Year Ended March 31, 2016
本資料における予想数値は現時点での予測に基づいており、実際の業績はこれら予想と異なる結果となる場合があり得ます。
目次
Index
財務データ
Financial Section
・ 新設住宅着工戸数の推移
Numbers of New Housing Starts in Japan
・・・・・・・・・・・・・・・・・・・・・・・・・・・・・・・・・・・・・
3
・ 業績の推移
Business Results
・・・・・・・・・・・・・・・・・・・・・・・・・・・・・・・・・・・・・
4
・ セグメント業績の推移
Business Results by Segment ・・・・・・・・・・・・・・・・・・・・・・・・・・・・・・・・・・・・・
5
・ 経営指標
Financial Analysis
・・・・・・・・・・・・・・・・・・・・・・・・・・・・・・・・・・・・・
6
・ 連結貸借対照表
Consolidated Balance Sheets
・・・・・・・・・・・・・・・・・・・・・・・・・・・・・・・・・・・・・
7
・ 連結損益計算書
Consolidated Statements of Income
・・・・・・・・・・・・・・・・・・・・・・・・・・・・・・・・・・・・・
9
・ 連結キャッシュ・フロー計算書
Consolidated Statements of Cash Flows
・・・・・・・・・・・・・・・・・・・・・・・・・・・・・・・・・・・・・
10
・ 設備投資
Capital Expenditures
・・・・・・・・・・・・・・・・・・・・・・・・・・・・・・・・・・・・・
11
・ 受注の状況
The State of Orders
・・・・・・・・・・・・・・・・・・・・・・・・・・・・・・・・・・・・・
12
・ 販売の状況
The State of Sales
・・・・・・・・・・・・・・・・・・・・・・・・・・・・・・・・・・・・・
13
参考データ
Reference Data
・ 戸建注文住宅 1棟当たり平均データ
Average Data of Custom-built Detached House
・・・・・・・・・・・・・・・・・・・・・・・・・・・・・・・・・・・・・
15
・ 戸建注文住宅 参考指標
Reference Data of Custom-built Detached House
・・・・・・・・・・・・・・・・・・・・・・・・・・・・・・・・・・・・・
16
・ 戸建注文住宅 地域別受注棟数構成
Custom-built Detached House Orders by Region
・・・・・・・・・・・・・・・・・・・・・・・・・・・・・・・・・・・・・
17
・ 戸建注文住宅 階層別棟数構成
Ratio by the Number of Stories for Custom-built Detached Houses
・・・・・・・・・・・・・・・・・・・・・・・・・・・・・・・・・・・・・
18
・ リフォーム事業と不動産流通事業の状況
Renovation Business and Real Estate Brokerage
・・・・・・・・・・・・・・・・・・・・・・・・・・・・・・・・・・・・・
19
・ 木材・建材 商品別売上高(単体)
Timber and Building Materials Sales by Product Category (Non-Consolidated)
・・・・・・・・・・・・・・・・・・・・・・・・・・・・・・・・・・・・・
20
・ 木材・建材 市況
Market Data of Timber and Building Materials
・・・・・・・・・・・・・・・・・・・・・・・・・・・・・・・・・・・・・
21
・ 人員構成表
Number of Employees
・・・・・・・・・・・・・・・・・・・・・・・・・・・・・・・・・・・・・
22
・ 株式分布状況表
The State of Share Distribution
・・・・・・・・・・・・・・・・・・・・・・・・・・・・・・・・・・・・・
23
・ 退職給付に係る数理差異の推移
Actuarial Difference Regarding Employees' Retirement Benefit Obligation
・・・・・・・・・・・・・・・・・・・・・・・・・・・・・・・・・・・・・
24
-1-
財務データ
Financial Section
-2-
新設住宅着工戸数の推移
Numbers of New Housing Starts in Japan
(戸・Units)
Fiscal Years Ended March 31
2008/3期
持家
Owner-occupied Houses
分譲住宅
Built for Sale Houses
貸家
Rented Houses
給与住宅
Corporate Houses
合計
Total
国内における当社の戸建注文住宅販売棟数
Number of Custom-built Detached Houses Constructed by Sumitomo Forestry in Japan
持家着工戸数に対する当社戸建注文住宅の販売棟数シェア
Market Share of Our Constructed Custom-built Detached Houses in Owner-occupied Houses 2009/3期
2010/3期
2011/3期
2012/3期
2013/3期
2014/3期
2015/3期
2016/3期
2017/3期予想
Forecast
311,800
310,670
286,993
308,517
304,822
316,532
352,841
278,221
284,441
300,000
282,632
272,607
163,590
212,083
239,086
249,660
259,148
236,042
246,586
245,000
430,855
444,848
311,463
291,840
289,762
320,891
369,993
358,340
383,678
380,000
10,311
11,089
13,231
6,580
7,576
5,919
5,272
7,867
5,832
5,000
1,035,598
1,039,214
775,277
819,020
841,246
893,002
987,254
880,470
920,537
930,000
9,408
9,297
8,580
8,721
9,007
8,999
9,243
8,743
7,962
8,100
3.02%
2.99%
2.99%
2.83%
2.95%
2.84%
2.62%
3.14%
2.80%
2.70%
戸 Units
棟
1,200,000
15,000
1,000,000
12,500
800,000
10,000
600,000
7,500
給与住宅
貸家
分譲住宅
持家
400,000
5,000
200,000
2,500
0
0
2008/3期
2009/3期
2010/3期
2011/3期
2012/3期
2013/3期
-3-
2014/3期
2015/3期
2016/3期
2017/3期予想
国内における
当社の戸建注
文住宅販売棟
数
業績の推移
Business Results
(連結 Consolidated)
Fiscal Years Ended/Ending
March 31
(百万円・\Million)
(百万円・\Million)
2017/3期 予想
2012/3期
2013/3期
2014/3期
2015/3期
2016/3期
Forecast
1,250,000
売上高
831,870
845,184
972,968
997,256
1,040,524
1,150,000
19,191
25,330
33,415
33,994
30,093
46,000
Net Sales
営業利益
(左目盛)
(右目盛)
(右目盛)
売上高
経常利益
親会社株主に帰属する当期純利益
50,000
1,000,000
40,000
750,000
30,000
500,000
20,000
250,000
10,000
Operating Income
経常利益
20,714
26,981
33,567
36,424
30,507
48,000
9,271
15,923
22,531
18,572
9,727
27,000
Recurring Income
親会社株主に帰属する当期純利益
Profit for the Year Attributable to Owners of the Parent
※連結損益計算書上の「当期純利益」を2016/3期より「親会社株主に帰属する当期純利益」として表示しております。
※Figures concerned with Net Income is indicated as "Profit for the Year Attributable to Owners of the Parent" from fiscal year 2016.
(単体 Non-Consolidated)
Fiscal Years Ended
March 31
売上高
Net Sales
営業利益
Operating Income
経常利益
Recurring Income
当期純利益
Net Income
(百万円・\Million)
2012/3期
2013/3期
2014/3期
2015/3期
2016/3期
680,189
682,432
756,497
714,583
707,796
13,713
19,311
23,231
18,922
11,107
17,383
23,047
26,752
24,640
20,586
9,791
14,625
16,092
14,851
10,233
-4-
0
0
2012/3期 2013/3期 2014/3期 2015/3期 2016/3期 2017/3期
予想
セグメント業績の推移
Business Results by Segment (売上高 Sales by Segment)
Fiscal Years Ended/Ending March 31
(百万円・\Million)
2012/3期
木材建材事業
2013/3期
2016/3期
Forecast
401,266
458,611
423,020
426,965
448,000
415,098
430,774
465,368
453,940
454,604
481,000
34,971
38,657
76,320
147,024
187,926
258,000
14,049
15,406
17,286
16,565
16,874
23,500
△37,599
△40,919
△44,617
△43,293
△45,844
△60,500
831,870
845,184
972,968
997,256
1,040,524
1,150,000
住宅事業
Housing Business
海外事業
Overseas Business
その他事業
Others
調整
2015/3期
405,350
Timber & Building Materials
Adjustment
2014/3期
2017/3期 予想
合計
Total
(経常利益 Recurring Income by Segment)
Fiscal Years Ended/Ending March 31
2012/3期
2013/3期
木材建材事業
4,039
3,352
4,500
25,800
26,227
32,211
28,302
31,512
32,000
△2,938
△1,840
△149
6,126
13,091
15,500
728
754
821
1,175
△1,022
1,000
△7,655
△2,863
△4,268
△3,219
△16,427
△5,000
20,714
26,981
33,567
36,424
30,507
48,000
その他事業
Others
調整
Forecast
4,950
住宅事業
Adjustment
2017/3期 予想
2016/3期
4,704
Housing Business
海外事業
2015/3期
4,781
Timber & Building Materials
Overseas Business
2014/3期
合計
Total
(経常利益率 Recurring Income Margin by Segment)
Fiscal Years Ended/Ending March 31
木材建材事業
Timber & Building Materials
住宅事業
Housing Business
海外事業
Overseas Business
その他事業
Others
調整
Adjustment
合計
Total
2012/3期
2013/3期
2014/3期
2015/3期
2017/3期 予想
2016/3期
Forecast
1.2%
1.2%
1.1%
1.0%
0.8%
1.0%
6.2%
6.1%
6.9%
6.2%
6.9%
6.7%
△8.4%
△4.8%
△0.2%
4.2%
7.0%
6.0%
5.2%
4.9%
4.8%
7.1%
△6.1%
4.3%
-
-
-
-
-
-
2.5%
3.2%
3.4%
3.7%
2.9%
4.2%
-5-
経営指標
Financial Analysis
(経営指標 Financial Analysis )
Fiscal Years Ended/Ending March 31
2012/3期
2013/3期
2014/3期
2015/3期
2016/3期
2017/3期 予想
Forecast
自己資本当期純利益率
5.6%
8.8%
11.0%
8.0%
4.0%
10.8%
Return on Equity
(右目盛)
(左目盛)
自己資本比率
自己資本当期純利益率
12.0%
55.0%
10.0%
8.0%
40.0%
6.0%
使用資本利益率
5.6%
7.2%
7.9%
7.9%
6.4%
9.6%
Return on Capital Employed
4.0%
25.0%
2.0%
自己資本比率
33.6%
35.1%
33.9%
36.9%
34.3%
33.1%
0.0%
10.0%
2012/3期 2013/3期 2014/3期 2015/3期 2016/3期 2017/3期
予想
Equity ratio
(一株当たり情報 Per Share Data )
Fiscal Years Ended/Ending March 31
2012/3期
2013/3期
2014/3期
2015/3期
2016/3期
2017/3期 予想
Forecast
一株当たり当期純利益(円)
52.34
89.89
127.20
104.85
54.92
954.81
1,086.68
1,234.53
1,387.39
1,374.47
Shareholders' Equity per Share (\)
一株当たり純資産(円)
一株当たり当期純利益(円)
200
2,000
160
1,600
120
1,200
152.43
Earnings per Share Attributable to Owners of the Parent (\)
一株当たり純資産(円)
(右目盛)
(左目盛)
1,453.41
80
800
40
400
0
0
2012/3期 2013/3期 2014/3期 2015/3期 2016/3期 2017/3期
予想
-6-
連結貸借対照表
Consolidated Balance Sheets
(資産の部 Total Assets)
(百万円・\Million)
Fiscal Years Ended March 31
2012/3期
現金及び預金
Cash and Deposits
受取手形及び売掛金
Notes and Accounts Receivable-Trade
完成工事未収入金
Accounts Receivable-Contract
有価証券
2013/3期
2014/3期
2015/3期
2016/3期
64,870
56,155
75,694
81,756
83,499
120,536
121,053
128,580
118,156
121,415
4,347
4,880
4,341
6,059
5,723
Marketable Securities
15,000
11,000
43,000
26,000
34,000
商品・製品等
Finished Goods, Logs and Lumber, Boards, Others
20,977
22,276
26,922
26,559
26,105
未成工事支出金
Construction Projects in Progress
28,397
27,057
24,433
22,863
23,906
販売用不動産
Real Estate for Sale
34,880
27,894
31,514
39,232
43,239
仕掛販売用不動産
Real Estate for Sale in Process
-
-
11,132
37,063
56,371
繰延税金資産
Deferred Tax Assets
7,971
8,077
8,754
7,590
7,377
短期貸付金
Short-term Loans Receivable
4,759
36,852
33,397
32,571
31,709
未収入金
Other Receivables
43,471
47,935
54,254
44,619
46,963
その他
Others
5,052
5,589
5,559
8,752
12,004
貸倒引当金
Allowance for Doubtful Accounts
△1,329
△1,291
△724
△998
△842
Current Assets
348,930
367,478
446,855
450,220
491,469
85,641
85,900
103,733
109,046
108,700
8,390
9,157
11,692
16,286
18,078
60,534
85,439
82,917
89,986
90,942
流動資産
有形固定資産
Tangible Fixed Assets
無形固定資産
Intangible Fixed Assets
投資その他の資産
Investments and Other Assets
固定資産
Non-Current Assets
154,566
180,495
198,342
215,318
217,719
資産合計
Total Assets
503,496
547,973
645,197
665,538
709,188
※2014/3期より未成工事支出金のうち、販売用不動産に係るものを「仕掛販売用不動産」として表示しております。
※Figures concerned with Real Estate for Sale among Construction Projects in Progress are indicated as "Real Estate for Sale in Process" from fiscal year 2014.
-7-
連結貸借対照表
Consolidated Balance Sheets
(負債、及び純資産の部 Total Liabilities and Total Net Assets)
Fiscal Years Ended March 31
支払手形及び買掛金
工事未払金
短期借入金
1年内償還予定の社債
未払法人税等
未成工事受入金
賞与引当金
完成工事補償引当金
その他
流動負債
社債
新株予約権付社債
長期借入金
繰延税金負債
退職給付に係る負債
その他
固定負債
負債合計
資本金
資本剰余金
利益剰余金
自己株式
株主資本合計
その他有価証券評価差額金
繰延ヘッジ損益
為替換算調整勘定
退職給付に係る調整累計額
その他の包括利益累計額
新株予約権
非支配株主持分
純資産合計
負債及び純資産合計
(百万円・\Million)
2012/3期
98,076
57,349
20,761
5,749
38,567
9,026
1,843
23,050
254,421
15,000
28,284
7,316
10,033
19,106
79,740
334,161
27,672
26,872
114,223
△268
168,499
5,734
192
△5,291
634
202
169,335
503,496
Notes and Accounts Payable-Trade
Accounts Payable-Contract
Short-term Debt (Bank Loans)
Short-term Debt (Bonds)
Accrued Income Taxes
Advances Received from Customers
Provision for Bonuses
Warranty Reserve for Completed Construction
Others
Current Liabilities
Bonds Issued
Bonds with Subscription Rights to Shares
Long-term Debt (Bank Loans)
Deferred Tax Liabilities
Liability for Retirement Benefits
Others
Long-term Liabilities
Total Liabilities
Common Stock
Capital Surplus
Retained Earnings
Treasury Stock
Total Shareholders' Equity
Unrealized Gain on Available-for-Sale Securities
Deferred Gains or Losses on Hedges
Translation Adjustments
Retirement Benefits Liability Adjustments
Accumulated Other Comprehensive Income
Subscription Rights to Shares
Non - controlling Interests
Total Net Assets
Total Liabilities and Total Net Assets
※退職給付引当金は2014/3期より「退職給付に係る負債」として表示しております。
※少数株主持分は2016/3期より「非支配株主持分」として表示しております。
*Provision for Retirement Benefits for Employees is indicated as “Liability for Retirement Benefits” from the fiscal year 2014.
*Minority Interests is indicated as “Non - controlling Interests” from the fiscal year 2016.
-8-
2013/3期
104,655
64,968
25,995
5,589
42,345
9,502
1,711
21,377
276,143
15,000
24,189
10,198
9,720
19,473
78,580
354,723
27,672
26,872
127,489
△269
181,763
12,132
249
△1,654
10,727
760
193,250
547,973
2014/3期
115,294
76,136
26,434
10,000
8,102
55,120
10,480
2,035
22,529
326,130
5,000
20,000
26,616
10,807
11,038
19,529
92,989
419,120
27,672
26,872
146,654
△272
200,925
14,559
21
3,284
△112
17,751
7,401
226,078
645,197
2015/3期
102,951
64,612
31,340
4,617
46,791
10,001
2,275
29,523
292,110
5,000
20,000
41,214
12,244
13,066
21,123
112,646
404,756
27,672
26,872
161,286
△275
215,555
22,342
△124
8,101
△124
30,195
15,032
260,782
665,538
2016/3期
107,651
68,793
27,586
5,000
7,572
48,627
11,003
2,770
34,251
313,254
20,000
62,115
5,022
23,718
20,952
131,807
445,061
27,672
26,872
166,762
△278
221,028
16,270
△58
6,497
△276
22,432
36
20,631
264,127
709,188
連結損益計算書
Consolidated Statements of Income
Fiscal Years Ended/Ending March 31
2012/3期
売上高
831,870
Net Sales
売上総利益
利益率
16.5%
Gross Profit
販売費及び一般管理費
利益率
2.3%
Operating Income
営業外収益
Other Income
営業外費用
Other Expenses
営業外損益
Other Income/Expenses
経常利益
利益率
2.5%
Recurring Income
特別利益
Special Gains
特別損失
Special Losses
特別損益
Special Gains/Losses
親会社株主に帰属する当期純利益
利益率
136,873
1.1%
19,191
2014/3期
845,184
16.7%
117,682
Selling, General and Administrative Expenses
営業利益
2013/3期
141,436
972,968
16.5%
116,105
3.0%
25,330
2015/3期
160,162
126,747
3.4%
33,415
2016/3期
997,256
17.0%
169,492
33,994
Forecast
1,040,524
17.6%
135,498
3.4%
(百万円・\Million)
2017/3期 予想
183,134
1,150,000
17.8%
153,041
2.9%
30,093
205,000
159,000
4.0%
46,000
4,219
4,269
3,536
5,005
5,088
7,000
2,695
2,618
3,384
2,575
4,674
5,000
1,524
1,651
152
2,430
414
2,000
20,714
3.2%
26,981
3.4%
33,567
3.7%
36,424
2.9%
30,507
4.2%
48,000
455
137
2,254
531
1,441
-
3,487
971
1,192
2,217
5,704
-
△ 3,032
△ 833
1,063
9,271
1.9%
15,923
2.3%
22,531
△ 1,686
1.9%
Profit for the Year Attributable to Owners of the Parent
※連結損益計算書上の「当期純利益」を2016/3期より「親会社株主に帰属する当期純利益」として表示しております。
※Figures concerned with Net Income is indicated as "Profit for the Year Attributable to Owners of the Parent" from the fiscal year 2016.
-9-
18,572
△ 4,264
0.9%
9,727
2.3%
27,000
連結キャッシュ・フロー計算書
Consolidated Statements of Cash Flows
(百万円・\Million)
Fiscal Years Ended March 31
営業活動によるキャッシュ・フロー
2012/3期
Cash Flows from Operating Activities
2013/3期
2014/3期
2015/3期
2016/3期
26,873
45,910
54,057
14,709
45,705
有形固定資産の取得/売却
Tangible Fixed Assets
△7,875
△4,143
△9,025
△7,292
△16,235
無形固定資産の取得/売却
Intangible Fixed Assets
△2,782
△2,525
△2,912
△2,480
△1,997
投資有価証券の取得/売却
Investment Securities
△706
△961
△8,916
2,299
△9,557
その他
Others
△21,539
△21,034
10,376
△16,102
17,817
Cash Flows from Investment Activities
△32,903
△28,662
△10,476
△23,575
△9,972
3,280
△379
△3,074
△2,352
5,893
△4,498
△1,085
△3,129
1,390
4,750
投資活動によるキャッシュ・フロー
短期借入金純増減額
Short-term Debt
長期借入金純増減額
Long-term Debt
社債純増減額
Bonds
-
-
-
△ 10,000
-
新株予約権付社債純増減額
Bonds with Subscription Rights to Shares
-
-
20,000
-
-
配当金の支払額
Dividends Paid
△2,657
△2,657
△3,366
△3,366
△4,251
その他
Others
△1,747
△1,184
△1,921
△2,958
△4,578
財務活動によるキャッシュ・フロー
Cash Flows from Financing Activities
△5,622
△5,305
8,511
△17,286
1,813
現金及び現金同等物に係る換算差額
Effect of Exchange Rate Changes
△90
△124
593
1,105
423
現金及び現金同等物の増減額
Net Increase(Decrease) in Cash and Cash Equivalents
△11,742
11,819
52,685
△25,047
37,969
現金及び現金同等物の期首残高
Cash and Cash Equivalents at the Beginning of the Year
75,582
63,839
75,658
128,343
103,296
現金及び現金同等物の期末残高
Cash and Cash Equivalents at the End of the Year
63,839
75,658
128,343
103,296
141,265
-10-
設備投資
Capital Expenditures
(資本的支出 Capital Investment)
Fiscal Years Ended/Ending
March 31
有形固定資産
Tangible Fixed Assets
無形固定資産 ※
Intangible Fixed Assets
その他
Others
合計
Total
減価償却費
Depreciation
(百万円・\Million)
2012/3期
10,970
2013/3期
7,058
2014/3期
2015/3期
2016/3期
2017/3期 予想
Forecast
14,735
12,617
18,042
51,629
有形固定資産
無形固定資産 ※
その他
減価償却費
60,000
50,000
2,786
2,890
2,417
2,488
2,006
3,656
194
343
252
282
400
556
13,950
10,291
17,404
15,388
20,448
55,841
40,000
30,000
20,000
10,000
0
8,469
8,978
9,810
11,453
11,753
13,048
2012/3期
2013/3期
2014/3期
2015/3期
2016/3期
2017/3期
予想
(リース Finance Leases)
Fiscal Years Ended/Ending
March 31
展示場
Model Houses
その他
Others
合計
Total
2012/3期
1,534
2013/3期
2014/3期
2015/3期
2016/3期
2017/3期 予想
Forecast
1,580
2,411
2,331
788
展示場
その他
4,000
2,826
2,000
361
612
402
449
211
599
1,895
2,192
2,813
2,780
999
3,425
0
※ 資本的支出にはリースが含まれております。
Figures of Capital Investment include Finance Leases.
※ 無形固定資産には、ソフトウェアや借地権等が含まれております。
Intangible Fixed Assets include software and leasehold rights etc.
-11-
2012/3期
2013/3期
2014/3期
2015/3期
2016/3期 2017/3期 予
想
受注の状況
The State of Orders
<受注の推移 Change in Orders>
(百万円・\Million)
2017/3期 予想
Fiscal Years Ended/Ending March 31
2012/3期
2013/3期
2014/3期
2015/3期
2016/3期
Forecast
戸建注文住宅
金額
Custom-built Detached Houses
棟数・Unit
295,194
8,962
単価・Price per unit
賃貸住宅
金額
Apartment
戸数・Unit
その他請負
Other Contracts
314,240
9,105
339,909
9,364
290,203
7,804
297,490
7,730
310,800
8,200
29.3
30.6
32.1
33.2
34.1
33.4
11,169
13,043
15,502
21,790
22,967
25,500
986
1,138
1,140
1,486
1,523
1,750
単価・Price per unit
10.9
11.2
13.1
14.4
14.6
14.6
金額
585
911
2,562
1,435
4,371
4,500
※ 受注単価についてはこれまで、契約後に追加受注した付帯工事・外構工事等の金額も含めていましたが、2014年3月期より契約時点の金額に変更しております。
(過去の受注単価についても遡って変更しております。)
The order amount of detached houses has been changed to the contract amount since the fiscal year 2014,
from the amount including appurtenant work and exterior landscaping work after contracts.
(The change has been reflected in the figures above. )
-12-
販売の状況
The State of Sales
<販売の推移 (2012/3期~2013/3期)>
<販売の推移(2013/3期~2017/3期予想)>
(百万円・\Million)
Change in Sales(FY Ended March 31 2012~2013)
Fiscal Years Ended/Ending March 31
2012/3期
戸建注文住宅
金額
Custom-built Detached Houses
棟数・Unit
294,081
9,007
単価・Price per unit
賃貸住宅
金額
Apartment
戸数・Unit
2013/3期
300,936
8,999
32.7
33.4
7,899
9,371
772
858
単価・Price per unit
10.2
10.9
金額
585
340
戸建分譲住宅
金額
9,862
11,376
Spec Homes
棟数・Unit
その他請負
Other Contracts
単価・Price per unit
注文住宅用土地
Land for Custom-built Detached Houses
不動産開発 ※
Real Estate Development
その他
Others
北米住宅事業
豪州住宅事業
254
Fiscal Years Ended/Ending March 31
金額
Custom-built Detached Houses
棟数・Unit
賃貸住宅
金額
Apartment
戸数・Unit
8,999
2015/3期
320,260
9,243
2016/3期
313,396
8,743
2017/3期 予想
Forecast
299,837
7,962
307,000
8,100
33.4
34.6
35.8
37.7
37.9
9,371
13,130
13,569
20,514
23,500
858
1,124
1,014
1,324
1,620
単価・Price per unit
10.9
11.7
13.4
15.5
14.5
金額
273
1,375
2,791
2,091
4,700
戸建分譲住宅
金額
11,376
9,723
10,174
11,606
12,100
Spec Homes
棟数・Unit
その他請負
Other Contracts
金額
4,987
5,505
注文住宅用土地
金額
7,306
9,610
リノベーション事業 ※
金額
11,409
7,663
その他
83
229
1,689
1,820
棟数・Unit
2014/3期
300,936
単価・Price per unit
44.8
棟数・Unit
2013/3期
戸建注文住宅
43.8
Housing Business in USA
Housing Business in Australia
225
(百万円・\Million)
Change in Sales(FY Ended/Ending March 31 2013~2017 Forecast)
単価・Price per unit
Land for Custom-built Detached Houses
Existing Home Renovation
Others
北米住宅事業
242
303
320
40.2
37.4
38.3
37.8
金額
5,505
5,579
5,532
4,921
4,500
金額
6,750
8,999
5,685
4,756
4,500
金額
10,589
9,623
8,026
8,011
8,100
棟数・Unit
229
516
1,818
2,559
4,350
棟数・Unit
1,820
1,754
1,990
2,151
2,400
Housing Business in Australia
※ 「不動産開発」を2014/3期より「リノベーション事業」に変更したことに伴い、2013/3期の販売金額も同様に変更しております。
"Real Estate Development" is categorized as "Existing Home Renovation" from FY ended March 2014. The Sales of Real Estate Development in FY ended March 2013 are changed likewise.
-13-
272
44.8
Housing Business in USA
豪州住宅事業
254
参考データ
Reference Data
-14-
戸建注文住宅 1棟当たり平均データ Average Data of Custom-built Detached House
(受注ベース Contract Base)
Fiscal Years Ended/Ending March 31
2012/3期
単価(百万円)
Orders per Detached House (\ Million)
坪数(坪)
Floor Space in Tsubo(≒3.3㎡)
2013/3期
2014/3期
2015/3期
2016/3期
2017/3期 予想
Forecast
29.3
30.6
32.1
33.2
34.1
33.4
39.6
39.8
39.5
39.5
39.0
-
※ 受注単価についてはこれまで、契約後に追加受注した付帯工事・外構工事等の金額も含めていましたが、2014年3月期より契約時点の金額に変更しております。
(過去の受注単価についても遡って変更しております。)
The order amount of detached houses has been changed to the contract amount since the fiscal year 2014,
from the amount including supplementary work and exterior landscaping work after contracts.
(The change has been reflected in the figures above )
(完工ベース Delivered Base)
Fiscal Years Ended/Ending March 31
単価(百万円)
Sales per Detached House (\ Million)
坪数(坪)
Floor Space in Tsubo(≒3.3㎡)
2012/3期
2013/3期
2014/3期
2015/3期
2016/3期
2017/3期 予想
Forecast
32.7
33.4
34.6
35.8
37.7
37.9
40.6
40.6
40.7
40.3
40.5
-
※ 本体工事に加え、付帯工事、外構工事等の金額を含む完工単価を示しております。
Sales per detached house include the amount of house construction, appurtenant work and exterior landscaping work.
-15-
戸建注文住宅 参考指標
Reference Data of Custom-built Detached House
(受注ベース Contract Base)
Fiscal Years Ended/Ending March 31
2012/3期
新築比率
Percentage of New Building
建替比率
Percentage of Rebuilding
Fiscal Years Ended/Ending March 31
Construction Period per House (Days)
1坪当たり工期(日)
Construction Period per Tsubo(≒3.3㎡) (Days)
営業社員数
Number of Sales Staff
営業拠点数
Number of Sales Offices
展示場数
Number of Housing Display Centers
2014/3期
2015/3期
2017/3期 予想
2016/3期
Forecast
63.9%
62.9%
61.6%
62.8%
63.0%
-
36.1%
37.1%
38.4%
37.2%
37.0%
-
2012/3期
1棟当たり工期(日)
Fiscal Years Ended/Ending March 31
2013/3期
2013/3期
2014/3期
2015/3期
2017/3期 予想
2016/3期
Forecast
109
107
111
115
114
-
2.7
2.6
2.7
2.9
2.8
-
2012/3期
2013/3期
2014/3期
2015/3期
2017/3期 予想
2016/3期
Forecast
1,450
1,447
1,434
1,396
1,391
1,403
84
88
86
93
94
94
287
282
283
288
289
293
-16-
戸建注文住宅 地域別受注棟数構成
Custom-built Detached House Orders by Region
Fiscal Years Ended March 31
北海道・東北圏
2012/3期
8%
2013/3期
8%
2014/3期
9%
2015/3期
8%
2016/3期
100%
8%
Hokkaido and Tohoku Areas
75%
首都圏
31%
31%
31%
32%
33%
12%
11%
10%
9%
8%
Tokyo Metropolitan Area
関東圏
50%
Kanto Area
北海道・東北圏
東海・北陸圏
首都圏
18%
19%
19%
20%
21%
関東圏
Tokai and Hokuriku Areas
近畿圏
東海・北陸圏
25%
16%
15%
14%
13%
近畿圏
13%
Kinki Area
中四国・九州圏
中四国・九州圏
16%
16%
17%
17%
17%
Chugoku,Shikoku and Kyushu Areas
0%
2012/3期
-17-
2013/3期
2014/3期
2015/3期
2016/3期
戸建注文住宅 階層別棟数構成
Ratio by the Number of Stories for Custom-built Detached Houses
(受注ベース Contract Base)
階層別
Numer of Stories
※ Fiscal Years Ended March 31
2012/3期
平屋
House of one story
2階建
Two-story house
3階建以上
Three-story house
2013/3期
2014/3期
2015/3期
2016/3期
12%
13%
14%
16%
18%
84%
83%
82%
80%
78%
4%
4%
4%
4%
4%
(完工ベース Delivered Base)
階層別
Numer of Stories
平屋
House of one story
2階建
Two-story house
3階建以上
Three-story house
※ Fiscal Years Ended March 31
2012/3期
2013/3期
2014/3期
2015/3期
2016/3期
11%
12%
13%
14%
16%
84%
85%
83%
82%
80%
5%
3%
4%
4%
4%
-18-
リフォーム事業と不動産流通事業の状況
Renovation Business and Real Estate Brokerage
(住友林業ホームテック:リフォーム事業 Renovation Business)
Fiscal Years Ended/Ending
March 31
受注金額(百万円)
Price of Orders(\Million)
完工金額(百万円)
Price of Sales(\Million)
受注残(百万円)
Backlog of Orders Received at Term End (\Million)
2012/3期
47,792
45,278
2013/3期
53,818
50,312
2014/3期
2015/3期
61,004
55,887
59,336
56,656
2016/3期
63,604
61,724
2017/3期 予想
Forecast
71,600
69,300
75,000
150
60,000
120
45,000
90
30,000
60
15,000
30
受注金額(百万円)
17,922
21,428
23,096
22,327
24,207
26,507
0
営業拠点数
Number of Sales Offices
住友林業OB比率*
(受注金額ベース)
63
68
71
75
74
70
46%
46%
46%
48%
49%
47%
0
2012/3期 2013/3期
2014/3期
2015/3期
2016/3期
2017/3期
予想
(左目盛)
完工金額(百万円)
(左目盛)
営業拠点数
(右目盛)
* Percentage of orders received from owners of Sumitomo Forestry's house.( Amount base)
住友林業ホームテックの営業拠点数は、これまでメンテナンス事業の営業拠点を含んでおりましたが、2015年3月期第2四半期より
リフォーム事業の数値のみに変更しております。(過去の営業拠点数についても遡って変更しております。)
The number of sales offices of Sumitomo Forestry Home Tech has been changed to figures of Renovation Business since the interim of the fiscal year 2015,
from those including Maintainance Offices.
(住友林業ホームサービス:不動産仲介事業 Real Estate Brokerage)
Fiscal Years Ended/Ending
March 31
売買仲介件数(件)
Number of Brokerage (Sales)
営業拠点数
Number of Sales Offices
2012/3期
2013/3期
2014/3期
2015/3期
2016/3期
2017/3期 予想
6,000
80
Forecast
5,000
60
4,000
40
3,000
20
3,579
3,818
4,007
3,908
3,952
4,285
44
44
40
38
40
46
2,000
-19-
0
2012/3期
2013/3期
2014/3期
2015/3期
2016/3期
2017/3期
予想
売買仲介件数(件)
(左目盛)
(左目盛)
営業拠点数
(右目盛)
木材・建材 商品別売上高(単体)
Timber and Building Materials Sales by Product Category (Non-Consolidated)
(百万円・\Million)
Fiscal Years Ended March 31
木材
原木、チップ
Timber
Logs and chips
製材品
Lumber
2012/3期
国内
輸入
Logs-Domestic
国内
輸入
Lumber-Domestic
その他
建材
パネル
Building Materials
Board
一般建材
Building Materials
イノス
その他
Logs-Imported
Lumber-Imported
Others
国内
輸入
Board-Domestic
Board-Imported
木質加工建材 Wood Processed Construction Materials
Ceramic Construction Materials
窯業建材
Metal Construction Materials
金属建材
Housing Equipment
住宅機器
Others
その他
INOS Group
Others
2013/3期
2014/3期
2015/3期
2016/3期
4,325
9,893
14,218
23,570
33,910
57,480
71,698
20,598
43,581
64,180
45,094
60,944
25,511
44,550
3,907
180,006
3,751
22,930
270,866
4,318
9,160
13,478
23,944
31,395
55,339
68,817
20,278
39,645
59,923
45,081
62,944
23,657
44,413
3,962
180,057
3,103
23,941
267,023
4,512
10,613
15,125
27,494
39,542
67,036
82,161
24,099
52,481
76,579
49,240
71,177
23,837
48,870
4,588
197,712
3,910
25,812
304,013
5,142
8,859
14,001
24,908
35,934
60,842
74,843
21,297
49,740
71,038
44,010
64,968
20,817
45,258
4,368
179,421
2,676
25,614
278,748
5,961
4,910
10,872
25,966
37,918
63,884
74,756
21,374
47,551
68,925
43,324
63,292
22,984
44,798
4,272
178,669
2,432
29,293
279,320
342,564
335,840
386,174
353,591
354,076
木材・建材計
Total - Timber and Building Materials
-20-
木材・建材 市況
Market Data of Timber and Building Materials
(出典)農林水産省「木材価格統計表」ほか
From "Wood products prices statistics" by
Ministry of Agriculture, Forestry and Fisheries, and others.
(原木市況 Logs)
(円/㎥・\/㎥)
Fiscal Years Ended March 31
米まつ丸太
2012/3期
2013/3期
2014/3期
2016/3期
50,000
40,000
※
25,300
Douglas Fir
27,600
28,500
31,500
32,000
30,000
米まつ丸太※
ラワン丸太
Lauan
国産杉丸太(製材用/中目)※
Japanese Cedar
26,600
26,200
34,700
46,600
41,300
13,100
12,200
13,900
13,700
13,000
ラワン丸太
2012/3期
2013/3期
2014/3期
2015/3期
2016/3期
国産杉丸太(製材用/中目)
※
(円/㎥・\/㎥)
2012/3期
2013/3期
2014/3期
2015/3期
2016/3期
120,000
100,000
ひのき正角(国内材)※
Japanese Cypress, squares (Domestic)
82,000
82,700
100,700
87,500
82,900
54,900
63,900
68,900
70,700
70,000
※
Douglas Fir, slabs
ホワイトウッド(集成管柱)
20,000
10,000
(製材品市況 Lumber)
Fiscal Years Ended March 31
米まつ平角
2015/3期
80,000
ひのき正角(国内材)※
60,000
米まつ平角※
40,000
※
White Wood
60,500
69,500
78,600
(合板市況 Plywood)
Fiscal Years Ended March 31
78,600
2012/3期
78,600
2013/3期
2014/3期
2015/3期
2016/3期
ホワイトウッド(集成管柱)
※
(円/枚・\/Sheet)
2012/3期
2013/3期
2014/3期
2015/3期
2016/3期
1,500
1,200
ラワン合板(コンクリート型枠)
Hardwood
針葉樹合板
Softwood
920
1,050
1,270
1,320
1,340
970
870
1,020
820
910
900
ラワン合板(コンクリート型枠)
600
針葉樹合板
2012/3期
2013/3期
※ 農林水産省による価格算出方法が変更されたことに伴い、2013/3期以降の数値の算出方法は異なっております。
Since the fiscal year 2013, the calculation method of numerical value has been changed
due to the change of the price calculation method by the Ministry of Agriculture, Forestry, and Fisheries. -21-
2014/3期
2015/3期
2016/3期
人員構成表
Number of Employees
<旧セグメント(2011/3期~2012/3期) Previous segments (FY Ended March 31 2011~2012)>
Fiscal Years Ended March 31
2013/3期
2012/3期
構成比
木材建材事業
2016/3期
構成比
構成比
14.1%
-
-
-
-
-
-
-
-
4,540
30.8%
-
-
-
-
-
-
-
-
6,685
45.4%
-
-
-
-
-
-
-
-
854
5.8%
-
-
-
-
-
-
-
-
318
2.2%
-
-
-
-
-
-
-
-
267
1.8%
-
-
-
-
-
-
-
-
14,736
100.0%
-
-
-
-
-
-
-
-
海外事業
Overseas Business
住宅事業
Housing Business
不動産事業
Real Estate Business
その他事業
Other Businesses
調整(本社管理部門等)
Adjustment(Administrative Division etc)
Total
2015/3期
構成比
2,072
Timber & Building Materials Business
合計
2014/3期
構成比
<現セグメント Current segments>
Fiscal Years Ended March 31
2013/3期
2012/3期
構成比
木材建材事業
Timber & Building Materials Business
住宅事業
Housing Business
海外事業
Overseas Business
その他事業
Other Businesses
調整(本社管理部門等)
Adjustment(Administrative Division etc)
合計
Total
2014/3期
構成比
2015/3期
構成比
2016/3期
構成比
構成比
2,114
14.3%
2,168
14.6%
2,113
12.1%
2,052
11.3%
1,709
10.1%
7,372
50.0%
7,464
50.1%
7,624
43.8%
7,816
43.1%
7,905
46.5%
4,498
30.5%
4,502
30.2%
6,838
39.3%
7,402
40.8%
6,289
37.0%
495
3.4%
510
3.4%
550
3.2%
571
3.1%
781
4.6%
257
1.7%
246
1.7%
288
1.7%
296
1.6%
317
1.9%
14,736
100.0%
14,890
100.0%
17,413
100.0%
18,137
100.0%
17,001
100.0%
-22-
株式分布状況表
The State of Share Distribution
Fiscal Years Ended March 31
2013/3期
2012/3期
構成比
金融機関
Financial Institutions
その他法人
Other Companies
外国人
Foreigners
個人その他
Individuals and Others
その他
Others
合計
Total
2014/3期
構成比
(千株・Thousand Shares)
2016/3期
2015/3期
構成比
構成比
構成比
59,359
33.48%
58,866
33.20%
58,483
32.99%
61,920
34.92%
66,131
37.30%
43,098
24.31%
40,289
22.73%
41,575
23.45%
41,673
23.50%
41,352
23.32%
46,369
26.15%
48,141
27.15%
49,716
28.04%
47,997
27.07%
46,068
25.98%
27,489
15.51%
29,063
16.39%
26,135
14.74%
23,941
13.50%
21,845
12.32%
969
0.55%
929
0.52%
1,385
0.78%
1,769
1.00%
1,909
1.08%
177,285
100.00%
177,288
100.00%
177,295
100.00%
177,300
100.00%
177,304
100.00%
100%
80%
60%
40%
金融機関
その他法人
20%
外国人
個人・その他
0%
2012/3期
2013/3期
2014/3期
-23-
2015/3期
2016/3期
その他
退職給付に係る数理差異の推移
Actuarial Difference Regarding Employees' Retirement Benefit Obligation
(推移 Change)
Fiscal Years Ended March 31
退職給付に係る数理差異
Actuarial Difference Regarding Employees'
Retirement Benefit Obligation
(百万円・\Million)
2012/3期
2013/3期
2014/3期
2015/3期
2016/3期
(百万円)
50,000
45,000
40,000
35,000
△4,916
352
△1,020
△257
△11,531
30,000
連結経常利益(数
理差異除く)
25,000
20,000
連結経常利益(数理差異除く)
Consolidated Recurring Income
(Excluding Actuarial Difference)
連結経常利益
Consolidated Recurring Income
25,631
26,630
34,586
36,681
42,038
15,000
10,000
連結経常利益
5,000
20,714
26,981
33,567
36,424
30,507
0
2012/3期 2013/3期 2014/3期 2015/3期 2016/3期
(出典)財務省統計データほか
From Statistical data by Ministry of Finance Japan and others
(参考データ Reference Data)
Fiscal Years Ended March 31
日経平均株価(円) ※1
The Nikkei Stock Average (yen) *1
20年国債 応募者利回り(%) ※2
Yield to Subscribers on Twenty-year JGB *2
2012/3期
10,084
1.80
2013/3期
12,398
1.62
2014/3期
14,828
1.53
2015/3期
2016/3期
19,207
1.20
16,759
0.43
25,000
2.50
20,000
2.00
15,000
1.50
10,000
1.00
5,000
0.50
0
※1 「日経平均株価」は3月最終営業日の日経平均株価。
*1 As of the last working day in March.
※2 「20年国債応募者利回り」は、各期3月度に発行された20年国債の応募者利回り。
*2 Twenty-year JGB issued in every March.
-24-
0.00
2012/3期 2013/3期 2014/3期 2015/3期 2016/3期
日経平均株
価(円) ※1
20年国債
応募者利
回り(%)
※2
© Copyright 2026 Paperzz