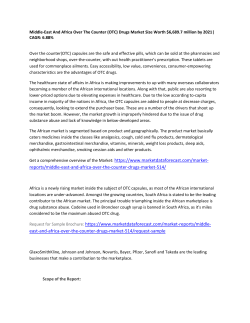
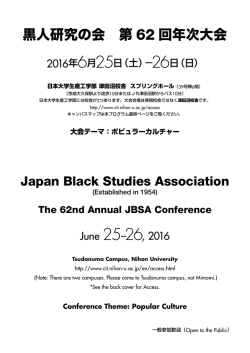
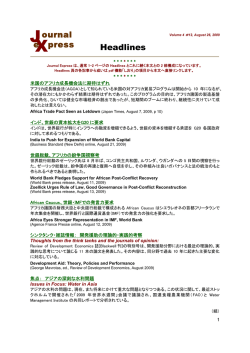
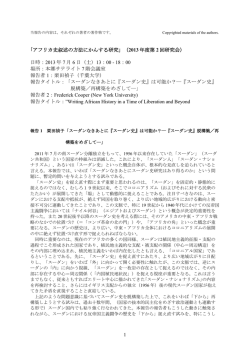
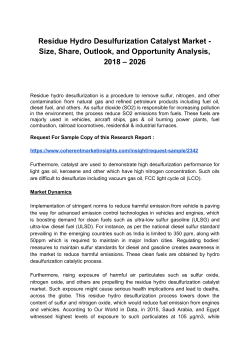
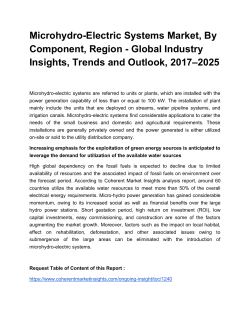
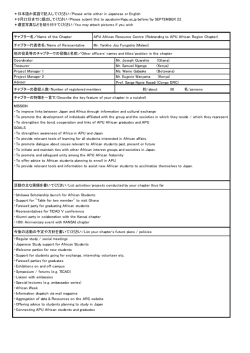
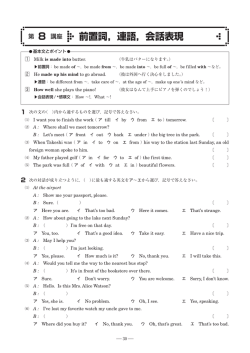
Overview of the SAPP and the Energy Network in Southern Africa www.sapp.co.zw By Eng. Musara Beta Chief Market Analyst SAPP Coordination Centre 1 Carbon Capture & Storage Workshop: Perspectives for the Southern Africa Region Holiday Inn, Sandton, Johannesburg, SOUTH AFRICA 31 May 2011 SOUTHERN AFRICAN POWER POOL CONTENTS 1. INTRODUCTION TO SAPP 2. SAPP DEMAND & SUPPLY BALANCE 3. SAPP GENERATION MIX 4. TRANSMISSION NETWORK DEVELOPMENT 5. DEMAND SIDE MANAGEMENT 6. SAPP COMPETITIVE MARKET 7. CONCLUSION 2 SOUTHERN AFRICAN POWER POOL 1. INTRODUCTION TO THE SAPP Geographic 12 Countries 230 Million people DR Congo Average Electricity growth rate 3% p.a. For South Africa demand growth was 4.9% in 2007 and for whole region 4.6%. Tanzania Angola Malawi Zambia Namibia Zimbabwe Botswana Mozambique Swaziland South Africa 3 Lesotho SOUTHERN AFRICAN POWER POOL Motivation to SAPP Formation Hydro Northern Network DRC Tanzania Malawi Angola Zambia Zimbabwe Namibia Botswana Mozambique Swaziland Thermal Southern Network 4 South Africa Lesotho SOUTHERN AFRICAN POWER POOL Membership No 1 2 3 4 5 6 7 8 9 10 11 12 13 14 Full Name of Utility Botswana Power Corporation Electricidade de Mocambique Electricity Supply Corporation of Malawi Empresa Nacional de Electricidade ESKOM Lesotho Electricity Corporation NAMPOWER Societe Nationale d’Electricite Swaziland Electricity Board Tanzania Electricity Supply Company Ltd ZESCO Limited Copperbelt Energy Corporation Lunsemfwa Hydro Power Company Zimbabwe Electricity Supply Authority OP = Operating Member ITC = Independent Transmission Company IPP = Independent Power Producer NP = Non-Operating Member Status OP OP NP NP OP OP OP OP OP NP OP ITC IPP OP Abbreviation BPC EDM ESCOM ENE Eskom LEC Nam Power SNEL SEB TANESCO ZESCO CEC LHPC ZESA Country Botswana Mozambique Malawi Angola South Africa Lesotho Namibia DRC Swaziland Tanzania Zambia Zambia Zambia Zimbabwe CEC and LHPC private companies admitted following SAPP reforms 5 SOUTHERN AFRICAN POWER POOL 2. DEMAND AND SUPPLY SITUATION No. Country 1 2 3 4 5 6 Angola Botswana DRC Lesotho Malawi Mozambique Utility ENE BPC SNEL LEC ESCOM EDM HCB 7 Namibia NamPower 8 South Africa Eskom 9 Swaziland SEC 10 Tanzania TANESCO 11 Zambia ZESCO 12 Zimbabwe ZESA TOTAL SAPP Total Interconnected SAPP 6 Installed Available Capacity Capacity [MW] As at [MW] Apr 2011 Apr 2011 Installed minus Available [MW] 2010 Peak Demand [MW] Capacity Required [MW] 10.2% Reserve Deficit (MW) 1,202 190 1,170 72 300 174 2,075 360 41,074 70 880 1,215 1,320 197 12 1,272 59 33 3,096 228 597 725 56,321 50,102 6,219 45,721 50,385 (283) 53,514 47,720 5,794 43,488 47,924 (204) 1,399 202 2,442 72 300 233 2,075 393 44,170 70 1108 1,812 2,045 1100 553 1,081 121 300 560 564 36,705 204 833 1,600 2,100 SOUTHERN AFRICAN POWER POOL MW SAPP Planned & Required Gen. Capacity 80000 70000 60000 50000 40000 30000 20000 10000 0 Planned Capacity vs Forecast , MW All SAPP Members 2010 2011 2012 GWh Forecast 450000 400000 350000 300000 250000 200000 150000 100000 50000 0 2014 2015 2016 Capacity Planned Energy Planned vs Forecast , GWh All SAPP Members 2016 Critical For Energy 2010 2011 2012 Energy Forecast 7 2013 2014 Critical For Capacity 2013 2014 2015 2016 Energy Planned (GWh) SOUTHERN AFRICAN POWER POOL 3. SAPP GENERATION MIX - Current Available Capacity - 2010 Angola - 2% DRC - 2.4% Mozambique - 4.5% South Africa - 82.5% 74.3% Coal 20.1% Hydro 8 4.0% Nuclear 1.6% Gas/Diesel Zambia - 2.4% Zimbabwe - 2.7% Rest - 3.5% SOUTHERN AFRICAN POWER POOL Medium Term Outlook Of the 28,462MW to be commissioned, approximately 80% will be coal and 12% hydro. Technology Coal % 22,786 80.1 Hydro 3,451 12.1 Gas 1,900 6.7 Diesel 160 0.6 Wind 165 0.6 28,462 100 TOTAL 9 MW SOUTHERN AFRICAN POWER POOL Planned New Generation The SAPP PLAN shows that 56,686 MW of new additional power generation capacity would be required by 2025 as follows: Technology Capacity [MW] Percentage [%] Coal 23,883 42% Hydro 18,045 32% Nuclear - 0% 2,164 4% Diesel 12,594 22% TOTAL 56,686 100% Gas The optimized plan includes no new nuclear. 10 SOUTHERN AFRICAN POWER POOL SAPP Future Generation Mix In 2025, a total of 102,871 MW of generation would be required in the SAPP as follows: Technology 11 Capacity [MW] Percentage [%] Coal 57,415 56% Hydro 27,016 26% Nuclear 1,800 2% Gas 2,732 3% Diesel 13,908 14% TOTAL 102,871 100% SOUTHERN AFRICAN POWER POOL 4. TRANSMISSION PROJECTS DRC 2013: ZIZABONA -220/330 kV Tanzania 2013: Mozambique Malawi 2014: Zambia - Tanzania - 400 kV Malawi Angola Zambia 2015:DRC - Angola – 400 kV Zimbabwe 2016: MOZAMBIQUE BACKBONE -RSA 2015: RSA Strengthening Namibia Mozambique Botswana Swaziland 2017: Namibia – Angola South Africa 12 Lesotho SOUTHERN AFRICAN POWER POOL 5. DEMAND SIDE MANAGEMENT 5,000.00 HWLC Demand Reduction [MW] 4,000.00 Commercial Lighting SWH CFLs 3,000.00 2,000.00 1,000.00 2009 2010 2011 2012 2013 2014 2015 Year 13 Four technologies were planned: i. Compact florescent lamps (CFLs) ii. Solar Water Heaters (SWH) iii. Hot Water Load Control (HWLC), and iv. Commercial Lighting In 2010, 750MW of savings were realised with CFL programme against a target of 1400 MW SOUTHERN AFRICAN POWER POOL 6. SAPP COMPETITIVE MARKET OVERVIEW SAPP DAM Market opened for live trading on 15 December 2009 Market performance highlights as of 31st April 2011 14 437,000 MWh Sale and 338,000 MWh Buy bids received 42,000 MWh was matched on the DAM trading platform However only 29,000 MWh was traded or approximately 1% market share The remainder could not be traded due to transmission constraints SOUTHERN AFRICAN POWER POOL Average Monthly Market Clearing Prices as of 31st Apr 2011 Average Market Clearing Prices (MCPs) USD/MWhr 50.00 40.00 30.00 20.00 10.00 15 Apr-11 Mar-11 Feb-11 Jan-11 Dec-10 Nov-10 Oct-10 Sep-10 Aug-10 Jul-10 Jun-10 May-10 Apr-10 Mar-10 Feb-10 Jan-10 Dec-09 - SOUTHERN AFRICAN POWER POOL 7. CONCLUSION SAPP is making efforts to reduce carbon emissions In the long-term, high cost coal will be displaced by cleaner energy sources such as hydro, wind and solar Coal % to be reduced from 74% to 56%. Hydro % to be increased from 20% to 26% Wind and solar % to be increased from 0% to approx. 0.5% SAPP has reformed in line with world wide trends in the electricity sector To date SAPP has introduced a competitive power market in the form of a Day Ahead Market Intends to introduce other markets incl. Carbon markets 16 SOUTHERN AFRICAN POWER POOL
© Copyright 2026 Paperzz