Journalof
Ecology1996,
84, 841-851
Nitrogenmineralization,
plantgrowthand goose
herbivory
in an Arcticcoastal ecosystem
DEBORAH
J. WILSON*
and ROBERT
L. JEFFERIES
Department
ofBotany,University
of Toronto,25 WillcocksStreet,Toronto,Ontario,Canada MSS 3B2
Summary
1 Lessersnowgeesefeedintensively
on graminoidvegetationinintertidal
saltmarshes
at La Perouse Bay, Manitoba. Relativelylittlegrazingoccursin more inland sites,
wherethesame vegetationpersistsbut tidalinundationsare infrequent.
At somesites
geesehave grubbedvegetationexposingsediments.
2 Feedingpreferences
of geesemaybe linkedto theavailabilityof nitrogenforplant
growthin the different
areas. Total soil nitrogen,exchangeableinorganicnitrogen,
netmineralization
of nitrogen,togetherwithsoil properties,
weremeasuredin interin
intertidalgrubbedsites.
tidal and inland sites (both grazed and ungrazed),and
of nitrogenwerecomparedwithaboveWhereapplicable,ratesof netmineralization
groundbiomassand withthenitrogencontentof shootsofgraminoidsin bothgrazed
and ungrazed(exclosed)swards.
3 All soils wereregosolicstaticcryosolswitha thinAh humushorizon.Most graminoid roots were confinedto the top 2 cm of soil, few penetrateddeeper than
5 cm. Bulk densityof soil 1-2cm below thesurfacewas 0.87 g cm3 and 0.53g
in theintertidal
respectively,
and inlandmarsh,and watercontentand salinityof soil
werehigherin theinlandmarsh.
4 Total nitrogenin soils (0-2 cm below the surface) in the inland marsh was
118g ? 6g N m-2comparedwith80 + 2 g N m2 in the intertidalmarsh.Total soil
nitrogen,exchangeableinorganicnitrogenand net mineralizationof soil nitrogen
weresignificantly
greaterbeneathintactswardscomparedwithgrubbedswardsin the
intertidal
marsh.
5 Seasonal netcumulativeamountofnitrogenmineralizedin theintertidal
marsh(86
days) in 1991 was 0.53 g N m-2at a soil depthof 1-2cm. The comparablevalue for
the inland marshwas 0.06 g N m2. In 1992 (54 days) the net amount of nitrogen
mineralizedin vegetatedintertidalsiteswas 0.18g N m-2 (1-2cm) and in grubbed
sitesit was 0.06 g N m2.
6 Cumulativeabove-groundbiomass of graminoidspecies in exclosed plots was
greaterin theintertidalmarshcomparedwiththatin theinlandmarsh.The amount
of nitrogen(as percentage)in above-groundbiomasswas also higherin plantsfrom
theintertidal
marsh.
in thequantityand qualityof vegetationare associatedwithvariation
7 Differences
in biogeochemicalcyclingin soils.Geese exploitpatchesofvegetationas theirprimary
sourceofforagewherenetabove-groundprimaryproductionis highand planttissues
are richin nitrogen.
habitatdestruction,
lessersnowgoose,
Keywords:
biogeochemicalcycling,graminoids,
salt-marshsoils
JournalofEcology(1996) 84, 841-851
c 1996British
Ecological Society
Correspondence:RobertL. Jefferies.
* Presentaddress:DepartmentofZoology,University
Blvd.,Vancouver,BritishColumbia,
ofBritishColumbia,6270 University
Canada V6T 1Z4.
842
Nitrogen
mineralization,
plantsand
herbivory
?
1996British
Ecological Society,
JournalofEcology,
84, 841-851
Introduction
in
herbivores
often
findnutrient-rich
forage
Northern
(Jefferies
et al.
earlysuccessional
plantassemblages
colonyof lesser
1994).One exampleis a breeding
L.) that
snowgeese(Ansercaerulescens
caerulescens
phryfeedon thegraminoid
vegetation
(Puccinellia
saltganodes
andCarexsubspathacea)
oftheintertidal
marshflatsat La PerouseBay on theHudsonBay
1986;
coast(Cargill& Jefferies
1984;Bazely& Jefferies
Hik et al. 1992).Observations
and countsof faecal
intensive
feeding
densities
indicate
thatafter
hatching
occursin frequently
inundatedintertidal
areas. In
little
occursinmoreinland
contrast,
relatively
grazing
areas at higherelevationsalongthe topographical
community
gradient,
where,although
thegraminoid
are infrequent.
Overfive
persists,
tidalinundations
m-2
successive
seasonstheseasonaltotalofdroppings
on theintertidal
doublethat
flatswasapproximately
on the moreinlandmarsh(Jefferies,
unpublished
data).
intheinterThegeesemayforage
moreintensively
ofgraminoid
tidalmarshbecauseoftheavailability
perhapsas a
forageof greaterqualityor quantity,
forplant
resultof an enhancedsupplyof nitrogen
interrestrial
ecosystems,
growth.
Primary
production
in general,
is oftenlimited
(Vitouseket
bynitrogen
(Pomeroy
al. 1989),as itmaybe inbothsaltmarshes
etal. 1992),
1970)andarcticecosystems
(Nadelhoffer
in particular.
of nitrogen
forplant
The availability
determined
growthis primarily
by therateof net
in soil(Vitousek
etal. 1989).
mineralization
nitrogen
The biogeochemical
of nitrogen
in soilsof
turnover
arcticand subarctic
has beenshownto vary
regions
et al.
along topographical
gradients(Nadelhoffer
1991;Giblinet al. 1991).Changesin soil nitrogen
forplantgrowth
availability
mayoccuras a resultof
differences
bothin soil conditions
and in ratesof
ofplantlitter(Coleyet al.
microbial
decomposition
1985;Pastor& Naiman1992).
ofthemidDuringthelasttwodecadesnumbers
continentpopulationof lessersnow geese have
increased
at a rateof - 7% perannum
dramatically
ofthese
etal. 1996).Theforaging
activities
(Abraham
ofsalt-marsh
swards
birdshaveledtothedestruction
at La PerouseBay and elsewhere,
and thedevelopofa positive,
mentofmudflats
as a result
degenerative
feedback
& Jefferies
1995a,b,1996).
(Srivastava
In thisstudy
wecompared
and
sitesintheintertidal
of
inlandmarshes
withrespect
to (1) theavailability
soilnitrogen
forplantgrowth
(as ratesofnetnitrogen
in thesediment),
of
mineralization
(2) thequantity
foragegraminoids
(biomassof the above-ground
qualityofforstanding
crop),and(3) thenutritional
age graminoids(as nitrogencontentof above-ground
biomass). Net rates of nitrogenmineralizationwere
also compared at both sites between sediments
beneathgrazed and ungrazed(exclosed) swards,in
order to determinewhethergrazing affectednet
mineralizationof soil nitrogenwithin a growing
season, and betweensoils beneathgrazed intertidal
swardsand grubbedsiteswheregeesehad previously
destroyedall vegetationby grubbing.
Methods
SITE
DESCRIPTION
Intertidaland estuarinemarshesoccur on the shores
ofLa Prouse Bay (58?04'N,94?03'W) on theHudson
Bay coast. Hudson Bay is undergoingisostaticuplift
at an estimatedrate of between0.4 and 1.2m per
century(Andrews1966, 1973). The shoregradientis
0.4 m km-l.The salinityof the inshoretidal water
is low (< 12g dissolvedsolids L-'). Much of thesaltmarshvegetationhas been destroyedby theforaging
activitiesof lessersnow geese and Canada geese and
the resultingexposed sedimentsmay become hypersalinein summerin the absence of tidal inundations
1995b,1996).
1988a,b;Srivastava& Jefferies
(Jefferies
The soils of the intertidaland adjacent inland
marshes,the lattercoveredby less than one tide per
year, are regosolic static cryosols (Canadian Soil
ClassificationSystem, AgricultureCanada 1987),
characterized
bya mineralhorizon(Cg) inwhichgleying occursin the activelayerthatis up to 25-30 cm
deepin summer.The thinsurfaceAh horizoninwhich
humusis present(0-3 cm below thesurface)becomes
veryshallowcloserto thecoast and is classifiedas an
organichorizon(> 17% carbonW/,)onlyintheinland
marsh. Where the vegetationhas been grubbedby
geese,soils lack a surfacemat of rootsand rhizomes.
MEASUREMENT
SALINITY
NITROGEN
OF BULK
DENSITY,
PH AND
OF SOILS
AND
TOTAL
CARBON
IN SOIL
AND
PLANT
SAMPLES
AND
On 23 August, 1991, we collectedfoursoil samples
(10 cm x 10cm x 7 cmdeep) fromeach ofthreestudy
marshand in theadjacentinland
sitesin theintertidal
marshboth of whichweredominatedby Puccinellia
and Carex subspathacea.In addition,on
phryganodes
5 August 1992,we took foursoil samplesfromboth
vegetatedand grubbedareas in each of threestudy
marsh.Samplesweretakenfrom
sitesin theintertidal
locations separatedby about 20 m and the distance
betweensiteswas at least 200 m.
We determinedthe bulk density(g drywt cm-3 of
freshsoil) of all soils at a depthof 1-2 cm: thiswas
the depth of soil used to determinenet rates of
mineralizationand was where the majorityof the
graminoidroots were located. Soils were dried at
50 ?C for7 daysbeforetheywereweighedon a Mettler
balance (model 160). We measuredthe pH of soils
taken froma depth of 0-2cm with a glass-calomel
electrode(50% deionized water to 50% soil v/w,
measurements
takenafter15 min).In 1991we used an
(model 3110,
atomic absorptionspectrophotometer
843
D.J. Wilson&R.L.
Jefferies
PerkinElmer,Norwalk,CT, USA) to determinethe
salinityofwaterextractedfromsoil at a similardepth
by means of the procedureof Srivastava& Jefferies
(1995a) (n = 3 per site,chosenat random).Detailed
soil salinitydata for grubbedand vegetatedareas
in the intertidalmarshin 1991 and 1992 have been
1995a,b,
reportedelsewhere(Srivastava & Jefferies
1996).For measurements
oftotalcarbonand nitrogen
in soils, samplesweretakenfromeach soil block at
intervalsof one centimetre
between0 and 2 cm below
the surfacein 1991, and between0 and 5 cm below
the surfacein 1992, dried and ground in a Wiley
mill(40 meshsize). We determined
total amountsof
carbon and nitrogen(% of soil drywt) witha CHN
analyser(Series600, LECO, St. JosephMI, USA).
MEASUREMENT
NITROGEN
? 1996 British
Ecological Society,
JournalofEcology,
84, 841-851
OF NET RATES
OF SOIL
MINERALIZATION
In 1991 we measurednet ratesof nitrogenmineralizationin both intertidaland inlandmarshes,in the
presenceand absence of goose grazing.Ten plots,
each 1m x 1m, wereestablishedin each of thethree
studysitesin both the intertidaland inlandmarshes
in areas whereintactswardsof salt-marshgraminoid
plants occurred. We placed chicken-wirefencing
aroundfiveplotschosenat randomfromeach group
of 10, in orderto exclude geese. In 1992,we establisheda further
six pairs of plots,each 1m x 1m, in
area.
vegetatedand grubbedportionsoftheintertidal
Grubbedplots had littleor no vegetation.The plots
in each pair wereless than 5 m apart,whereaspairs
of plotswerebetween20 m and 50 m apart.
We used the buried bag method (Eno 1960) to
determinenet rates of nitrogenmineralization.For
a soil core 7.5 cm in diameterand
each measurement
2.0 cm deep was removedfromjust underthesurface
layer (0-1 cm) and placed in a polyethylenebag
Onta('Glad', FirstBrandsCorporation,Orangeville,
rio,Canada), 25 ,um thick,thatwas perviousto oxygen (Gordon et al. 1987; Gordon 1988). We buried
thebaggedsoil back in thecavityfromwhichthecore
had been removed,replaced the surfacelayer and
sealed it along the contactzone withloose soil. In
1991 we buriedthreesequentialseriesof bags. The
bags wereplaced in randomlocationsin each plot on
5 and 6 June(two bags per plot), 7 and 8 July(one
bag) and 1 and 2 August(two bags). Whentwo bags
were buried per plot, the two were harvestedon
different
dates. We harvestedbags buriedon 5 and 6
Juneafter17-18 days (23 June)and 33-36 days (9
and 11 July).We harvestedbags buriedon 7 and 8
Julyafter20 days(29 July).We harvestedbags buried
on 1 and 2 Augustafter10 days (11 and 12 August)
and 29-30 days (31 August).In 1992,foursequential
seriesof bags wereburiedapproximatelyonce every
14 days (one bag per plot) (12 June,26 June,9 July,
22 July)and wereharvested14-15dayslater(27 June,
11 July,23 July,5 August,respectively).
At thetimes
soil cores wereburiedand collected,we took turves
(8 cm x 8 cm x 5 cm deep) fromeach plot to determine ambientamountsof exchangeableammonium
and nitrateions.
The followingextractionsor measurementswere
made on soil fromturvesor bagged soil within12h
of harvest.Threesoil samplesfrompreviouslyunexposed soil weretakenfromeach turfor bag of soil.
We extractedexchangeableammoniumand nitrate
ions fromone sample by placingit in 50mL of 1M
and filKCl, shakingthe resultingslurryfrequently
concentrations
teringit after4 h. We thendetermined
ofammoniumand nitrateionsin extractsbymeansof
the phenol-sodiumnitroprusside
method(Solarzano
1969) forammoniumions and Marshall'sreagentfor
nitrite
ions(Morris& Riley1963)followingreduction
of nitrateto nitriteby zinc powder.The second soil
samplewas driedfor7 days at 50?C to determineits
moisturecontent(g H20 g l drywtsoil),and theredox
by
potential(mV) ofthethirdsamplewas determined
meansof a platinumelectrodecalibratedwithZoBell's
solution(ZoBell 1946).
We estimatedratesof net nitrogenmineralization
betweeninitial(turfsamples)
based on thedifference
and final (bagged soil cores) concentrationsof
exchangeableammoniumor nitrateionsexpressedon
a daily basis (pg N g l dry wt soil day-'), or as a
cumulativetotal for the season (g N m-2). We calculated the latteras the sum of the daily geometric
mean rates,takingintoaccountsoil bulk densities(g
cm 3). Because artefactsof the buried-bagmethod
(Raison etal. 1987;Binkley& Hart 1989)have a large
effecton the formof mineralnitrogenthataccumulates in the bagged soil, the resultsare presentedas
ratesof totalnetmineralization
of soil nitrogen,and
are calculatedas thesum of netammonification
plus
netnitrification
rates.
INHIBITION
OF SOIL
NITRIFICATION
In estimating
netnitrogenmineralization
as described
above, we assumedthatthenitratethataccumulated
inburiedbags was producedbymicrobialnitrification
of ammoniumions. To confirmthatmicrobialnitrificationoccursin thesesoils,we used two watersoluble inhibitors,dicyandiamideand 3-amino-1,2,4
triazole(AldrichChemicals,Missouri,USA) to block
thenitrification
stepin samplesof pooled mixedsoil
(depth 1-2 cm) fromturveswithintactswardstaken
fromtheintertidal
marshin July1992.We mixed1Og
of soil and 10mL of deionized waterin a 250-mL
Nalgene bottleand added 1mL of ammoniumsulphatesolution(2 mgN mL-1).To each bottleeithera
2 mL of deionizedwater(controls,n = 12) or
further
2 mL ofa solutionofone oftheinhibitors
(50 ,ugmL-1)
were added (n = 6 for each treatment).The bottles
werecoveredin aluminiumfoiland incubatedat 25 ?C
for 14 days. Exchangeableammoniumand nitrate
ionswereextractedas describedabove,and theresults
844
Nitrogen
mineralization,
plantsand
herbivory
?) 1996British
Ecological Society,
JournalofEcology,
84, 841-851
expressedeitheras N (NO3) g- drywtofsoilproduced
duringincubationor as N (NH4) g-1drywt of soil
remaining.We comparedtwo independentvariables,
mean amountsof nitrateions and mean amountsof
ammoniumions, betweenthe controlsand the two
bymeansofDunnett'stest(Kirk
inhibitor
treatments,
(o) levelofeach test
1982;SAS 1990).The significance
was adjustedaccordingto the Bonferroniprocedure
describedlater(Statisticalprocedures).
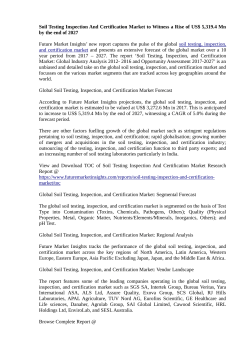
The effectsof the different
inhibitorson amounts
of ammoniumand nitrateions in thesoil incubation
bottles at the end of the experimentwere similar
lower amounts of
(Fig. 1). There were significantly
inhibinitrateinincubatedsoilto whicha nitrification
tor had been added than in the control bottles
= 138, d.f.= 21,
(Dunnett's T, critical difference
higheramounts
a = 0.025). There were significantly
of ammoniumremainingin soils that had received
inhibitors
comparedto controls(Dunnett'sT, critical
each marsh in 1992. We counted roots per shoot,
measuredtheirlengths,and classifiedthemas either
(brown,flacliving(white,turgid)or senescing/dead
cid).
STATISTICAL
PROCEDURES
the
We used a repeatedmeasuresANOVA to determine
of effectsof goose grubbing,exclosures,
significance
sitesand samplingdates on amountsof ammonium
and nitrateions in bulk soil and on netdailyratesof
thatoccurredin buriedbags.
nitrogenmineralization
Because amountsof ammoniumions and nitrateions
werenot independentwe applied Bonferroniadjustlevels(a) of statisticaltests
mentsto the significance
Type 1 errorless than
to keep the experiment-wise
0.05 (Day & Quinn 1989). We used a similarANOVA
of the effectsof
designto determinethe significance
treatmentson moisturelevels and redox potentials
difference= 27, d.f. = 21, a = 0.025). The results are
of samples collectedin 1992, and applied a similar
consistentwithour assumptionthatmicrobialnitrificationof ammoniumaccountedforthepresenceof
Bonferroniadjustment.Data of 1991 fromthethree
nitratein thesesoils.
studysiteswithineach marshweregrouped,as there
was insufficient
power to compare the two marshes
witha hierarchicaldesign.In analysingthedata from
ABOVE-GROUND
ROOT GROWTH
BIOMASS,
1992,sitewas treatedas a randomratherthana fixed
IN PLANT TISSUE
AND TOTAL NITROGEN
To increasestatisticalpowerin each analysisof
effect.
ofgrubbing,once we foundtheinteraction
theeffects
On each samplingdate in 1991we randomlyselected
term(site x grubbing,1 d.f.) not to be significant
two to fourturfsamples fromthose collectedfrom
each of the threesites in the intertidaland inland
(P > 0.20) it was pooled in the errorterm.We used
marshes.We clipped above-groundtissuesfroman
SAS software(SAS 1990) forall statisticalanalyses.
area (7 cm x 7 cm), and washed, dried (50 ?C for 7
We logarithmicallytransformedthe data of
amountsof ammoniumand nitrateions in bulk soils
days) and weighed them to obtain above-ground
biomass (g m-2). In 1994 and 1995 similarsamples
and of net mineralizationrates,in orderto achieve
and normality.Some distributions
thedryabove-ground
homoscedasticity
(n = 5) weretakento determine
but ANOVA
were stillslightlyskewedor leptokurtic,
standingcrop.Total amountsofcarbonand nitrogen
in driedsamplesweremeasuredas describedearlier.
tendsto be robustto suchdeparturesfromnormality
(Kirk 1982). We used the Huynh-Feldtadjusted FFour timesin thesummerof 1991and seventimesin
data did notmeetthecon1992,we collectedroots of Puccinelliaphryganodes. testwhenthetransformed
ditionof sphericity.
Resultsof multivariate
repeatedOn each samplingoccasion 20-30 plants were colmeasures ANOVAS that depend on less stringent
lectedfromeach marshin 1991,and 10 plantsfrom
assumptionswere consistentwiththe resultsof the
univariateanalysesgivenhere.
350 We used MANOVA to determinewhetherthenitrocontentsof soils at each depthsampleddiffered
gen
0
300
betweengrubbedand vegetatedpatches
significantly
Z 250in theintertidalmarshin 1992. We calculatedF sta200tisticsbased on Wilk's Lambda statistic(Tabachnick
& Fidell 1989). When multivariatetests were sig150
on each variunivariatetestswereperformed
nificant,
E 100
able at a reduced significancelevel (Tabachnick &
E 50Fidell 1989).
Where data were transformedlogarithmically
0
Control
Initial
levels
Dicyandiamide 3-amino-1,2,4-triazole (amountsof ammoniumand nitrate
ions in bulksoils
(hatchedbars) and
Fig.1 Mean amountsof ammonium
and net mineralization
rates),geometricmeans were
marsh
nitrate
(openbars)ionsin soilsfromtheintertidal
means
thearithmetic
calculatedbyback-transforming
and
sulphate,
before
withammonium
addedas ammonium
arithmeans
are
data.
All
other
of
the
transformed
(dicyandiamide
after
incubation
witha nitrification
inhibitor
one
text
as
+
and
are
expressed
in
the
metic
means
or withdeionized
water(control
or 3-amino-i1,2,4-triazole)
? 1 SE.
standarderror(SE).
Errorbarsrepresent
samples).
845
D.J. Wilson&R.L.
Jefferies
Results
SOIL CHARACTERISTICS
The bulk densities,pH and salinitiesof the soil
samples are shown in Table 1. The bulk densityof
soil 1-2 cm belowthesurfacewas muchgreaterin the
intertidalmarshthanin themoreorganicsoil of the
inland marsh.The bulk densitiesof soils fromvegetatedand grubbedsiteswerealmostidentical.There
in soil pH betweeninterdifference
was no significant
tidaland inlandsites.
Seasonal moisturecontentsand redox potentials
are shownin Table 2. No seasonal trendsin soil moisturecontentwereapparent.In 1991 the mean water
contentof the organic-richlayer in the soil of the
inlandmarshwas consistently
higherthatofthemore
marsh,exceeding2 g H20
mineralsoil oftheintertidal
g l dry wt of soil except in early Julyduringfine
was obviousand so a statisweather.(This difference
tical comparisonwas not used.) The watercontents
of the soils of vegetatedsitesin the intertidalmarsh
were similarin both years. In 1992, the mean soil
moisturecontentwas consistently
higherin soils of
ofsoilsamplescolpH andsalinities
Table 1 Bulkdensities,
lectedinAugustof1991and1992.Means+ 1 SE areshown,
exceptinthecaseofpH values,whererangesareshown
Bulk
density
ofsoils
(g cm-3)
1991
Inland
Intertidal
1992
Vegetated
Grubbed
pH of
soil
water
4.2 + 0.5
1.8+ 0.3
0.96+ 0.01
0.96+ 0.14
-
-
TOTAL
of
Salinity
soilwater
(g Na+L-')
0.53+ 0.09 6.5-7.4
0.87+ 0.03 6.9-7.4
vegetated sites than in soils of grubbed sites
= 51,P < 0.0001,
ox= 0.025). In 1991,therewas
(F1,32
betweentheredoxpotentials
no consistentdifference
of the soils of the inland marsh and those of the
intertidalmarsh; a statisticalcomparisonwas not
necessary.In 1992,thepatternofseasonalfluctuation
betweensoils of vegof theredoxpotentialsdiffered
etated and grubbed sites (F488= 3.29, P < 0.02,
oc= 0.025). The redox potentialsof soils of grubbed
sitestendedto be lowerthanthoseofsoilsofvegetated
sites,except in early August when the relationship
were not signifiwas reversed,but thesedifferences
cant.The salinityofsoilwateron 23 August1991was
greaterin the inland marshthan in the
significantly
intertidalmarsh(t16 = 4.4, P < 0.0004). The salinity
of soilsfromvegetatedsiteswas lowerthanthatfrom
bare soils in grubbedsitesin the intertidalmarshin
1995a, 1996).
1991 and 1992 (Srivastava& Jefferies
The sodium concentrationin soil water fromvegetated sitesincreasedfromI2.5 g Na+ L-l in midJune to a peak of 10-15g Na+ L- in mid-July,
whereasin bare,grubbedsitesthesoil salinityreached
By late August 1991
20 g Na+ L` in mid-summer.
soil salinitieshad declinedto theirinitialearlyseason
values,but in 1992 no declinehad been observedby
30 July,thelast samplingdate (Srivastava& Jefferies
1995a, 1996).
CARBON
AND
NITROGEN
IN SOILS
Amountsof totalsoil carbonand nitrogen,and C:N
ratios,in intertidaland inlandsitessampledin 1991,
and vegetatedand grubbedpatchesin the intertidal
sitessampledin 1992,are summarizedin Table 3. We
did not use statisticalteststo comparethe intertidal
and inland marshes sampled in 1991, because the
differences
were obvious. There were substantially
higheramountsof totalcarbon and nitrogenin soils
bothsummersof
Table 2 Mean + 1 SE seasonal moisturecontentsand redoxpotentialsof soil samplescollectedthroughout
1991and 1992
1992
1991
Date
? 1996British
Ecological Society,
JournalofEcology,
84, 841-851
Soil moisture(g H20 g soil-')
5/6June
23 June
9/11July
29 July
11/12August
31 August
Redox potentialof soils (mV)
5/6June
23 June
9/11July
29 July
11/12August
31 August
Inland
Intertidal
Date
Vegetated
Grubbed
0.03
0.03
0.03
0.02
0.02
2.20 +
2.19 +
1.22 +
2.01 +
2.06 +
2.67 +
0.16
0.15
0.08
0.14
0.15
0.19
0.91 +
0.85 +
0.68 +
0.86 +
0.95 +
0.96 +
0.05
0.02
0.02
0.05
0.02
0.03
12 June
26 June
9 July
22 July
5 August
0.91 +
0.83 +
0.88 +
0.77 +
0.88 +
0.03
0.03
0.03
0.03
0.02
0.72 +
0.72 +
0.70 +
0.64 +
0.65 +
145 +
90 +
205 +
50 +
195 +
190 +
10
20
05
40
05
15
125 +
175 +
195 +
80 +
110 +
215 +
20
10
05
15
25
05
12June
26June
9 July
22 July
5 August
190+
225 +
200 +
200 +
70 +
15
15
10
10
20
150 +25
200 + 20
140 + 15
160 + 25
120 + 15
846
Nitrogen
mineralization,
plantsand
herbivory
Table 3 Mean + 1 SE carbonand nitrogencontents,and C:N ratiosof soil samplescollectedin Augustof 1991and 1992
1991
depth0-1 cm
depth1-2 cm
Total N in soils (% of drywt)
Total C in soils (% of drywt)
C:N ratioin soils
Inland
Intertidal
Inland
Intertidal
Inland
Intertidal
1.49 + 0.17
1.51 + 0.21
0.51 + 0.03
0.41 + 0.02
21.0 + 1.9
22.3 + 2.3
10.9 + 0.4
10.8 + 0.2
14.6 + 0.6
15.8 + 0.9
22.4 + 0.8
26.8 + 0.7
Total N in soils (% of drywt)
1992
depth0-1 cm
depth1-2 cm
depth2-3 cm
depth3-4 cm
depth4-5 cm
Total C in soils (% of drywt)
Vegetated
Grubbed
Vegetated
Grubbed
Vegetated
0.43 +
0.36 +
0.38 +
0.33 +
0.31 +
0.35 +
0.29 +
0.28 +
0.26 +
0.28 +
10.8 +
10.2 +
10.2 +
9.7 +
9.6 +
9.9 +
9.3 +
9.3 +
9.1 +
9.2 +
25.8 +
28.7 +
28.2 +
30.4 +
30.8 +
0.02
0.01
0.03
0.02
0.01
0.03
0.02
0.01
0.03
0.02
of theinlandmarsh(0-2 cm below the surface)than
in the soils of the intertidalmarsh (Table 3). Soil
samples taken frombelow the Ah horizon in the
inlandmarshhad carbonand nitrogencontentssimilar to those fromthe intertidalmarsh(unpublished
data). The C:N ratio was lower in the soils of the
marsh
inlandmarshthanin thesoils of theintertidal
(Table 3). If changesin amountsof soil nitrogenand
in bulk densityto a depth of 2cm are taken into
account, the mean total amounts of nitrogenare
80 + 2 g N m2 in intertidalsitesand 118 + 6 g N m2
in inland sites (n = 12). In 1992, therewas a significantly
greateramountof totalnitrogenin soils of
vegetatedpatches than in soils of grubbedpatches
(MANOVA, F5,16= 3.5, P < 0.05). In univariatetests
thisdifference
was significant
onlyin soils from1 to
2cm and 2-3 cm (Fl 20> 10,P < 0.005,a = 0.01) but
in the top centimetre
of soil
approachedsignificance
also (Fl 20= 7.1, P < 0.015,oc= 0.01). The meanC:N
ratioat a depthof 1-2cm (thedepthof soil used for
mineralizationassays) was 28.7 + 0.6 in soils from
vegetated
patchesand 33.3 + 1.8in soilsfromgrubbed
patches.
0.3
0.1
0.2
0.2
0.1
a)
18 -
2
? 1996British
Ecological Society,
JournalofEcology,
84, 841-851
NITROGEN
IN BULK
SOILS
The amountsofexchangeableammoniumand nitrate
ions 1-2cmbelowthesurfaceofthesoilwereunaffected
by the presenceof exclosures(Fl 56 < 1.4, P > 0.2,
a = 0.025), hence data in 1991 from grazed and
exclosedplots have been combined(Fig. 2). In 1991
meanamountsofexchangeableammonium
geometric
varied seasonally betweenabout 5.6 and 9.0 /igN
(NH4) g- drywt of soil and 6.6 and 15.8ug N (NH4)
and inlandmarshes,
g-' drywt of soil in theintertidal
respectively,(Fl56 = 15.2, P < 0.0005, a = 0.025).
Mean amounts of exchangeable soil nitratewere
muchlower,varyingbetweentracelevelsand about
0.3
0.2
0.1
0.3
0.2
Grubbed
1.0
0.6
1.4
1.0
0.8
29.7 +
33.3 +
34.4 +
38.1 +
33.6 +
1.9
1.8
1.9
3.4
1.4
1991
16-
I,2
14
0)10
ii..
-
Z
_
2 -I
o
8June
b)
18 16-
-23June
9/11 July
29July
11/12August
31 August
1992
2 14 ' 12-
z
z
) 10
8
22 __SI
12 June
MINERAL
C:N ratioin soils
26 June
9 July
22 July
5 August
Fig.2 Amounts of ammoniumand nitrateions in bulk
(unbagged)soils duringthe summersof 1991 and 1992. (a)
Mean amountsof ammoniumions in soils fromthe inland
and intertidal(- -) marshes,and mean amounts
( .)
of nitrateions in soils fromtheinland(---) and intertidal
marshesin 1991. Data fromgrazed and exclosed
()
plotshave beencombined.The meanamountofnitrateions
in the inlandmarshon 12 Augustdoes not includethe 10
mostinlandplots.(b) Mean amountsof ammoniumions in
) patches,
soils fromvegetated(- -) and grubbed(.
and mean amountsof nitrateions in soils fromvegetated
marsh
(
) and grubbed(---) patchesin theintertidal
in 1992.The plottedpointsand errorbars weredetermined
meansand standarderrorscalculated
by back-transforming
data.
transformed
based on logarithmically
847
D.J. Wilson&R.L.
Jefferies
2.2 MgN (NO3) g- drywtofsoil (Fig. 2a), and tending
to increasein amountin late summer.In 1992,which
was a verycold summer(see later),mean amountsof
exchangeable ammonium ions in the soil were
between4.2 and 5.4jugN (NH4) g-1drywt of soil in
vegetatedplots,and in grubbedplotstheamountsfell
steadilyfrom4.1 Mgto 2.0 Mgg-1drywt of soil during
the season. Mean amounts of exchangeablenitrate
ions were again low in both grubbedand vegetated
sites,althoughamountsrosein grubbedsitesto 1.5Mg
N (NO3) g-1drywt of soil in late summer(Fig. 2b).
Amounts of both exchangeable ammonium and
exchangeablenitrateions in thesoil weresignificantly
affectedby the previous grubbingof surfacevegetation(Fl 32> 12.8,P < 0.0001,oc= 0.025).
a)
.E
z
0)
OF SOIL
NITROGEN
As therewas no significant
of exclosureson net
effect
rates of mineralization(Fl 56 = 0.2, P > 0.65), data
fromgrazed and exclosed plots in 1991 have been
pooled (Table 4; Fig. 3). Net nitrogenmineralization
ratesin 1991in theintertidal
marshexceededthosein
theinlandmarsh(F, 56= 16.0,P < 0.0001). The rates
varied significantly throughout the season
(F4,224= 18.4,P < 0.0001) and thepatternofseasonal
variationdiffered
betweenthe intertidaland inland
marshes (F4,224= 5.7, P < 0.001) (Table 4). In the
inland sites,mean net mineralizationrateswerelow
and comparativelysimilarthroughoutthe season,
whereasin the intertidalmarsh the rates rose substantiallyin mid-summer(7 July- 12 August). In
1991
0.6-
0
z
0.4-
c
0.2
E
5/6June
b)
08
23 June
29 July 11/12August31 August
7/8July
1992
c.E
z
NET MINERALIZATION
0.8 -
06
co
N
c-
0
04 -
z
c
0.2 -
12 June
2 June 9 July 23 July 5 August
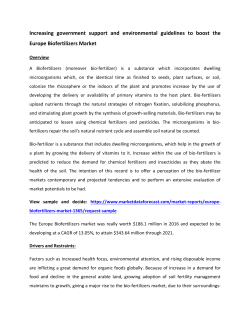
Fig.3 Cumulativeseasonal netnitrogenmineralization
(net
in soil 1-2 cm below
ammonification
plus netnitrification),
thesurface.(a) The intertidal
shadedarea) and inland
(lightly
(dark area) marshesin 1991. (b) Vegetated(lightlyshaded
area) and grubbed(dark area) sitesin the intertidalmarsh
in 1992,in g N m-2. Errorin thisFigureis an accumulation
of the errorsshownin Table 4, in additionto errorin the
estimatesof bulkdensityof thesoils.
Table4 Net ratesof nitrogenmineralization(net ammonification
plus net nitrification)
(,Ig N g-' day-') in buriedbags, in
soils of the inland and intertidalmarshesin 1991,and in soils of vegetatedand grubbedpatchesin the intertidalmarshin
1992. The values shownweredetermined
by back-transforming
means and means + 1 standarderror(SE), calculatedbased
on logarithmically
transformed
data
Net dailynitrogenmineralization
rates(,Ig N g-' day-')
Inland marsh
1991
5/6June- 23 June
23 June- 9/11July
7/8July- 29 July
1/2August- 11/12August
11/12August- 31 August
Intertidalmarsh
-1 SE
Mean
-0.07
-0.44
0.55
-0.16
-0.27
0.05
-0.23
0.72
0.01
-0.13
+1 SE
-1 SE
Mean
+1 SE
0.18
0.00
0.90
0.18
0.02
0.38
-0.08
2.20
0.64
-1.68
0.51
0.14
2.76
0.92
-1.12
0.64
0.38
3.37
1.21
-0.42
Grubbedsites
?
1996 British
Ecological Society,
JournalofEcology,
84, 841-851
1992
12 June- 27 June
26 June- 11 July
9 July- 23 July
22 July- 5 August
Vegetatedsites
-1 SE
Mean
+1 SE
-1 SE
-0.19
0.01
0.19
0.13
-0.12
0.05
0.30
0.22
-0.06
0.10
0.41
0.32
0.14
0.22
0.21
0.36
Mean
0.24
0.34
0.30
0.52
+1 SE
0.33
0.47
0.40
0.70
848
Nitrogen
mineralization,
plantsand
herbivory
1992,netnitrogenmineralization
rateswerehigherin
vegetatedthaningrubbedplots(F1,32= 8.0,P < 0.01)
(Table 4), particularly
earlyand late in theseason.
The cumulativeamountsof net nitrogenmineralizationthatoccurredeach summerunderthedifferent
treatments,estimated by summingthe geometric
mean net mineralizationrates measured in each
period,and expressedon a unitarea basis (g N m2),
are shown in Fig. 3. The seasonal net cumulative
amount of nitrogenmineralizedin the intertidal
marsh(86 days) in 1991 was 0.53 g N m-2 at a soil
depthof 1-2cm. The comparablevalue fortheinland
marshwas 0.06 g N m2. In 1992 (54 days) the net
invegetatedintertidal
amountofnitrogen
mineralized
siteswas 0.18 g N m-2 at a similarsoil depthand in
thegrubbedsitesit was 0.06 g N m2.
differ(t8, P < 0.05). In 1995therewas no significant
ence in the values (t8, P = 0.617) betweenthe two
marshesin late summer.The amountofnitrogenas a
percentageof thedryweightof above-groundtissues
in 1991was also higherin theintertidal
plots(ANOVA,
=
P
although
values
declined
17.28,
<
0.0005),
F1,35
as the summerprogressed.Root growthwas measured in 1992 in the inland and intertidalmarshes.
On 7 Junewhenthemeltwaters
had subsidedon the
intertidalflatsonly20% of the shoot systemsexamined had newlyemergingroots 0.1 cm in length.By
earlyJulyaverageroot lengthwas 3.3 + 0.6cm and
there were 2.7 + 0.4 roots on average per shoot
system.In theinlandmarsh,themean lengthof new
rootson 1 Julywas 1.3 + 0.2 cmwithan averageroot
numberof 1.6 + 0.2 new rootsper shootsystem.
PLANT
Discussion
BIOMASS
AND
PLANT
TISSUE
NITROGEN
Mean amountsof above-groundbiomass (g m-2) in
and inlandmarshesin
exclosedplotsin theintertidal
1991,1994and 1995are shownin Table 5. In all years
theinitialabove-groundstandingcrop of Puccinellia
phryganodesand Carex subspathaceaimmediately
aftersnow-meltwas lower in exclosed plots in the
intertidalmarshthan in similarplots in the inland
marsh(t8 or tio,P < 0.05), but by mid-summer
the
standingcropwas alreadysignificantly
higherin 1991
(t@o,P < 0.06) in theintertidalexclosedplots,and in
1994it was significantly
higherat theend of summer
Table5 Above-groundmixed standingcrop of Puccinellia
and Carexsubspathacea(g drywtm-2) in 1991,
phryganodes
1994,and 1995,and amountsof nitrogenas a percentageof
the dryweightof shoot tissuein 1991,in exclosuresin the
intertidalmarshand the inland marshat La PKrouseBay,
Manitoba. Values shownare means ? 1 SE
Above-groundstandingcrop (g m-2)
Inland marsh
1991
8 June
9 July
31 August
1994
5 June
1 August
1995
7 June
31 July
Intertidalmarsh
29.1 ? 4.1
66.1 ? 9.9
103.1 ? 13.6
18.1 ? 2.0
93.5 ? 8.5
39.3 ? 6.1
90.9 ? 14.2
7.6 ? 1.7
147.6 ? 23.6
36.5 ? 9.5
133.8 ? 26.2
18.9 ? 5.7
148.1 ? 28.8
-
Nitrogencontent(% of drywt)
Inland marsh
?
1996British
Ecological Society,
JournalofEcology,
84, 841-851
1991
8 June
9July
31lAugust
3.6 ? 0.2
2.4?0.1
1.6?t0.2
Intertidalmarsh
4.6 ? 0.2
2.7?0.2
2.2?t0.2
mineralization
and the
The insituratesofnetnitrogen
turnoverof soil nitrogen1-2cm beneaththe surface
differed
grazingsitesare
among sites.The preferred
those where soil mineralizationrates were highest.
ofthepresenceofgeese,
Theserateswereindependent
at least withinthe season. In 1991 in the intertidal
marshthenetamountof nitrogenmineralizedby 11
2.0% of the
August(Fig. 3a, peak value) represented
soil nitrogenpool (35.6 g N m-2) at thatdepth.The
comparablevalue in the adjacent inland marshwas
0.1% ofthetotalsoil nitrogen(65.9 g N m2). In 1992,
thenet amountof nitrogenmineralizedby 5 August
in theintertidalmarsh(Fig. 3b) was 0.5% of thesoil
nitrogenpool in vegetatedsites (34.1 g N m-2) and
0.2% ofthesoil nitrogenpool in grubbedsites(27.8 g
N m-2). Soil nitrogenturnoverwas therefore
fasterin
theintertidal
marshthanin theinlandmarshand was
also fasterin vegetatedplotsthanin grubbedplotsin
the intertidalmarsh.In the intertidalmarshthe soil
nitrogenpool 1-2cm belowthesurfacewas only54%
of thatin the adjacent inland marsh,in spiteof the
tenfoldhighernet rate of nitrogenmineralizationat
thesesitescomparedwiththosein theinlandmarsh.
The fractionof soil organic matterresponsiblefor
short-term
nitrogenmineralizationis poorly characterizedin soils (Paul 1984; Binkley& Hart 1989).
In the intertidalmarsh,it may containdead cyanobacterialbiomass,as the area wherethe plots were
located sustainslarge populations of diatoms and
1989).
cyanobacteriain spring(cf. Bazely & Jefferies
Aziz & Nedwell (1986) also have reportedan abundance of cyanobacteriain a lower intertidalsalt
marsh. In addition,thereis tidal depositionof silt
and organicmatterwhichis about 1-2mm per year
(Jefferies,
unpublisheddata). The compositionof the
however,is thesameat the
vascularplantcommunity,
marshes.
studysitesin boththeinlandand intertidal
The overall rates of mineralizationand the sizes
of the soil nitrogenpools at La Perouse Bay were
comparablewiththose reportedin otherstudiesof
of soil nitrogenin arcticand subarctic
mineralization
849
et al. 1991;
1989; Nadelhoffer
&
Gunther
soils
(Hart
D.J. Wilson&JR.L.
1992).
Therewas,
et
al.
al.
1991;
Nadelhoffer
Giblin
et
Jefferies
betweenyearsin thenet
difference
however,a striking
amountsof nitrogenmineralizedat La P6rouseBay,
even allowing for the shorterstudy period in the
secondyear.This was probablyrelatedto differences
in soil temperatureand soil moisture content.
and moisture
levels
Microbialresponsesto temperature
were likely responsiblealso for the within-season
in observedmineralizationrates.We do
differences
not have enough recordsof daily temperaturesor
dailysoil moisturelevelsat La P6rouseBay forboth
studyperiodsto analysefullytheassociationbetween
thesefactorsand netmineralizationrates.However,
the summerof 1991 was one of the warmestyears
since 1950,whereasthe summerof 1992 was one of
thecoldest.In Churchillaveragedailymaximumtemperaturesduring each incubation period in 1991
exceededthoseduringcomparableincubationperiods
in 1992,bymorethan5 ?C (ChurchillWeatherOffice
Canada). The highest
MonthlyReports,Environment
net mineralizationrate occurred in the intertidal
marshduringtheperiod7 Julyto 29 July1991. The
bags forthisincubationperiodwereburiedduringa
containedrelaperiodof fineweather,and therefore
tivelydrysoil; themean soil moisturecontentin the
intertidalmarshon 9 Julywas 0.68 + 0.02 g H20 g1
drysoil (Table 2). The redoxpotentialof the soils in
the intertidalmarshwas also relativelyhighat that
time,195 + 5 mV. The averagedailymaximumtemperatureduringthe period 7 Julyto 29 Julywas
18.9 + 1.4?C, which was not unusual for 1991,
althoughitconsiderablyexceededthehighestaverage
daily maximumtemperaturerecorded during any
incubationperiod in 1992 (15.3 + 0.4?C duringthe
et al. (1991)
period22 July- 5 August).Nadelhoffer
showed that rates of nitrogenmineralizationwere
between3 ?C and 9 ?C, but
insensitive
to temperatures
increasedby a factorof two or more between9?C
and 15?C.
was detected in all soils; the
Nitrate-nitrogen
amounts,although low, tended to increasein late
summer.Other investigatorshave detectednitrate
ions in mineralizationassays and as exchangeable
nitratein arcticsoils (Hart & Gunther1989; Nadelet al. 1991;Aitkinet al. 1993).Wheretheredox
hoffer
potential is below + 150mV in the sediments,
may
microbialnitraterespirationand denitrification
lead to a loss ofnitrogen(Fenchel& Blackburn1979).
in the upper layers
Measurementsof denitrification
of intertidalsedimentsindicate that some loss of
unpubnitrateis occurring(G. Blicher-Mathiesen,
lisheddata) whichmay,in part,accountforthe low
levelsof nitrateions in the bulk soil. In thegrubbed
plotsthemean redoxpotentialwas usually25-60 mV
? 1996 British
lower than that in vegetatedplots (although the
Ecological Society,
differenceswere not statisticallysignificant).The
of
Ecology,
Journal
meanvalue was wellabove 150mV on onlyone sam84, 841-851
pling occasion (26 June 1992). It is likelythat one
effect
ofthespringgrubbingand theremovalofplants
is the absence of oxygendiffusionfromlive roots
intothesediment(Armstrong1979).Hence,sediment
beneathgrubbedswardsmay be expectedto become
increasinglyanaerobic followingdestructionof the
sward.
oftidalinundationsand
Grubbing,a low frequency
highratesof soil evaporationin the partialor total
in
absenceofa vegetationalmat,lead to hypersalinity
theupperlayersof thesediment(lacobelli & Jefferies
1995a,b, 1996). Even
1991; Srivastava & Jefferies
conditionsmay
wheretheswardis intact,hypersaline
occurduringmuchof thesummerin theupperintertidal salt marsh,ifthereis highevaporativedemand
studies
et al. 1979). In recentexperimental
(Jefferies
led to reducednitriat La PerouseBay, hypersalinity
ficationin soils to whichammoniumions had been
unpublished
added (van der Wal, Chang & Jefferies,
data). Hence, low redoxpotentialsand hypersalinity
maybe expectedto reducenetratesof nitrification.
Above-groundbiomass of Puccinelliaphryganodes
and Carex subspathaceawas greaterin exclosedplots
in theintertidal
marshwas greateror equal to thatin
similarplotsin theinlandmarshin late Julyor early
August of each year (Table 5). Because the reverse
was truein Juneof each year,the net above-ground
production(NAPP) was greaterin exclosures
primary
in theintertidal
marshthanin exclosuresin theinland
marsh.In addition,thenitrogencontent,measuredas
a percentageof the dry weight of above-ground
tissues,was higher.The majorityof graminoidroots
were distributedin the upper 5cm of sediment.If
are
the observednetratesof nitrogenmineralization
extrapolatedto includethe top 5 cm of soil, theestimatedseasonal supplyof mineralnitrogenfromthis
sourceapproachesthedemandfornitrogenforplant
growthin the intertidalmarsh( 150g drywt m2;
-2.2% N; Table 5), at least in 1991. In contrast,
estimatedrates of nitrogenmineralizationin the
inland marsh fall far short of the requirementfor
plant growth( 100 g drywt m-2; 1 1.6% N; Table
5), implyingthatotherprocessesare involvedin supplyingnitrogenfor plant growth.Reabsorptionof
nitrogenfromsenescingleaves into the parentplant
maybe one sourceofnitrogenfornewleavesofthese
theseason.
graminoidsthatare producedthroughout
Each shoot systemof Puccinelliamay produce six
leaves or more duringthe growingseason and each
1989).
leaf has a limitedlifespan (Bazely & Jefferies
Nitrogentranslocationfromleaves of tundra graminoidplantsvariesbetween21% and 78% (Berendse
& Jonasson1992). The secondpossiblesourceis soluble nitrogenresuppliedto the soil via goose faeces
1985; Ruess etal. 1989). Addition
(Bazely & Jefferies
plotsat densities
offreshgoose faecesto experimental
marshled
comparableto thosefoundin theintertidal
to an increaseinthestandingcropofgraminoidplants
1985). The estimatedtotalcumu(Bazely & Jefferies
850
Nitrogen
mineralization,
plantsand
herbivory
lativeamountof nitrogenpresentin faecesdeposited
duringtheseasonin theintertidal
marshis about 1.0g
m2 (Ruess et al. 1989). Corresponding
values forthe
inlandmarshare at the mostno morethathalfthis
amount.Some of thenitrogenis eithervolatilizedor
is immobilizedbymicrobes,hencethisfractionwould
not be available forplantgrowth(Ruess et al. 1989).
The thirdadditionalsource of nitrogenmay be the
presenceof soluble organicnitrogenin the soil solution(Kielland 1994),butat presentwe have no informationon amountspresentat different
sites.Further
studiesare needed to establishamountsof available
nitrogenforplantgrowthfromeach of thesesources.
Similar patterns of herbivoryby Brent geese
(BrantaberniclaL.) along gradientsof primaryproductivityhave been reportedrecentlyfor the saltmarsheson theDutchislandofSchiermonnkoog
(van
de Koppel et al. 1996; Olffet al., unpublisheddata).
of the
The birdsforagedon vegetationcharacteristic
early successional stages where inputs of nitrogen
depositedas sedimentwere high.There was a good
correspondencebetween the distributionof goose
droppingsand threeof the principalfood sources
of the geese (Festuca rubra,Plantago maritimaand
Puccinelliamaritima).The nitrogencontentof these
plantsvariedbetween3.5% and 4.5%.
Resultsof thesestudiesshowtheassociationof the
quantityand quality of vegetationwithchanges in
biogeochemical cycling along a topographical
sequence.Geese exploitpatchesofvegetationas their
primarysource of foragewhere net above-ground
primaryproductionis highand planttissuesare rich
in nitrogen.
Acknowledgements
We wish to thankJennifer
Champion,Scott Finley,
Dr ChrisNeill,and thestaff
GitteBlicher-Mathiesen,
and studentsat the La Perouse Bay fieldstationfor
assistanceinthefieldand inthelaboratory.Dr Wesley
Hochachka gave usefulstatisticaladvice and commentedon an earlydraftofthepaper.Mrs. Catherine
Siu kindlypreparedthe finalversionof thismanuscript.This researchwas supportedfinancially
by the
Natural Sciencesand EngineeringResearchCouncil
of Canada, the Canadian WildlifeService(EnvironmentCanada), and theDepartmentof IndianAffairs
and NorthernDevelopment.
References
? 1996British
Ecological Society,
JournalofEcology,
84, 841-851
R.L., Rockwell,R.F. & Maclnnes,
Abraham,K.F., Jefferies,
C.D. (1996) Whyare thereso manywhitegeesein North
Waterfowl
America?Proceedingsofthe7thInternational
Memphis,Tennessee,U.S.A. (ed. J. Ratti).
Symposium,
Ducks Unlimited,Memphis,in press.
AgricultureCanada (1987) The Canadian Systemof Soil
Classification,2nd edn. AgricultureCanada Expert
Committeeon Soil Survey.AgricultureCanada Publication1646,Ottawa.
Andrews,J.T. (1966) Patternsof coastal upliftand deglaciation,WestBaffinIsland,N.W.T. Geographical
Bulletin,
8, 174-193.
Andrews,J.T. (1973) The WisconsinLaurentideice-sheet:
dispersalcentres,problemsof ratesof retreat,and climatic interpretations.
Arcticand Alpine Research,5,
185-189.
Armstrong,
W. (1979) Aerationin higherplants.Advances
in BotanicalResearch,7, 225-232.
Aitkin,O.K., Villar,R. & Cummins,W.R. (1994) The ability
ofseveralhigharcticplantspeciesto utilizenitratenitrogen underfieldconditions.Oecologia,92, 239-245.
Aziz, S.A. & Nedwell,D.B. (1986) The nitrogencycle of
an east coast U.K. salt marsh II. Nitrogenfixation,
nitrification,
denitrification,
tidal exchange. Estuarine
and Coastal ShelfScience,22, 689-704.
Bazely,D.R. & Jefferies,
R.L. (1985) Goose faeces:a source
of nitrogenfor plant growthin a grazed salt marsh.
JournalofEcology,22, 693-703.
Bazely,D.R. & Jefferies,
R.L. (1986) Changes in the compositionand standingcrop of salt-marshcommunities
in responseto theremovalof a grazer.Journalof Ecology,74, 693-706.
R.L. (1989) Leaf and shoot
Bazely, D.R. & Jefferies,
demographyofan arcticstoloniferous
grass,Puccinellia
in responseto grazing.JournalofEcology,
phryganodes,
77, 811-822.
Berendse,F. & Jonasson,S. (1992) Nutrientuse and nutrient
cyclingin northernecosystems.ArcticEcosystemsin a
ChangingClimate(eds F. S. Chapin III, R. L. Jefferies,
J. F. Reynolds,G.R. Shaver& J. Svoboda). Academic
Press,London.
Binkley,D. & Hart,S.C. (1989) The componentsofnitrogen
availabilityassessmentsin forestsoils. Advancesin Soil
Science,10, 57-112.
of grazing
R.L. (1984) The effects
Cargill,S.M. & Jefferies,
by lessersnow geese on the vegetationof a sub-Arctic
saltmarsh.JournalofAppliedEcology,21, 699-686.
Coley,P.D., Bryant,J.P.& Chapin,F.S. III (1985) Resource
availabilityand plant antiherbivoredefense.Science,
230, 895-899.
Day, R.W. & Quinn,G.P. (1989) Comparisonsoftreatments
after an analysis of variance in ecology. Ecological
Monographs,59, 433-463.
Eno, C.F. (1960) Nitrateproductionin the fieldby incubatingthesoil in polyethylene
bags. Soil ScienceSociety
ofAmericaJournal,24, 277-279.
Fenchel,T. & Blackburn,T.H. (1979) Bacteriaand Mineral
Cycling.AcademicPress,London.
Giblin,A.E., Nadelhoffer,
K.J.,Shaver,G.R., Laundre,J.A.
& McKerrow, A.J. (1991) Biogeochemicaldiversity
along a riversidetoposequencein arcticAlaska. EcologicalMonographs,61, 415-435.
Gordon,A.M. (1988) Use of polyethylene
bags and filmsin
soil incubationstudies.Soil ScienceSocietyof America
Journal,52, 1519-1520.
Gordon, A.M., Tallas, M. & Van Cleve, K. (1987) Soil
ofbag thickness
incubationsin polyethylene
bags: effect
and CO2
on nitrogentransformations
and temperature
CanadianJournalof Soil Science,67, 65permeability.
75.
Hart,S.C. & Gunther,A.J.(1989) In situestimatesofannual
in a subarcticwaternetmineralization
and nitrification
shed. Oecologia,80, 284-288.
R.L. & Sinclair,A.R.E. (1992) Foraging
Hik, D.S., Jefferies,
by geese,isostaticuplift)and asymmetry
in the development of salt-marshplant communities.Journalof
Ecology,80, 395-406.
R.L. (1991) InversesalinitygradiIacobelli,A. & Jefferies,
entsin coastal marshesand thedeathofstandsof Salix;
851
D.J. Wilson&R.L.
Jefferies
? 1996 British
Ecological Society,
JournalofEcology,
84, 841-851
theeffects
of grubbingby geese.JournalofEcology,79,
61-73.
Jefferies,
R.L., Davy, A.J.& Rudmik,T. (1979) The growth
strategiesof coastal halophytes.EcologicalProcessesin
Coastal Environments
(eds R. L. Jefferies
& A. J.Davy).
BlackwellScientific
Publications,Oxford.
Jefferies,
R.L., Klein,D.R. & Shaver,G.R. (1994) Vertebrate
herbivoresand northernplant communities:reciprocal
influences
and responses.Oikos,71, 193-206.
Jefferies,
R.L. (1988a) Patternand processin arcticcoastal
vegetationin responseto foragingby lessersnow geese.
Plant Form and VegetationStructure(eds M. J. A.
Werger,P. J. M. van der Aart,H. J. During& J.T. A.
Verhoeven),pp. 281-300. SPB Academic Publishing,
The Hague.
R.L. (1988b) Vegetationalmosaics,plant-animal
Jefferies,
interactions
and resourcesforplantgrowth.Plant Evolutionary
Biology(eds L. D. Gottlieb& S. K. Jain),pp.
341-369. Chapman and Hall, London.
Kielland,K. (1994) Aminoacid absorptionby arcticplants:
implications
fornitrogennutrition
and nitrogencycling.
Ecology,75, 2373-2383.
Kirk, R.E. (1982) Experimental
Design; Proceduresfor the
BehaviouralSciences,2nd edn. Brooks/Cole,Monterey,
CA.
van de Koppel, J.,Huisman,J.,van der Wal, R. & Olff,H.
(1996) Patternsofherbivory
alonga gradientofprimary
productivity:
an empiricaland theoreticalinvestigation.
Ecology,77, 736-745.
Morris,A.W. & Riley, J.P. (1963) The determinationof
nitratein sea-water.AnalyticaChimicaActa, 29, 272279.
Nadelhoffer,
K.J., Giblin,A.E., Shaver,G.R. & Laundre,
J.A.(1991) Effectsof temperature
and substratequality
in sixarcticsoils.Ecology,72,
on elementmineralization
242-253.
Nadelhoffer,K.J., Giblin, A.E., Shaver,G.R. & Linkins,
availA.E. (1992) Microbialprocessesand plantnutrient
abilityin arcticsoils. ArcticEcosystemsin a Changing
Climate (eds F. S. Chapin III, R. L. Jefferies,
J. F.
Reynolds,G.R. Shaver& J.Svoboda). AcademicPress,
London.
Odum, E.P. (1969) The strategyof ecosystemdevelopment.
Science,164, 262-270.
Pastor, J. & Naiman, R.J. (1992) Selectiveforagingand
ecosystemprocessesin boreal forests.AmericanNaturalist,139,690-705.
Paul, E.A. (1984) Dynamicsoforganicmatterin soils.Plant
and Soil, 76, 275-285.
Pomeroy, L.R. (1970) The strategyof mineral cycling.
AnnualReviewsofEcologyand Systematics,
1, 171-190.
Raison, R.J.,Connell,M.J.& Khanna,P.K. (1987) Methodologyforstudyingfluxesof soil mineral-Nin situ.Soil
Biologyand Biochemistry,
19, 521-530.
Ruess, R.W., Hik, D.S. & Jefferies,
R.L. (1989) The role of
Lesser Snow Geese as nitrogenprocessorsin a subArcticsalt marsh.Oecologia,77, 382-386.
SAS (1990) SAS/STAT?mUser'sGuide,Version6, 4th edn.
SAS InstituteInc., Cary,NC.
Solarzano, L. (1969) Determinationof ammoniain natural
watersby the phenol-hypochlorite
method.Limnology
and Oceanography,
14, 799-801.
Srivastava,D.S. & Jefferies,
R.L. (1995a) The effectof salinityon leafand shootdemographyoftwoarcticforage
species.JournalofEcology,83, 421-430.
R.L. (1995b) Mosaics of vegSrivastava,D.S. & Jefferies,
etationand soilsalinity:a consequenceofgoose foraging
in an arcticsaltmarsh.CanadianJournalofBotany,73,
75-83.
R.L. (1996) A positivefeedback:
Srivastava,D.S. & Jefferies,
of
herbivory,
plant growth,salinity,and desetification
an Arcticsaltmarsh.JournalofEcology,84, 31-42.
Tabachnick,B.G. & Fidell, L.S. (1989) UsingMultivariate
Statistics,2nd edn. Harper-Collins,New York.
Vitousek,P.M., Matson,P.A. & van Cleve,K. (1989) Nitrogen availabilityand nitrification
duringsuccession:Primary,secondaryand old-fieldseres.Plantand Soil, 115,
229-239.
ZoBell, C.E. (1946) Studies on redox potentialof marine
sediments.Bulletinof theAmericanAssociationof PetroleumGeologists,30, 477-513.
Received7 December1995 revisedversionaccepted30 May
1996
© Copyright 2026 Paperzz