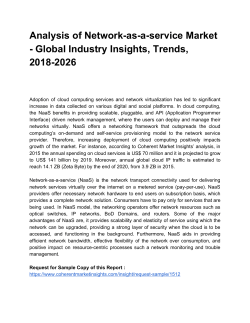
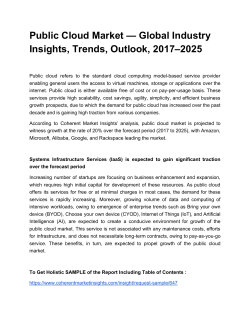
IN-SITU CLOUD MEASUREMENTS DURING THREE PALLAS CLOUD EXPERIMENTS
K.M. DOULGERIS and D. BRUS
Finnish Meteorological institute, P.O. Box 503, FI-00101, Helsinki, Finland.
.
Keywords: clouds, Pallas, in-situ, probes
INTRODUCTION
Clouds properties and their formation are poorly understood in the global climate system and the aerosol
effect via clouds forms the largest source of uncertainty in predictions of climate change (IPCC, 2013).
Many of the climatically important cloud properties (e.g. albedo, precipitation rate and lifetime) depend,
amongst other factors, on the number concentration of aerosol particles and on their chemical composition
(Komppula et al., 2005; Lihavainen et al., 2008).
Continuous, semi-long term, ground based, in-situ cloud measurements were conducted during the autumn
intensive Pallas Cloud Experiments (PaCE) in years 2012, 2013 and 2015. The main motivation for those
campaigns was to investigate aerosol cloud interaction. The measurements were conducted in Finnish subArctic region at Sammaltunturi station, the part of Pallas-Sodankyla- Global Atmosphere Watch (GAW)
programme.
METHODS
The Sammaltunturi measurement site (67°58´N, 24°07´E, 560 m a.s.l.) is located at a hill top. During
autumn, the station is usually about 50 % of the time inside a cloud which allows direct in-situ cloud
measurements. During PaCE 2012, 2013 and 2015 the Cloud, Aerosol and Precipitation Spectrometer
probe (CAPS., DMT) (0.51 µm– 930 µm) and the Forward Scattering Spectrometer Probe (FSSP-100,
DMT) (1.2 - 47 µm) were installed at the roof of the station (Fig.1). The CAPS probe includes two
instruments for droplet size measurements: the Cloud and Aerosol Spectrometer (CAS) (0.51 µm - 50
µm), and the Cloud Imaging Probe (CIP) (12.5 µm – 930 µm). In this abstract we provide only result
examples from the analysis of the cloud properties and how they were influenced by meteorology made
only for CAS measurements.
Figure 1. A) FSSP-100 and B) CAPS probes as they were installed on Sammaltunturi measurement site
during PaCE 2015.
In this work in order to estimate the presence of a cloud at the measurement site we used the cloud droplet
count measured with the cloud probes. This was then crosschecked against the visibility measurements.
We considered that the station was inside a cloud while the horizontal visibility was less than 1000 meters.
RESULTS
Example statistical information about Pallas experiments are summarized in Table 1. PaCE 2012 lasted
from September 13th till October 30nd, PaCE2013 lasted from September 14th till November 28nd and
PaCE 2015 lasted from October 6th till December 2nd. CAPS measurements covered around 90% of each
campaign. However during PaCE 2013 the coverage was less because during the first month of the
campaign, CAPS was not installed due to service maintenance delays. As a cloud event we defined the
situation when the station was inside a cloud for at least a part of the day. Half an hour of continuously
cloud measurements was set as the minimum limit of a cloud event. All the meteorological data which are
demonstrated in Table 1 were calculated only for the period that the station was inside a cloud.
PaCE
2012
PaCE
2013
PaCE
2015
Days of the
campaign
48
Cloud event
days
40
CAPS
coverage
90%
temperature
range (Co)
from -9.5
to 6.6
wind speed
avg (m/s)
6.5 (2.4)
visibility avg
(m)
301.4 (179.9)
75
64
44%
from -12.0
to 9.9
7.3 (2.8)
338.3 (202.1)
59
34
88%
from -7.0
to 4.7
6.85 (2.4)
382.8 (210.4)
Table 1: General information about the PaCE 2012, 2013 and 2015. Table shows total number of days,
number of days with cloud events, CAPS coverage (%) during cloud events, the temperature range (Co)
when the station was inside a cloud and the average wind speed (m/s) and visibility (m) along with
corresponding standard deviations (in brackets) when the station was inside a cloud for each campaign.
In Table 2 the averaged data for effective diameter (EDCAS), median volume diameter (MVDCAS) and
liquid water content derived from CAS size distribution (LWCCAS) during all three campaigns are also
summarized.
Campaign
PaCE 2012
EDCAS (um)
14.10 (5.21)
MVDCAS (um)
15.39 (5.46)
LWCCAS(g/cm3)
0.040 (0.032)
PaCE 2013
13.38 (2.35)
14.86 (4.25)
0.025 (0.020)
PaCE 2015
12.28 (5.10)
13.38 (5.38)
0.029 (0.027)
Table 2: Averaged data of EDCAS, MVDCAS and LWCCAS along with corresponding standard deviations (in
brackets) when the station was inside a cloud for all three campaigns.
Figure 2 indicates the averaged values along with standard deviations of the EDCAS, MVDCAS and LWCCAS
for each campaign. Effective diameter (upper left), liquid water content (upper right) and median volume
diameter (lower left) show that the averaged values during each campaign were similar. In addition the
temperature trends and temperature range (lower right) were also similar for each year of the campaigns.
Figure 2. Horizontal lines represent the length of each campaign (PaCE 2012, 2013 and 2015) and
averaged effective diameter, liquid water content and median volume diameter along with standard
deviation. The daily averaged data for the temperature versus time for each campaign is also presented.
ACKNOWLEDGEMENTS
This work was supported by KONE foundation, Nordforsk Contract number 26060, CRAICC Amendment
on CRAICC-PEEX Collaboration, Academy of Finland project: Greenhouse gas, aerosol and albedo
variations in the changing Arctic (project number 269095), Academy of Finland Center of Excellence
program (project number 272041), BACCHUS (EU 7th Framework program), Natural Environment
Research Council (NERC), grant number NE-L011514-1 and ACTRIS-2, the European Research
Infrastructure for the observation of Aerosol, Clouds, and Trace gases. This project has received funding
from the European Union’s Horizon 2020 research and innovation programme under grant agreement No
654109.
REFERENCES
IPCC, 2013: Summary for Policymakers. In: Climate Change 2013: The Physical Science Basis.
Contribution of Working Group I to the Fifth Assessment Report of the Intergovernmental Panel on
Climate Change [Stocker, T.F., D. Qin, G.-K. Plattner, M. Tignor, S.K. Allen, J. Boschung, A. Nauels,
Y. Xia, V. Bex and P.M. Midgley (eds.)]. Cambridge University Press, Cambridge, United Kingdom
and New York, NY, USA, 2013.
Lihavainen, H., Kerminen, V.-M., Komppula, M., Hyvarinen A.-P., Laakia J., Saarikoski S., Makkonen,
U. Kivekas, N., Hillamo, R., Kulmala, M. and Viisanen, Y. (2008) Atmos. Chem. Phys., 8,
Komppula, M., Lihavainen, H. and Kerminen, V.-M. (2005) J. Geophys. Res., 110, D06204
© Copyright 2026 Paperzz