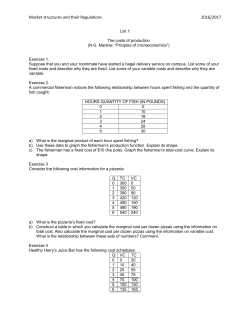
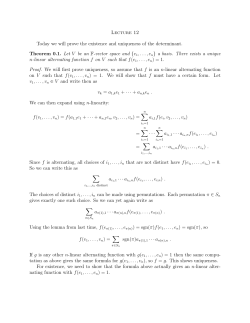
NTNU Exercise 5 Norwegian University of Science and Technology. Faculty of Engineering Science Department of Marine Technology. Solution TMR4205 Buckling and Collapse of Structures Buckling of module truss-work ________________________________________________________________________________________________ Date: March 2008 Signature: JAm Distributed Due Date: The given column can be idealised as shown in Figure 1 below. The weak and strong axis of the cross-section are also indicated in the figure. Since the element’s slenderness, , uniquely defines the Euler buckling stress, the governing buckling mode can be determined by examining the slenderness ratios; the highest slenderness gives the lowest buckling stress. Therefore, it is natural to design using the highest slenderness ratio. y-y Strong axis (x-x) L x-x Weak axis (y-y) L/3 Figure 1. The following calculations has been performed using a simple spreadsheet algorithim in EXCEL. a) Design using hot rolled IPE profile. If we randomly start with IPE240 and neglect the curved shape at the corners, we obtain the following cross-sectional properties:A 3718.5 mm 2 I x 3.67 10 7 mm 4 I y 2.83 10 6 mm 4 i I A i x 99.4 mm i y 27.6 mm The effective buckling length is given by, lk k L lkx 1 9000 9000 mm lky 1 9000 3 3000 mm where the effective length factor k = 1 has been used for a simple supported column. The slenderness ratio is given by, 1 lk i x 90.6 y 109.0 y x This result implies that buckling about the y-axis (weak-axis) is the critical one. Taking the Young’s modulus for steel E = 2.1105 MPa, the Euler buckling stress can is calculated as, 2E E 2 175MPa y Y 240 117 . E 175 From Figure 4.10 in the compendium or Figure 2.3 (The column selection chart) in the classification note 30.1, we select column curve b for I and H hot rolled sections, i.e., h b 240 120 2.0 12 . column curve b Weak axis buckling and from Table 4-2 in the compendium we obtain for, column curve b; column curve b 35 o 0.2 Then we proceed as follows, o 0.34 cr Y 1 2 1 2 2 2 2 4 2 118 MPa The column capacity and the acting load on the column (design load) are given respectively as, c cr 118 102 MPa m 115 . N 390000 d 105 MPa A 3718.5 d c not OK Since the capacity of the column is less than the design load, we conclude that IPE240 can not carry the given load. The difference in values here is small, and it is likely that taking the true values (considering the curved corners) for the area and other cross-sectional properties could make IPE240 satisfy the design criteria. However, since we have considered the idealized case (sharp corner shape) we should, theoretically, repeat the design check using the nearest larger cross-section, or recheck the existing IPE240 by using the true cross-sectional parameters. The design was repeated using IPE270 and the requirement was satisfied in a way that, 2 c cr 135.4 118 MPa m 115 . N 390000 d 88.6 MPa A 4401 d c OK 1,6E+02 1,4E+02 stress critical stress 1,2E+02 1,0E+02 acting stress 8,0E+01 6,0E+01 3,0E+03 4,0E+03 5,0E+03 6,0E+03 area Figure 2. Acting stress and Critical stress as a function of Area. b) Design using Aluminium profile If the aluminium profile is to be used instead of steel, the same calculations as done in part (a) but using the profiles in Table 2 with aluminium material properties yield the following results for I300; c cr 62.34 56.7 MPa m 110 . N 390000 d 49.0 MPa A 7964 d c OK The weight ratio between aluminium and steel sections which satisfy the design criteria is calculated from, r a Aa 2700 7964 0.622 s As 7860 4401 oo0O§O0oo 3
© Copyright 2026 Paperzz