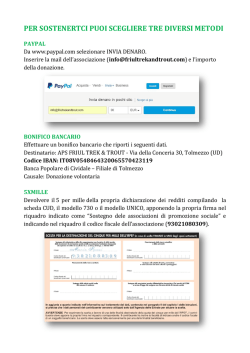
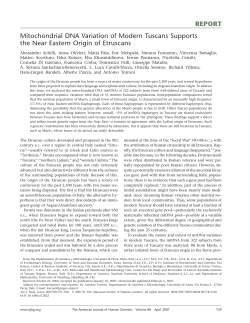
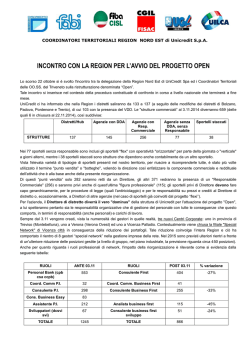
Molecular Ecology (1994) 3, 161-171
Mitochondria1 control region and protein coding
genes sequence variation among phenotypic forms of
brown trout Salmo trutta from northern Italy
E. GIUFFRA, L. BERNATCHEZ* and R. GUYOMARD
Laborntoire de Ghdtique des Poissons, INRA, 78352 Jouy-en-Josas, France and
‘INRS-Em, 2800 rue Einstein, suite 105, CP 7500, Sainte-Foy, QuPbec, Canada GI V 4C7
Abstract
The PB River basin of northern Italy is the home of distinctive and endemic morphological forms of brown trout Salmo trutta. We used PCR-direct sequencing and RFLP
techniques to study variation in the mitochondrial control region of 225 trout in order to
assess genetic relatedness among 18 populations from that region. The distribution
analysis of these genotypes among north Italian populations confirmed the phylogenetic
differentiation of marbled trout Salmo trutta marmoratus populations and the postglacial
origin of S. t. carpio. Extensive genetic heterogeneity was observed among morphologically identical S. t. faria populations. Introgression with domestic strains of Atlantic
basin origin was detected in all forms. In order to assess the phylogenetic congruence
detected in coding and noncoding regions of the mitochondrial genome, we also analysed
sequence variation in segments of the cytochrome b and ATPase subunit VI genes among
representatives of all variants detected in the analysis of the control region. Variation in
protein coding genes was only slightly less than that observed in the control region of the
same individuals, both in terms of number of variants detected and of pairwise sequence
divergence estimates among variants. Phylogenetic analysis based on protein coding
genes sequences identified the same phylogenetic groupings defined by the control
region analysis and also allowed a partial resolution of their phyletic relationships that
was previously unresolved. However, coding and noncoding segments differed substantially in the transition-transversion ratio (17:O in coding segments vs. 1 2 6 in control
region segments).
Keywords: control region, mitochondrial DNA, phylogeny, polymerase chain reaction,
protein coding genes, S. trutta
Received 8 ]lily 1993; revision received 1 October 1993; accepted 11 November 1993
Introduction
Throughout its natural distribution range, the brown trout
Salmn tvzrtta L. is composed of numerous geographic forms
which exhibit complex patterns of phenotypic diversity.
Based on the extent of morphological differentiation, numerous attempts have been made to interpret the-evolutionary history and resolve phylogenetic relationships
among brown trout populations (Behnke 1968, 1972).
Correspondence: Louis Rernatchez, INRSEau, 2800 rue Einstein,
suite 105, CP 7500, Sainte-Foy (Quebec), Canada G l V 4C7. Fax
(418) 6542600.
Nevertheless, there are still many uncertainties and inadequacies in the classification of the different forms, and
consequently, considerable taxonomic confusion in this
population complex still persists in contemporary literature (Lelek 1987). Thus, various morphological variants
are still recognized either as full species, subspecies or
morphs depending on authorship. The lack of understanding on the relationships and significance of phenotypic differentiation among brown trout populations has
practical drawbacks for their conservation and management in the face of increasing exploitation and habitat alterations. For example, several genetic studies have
demonstrated the polyphyletic origin of several ecological
variants, such as anadromous and sedentary forms
162 E . GIUFFRA ctal.
(Behnke 1986; Skaala & Naevdal 1989; Hindar rf al. 1991;
Skaala 1992).Conversely, it has been demonstrated genetically that morphologically similar populations may belong to very distinct evolutionary lineages (Guyomard
1989; Bernatchez et a!. 1992). In both situations, management decisions solely based on levels of morphological
distinction would fail to recognize the fundamental genetic basis of differentiation among these populations.
The PB River basin of northern Italy is the home of several distinct forms of trout, some of which are highly distinctive and endemic to the Adriatic basin. These forms are
considered as threatened in Europe (Lelek 1987). One of
them is the marbled trout Salmo trutta rnarmoratus. It inhabits larger tributaries of this region where it is found in
parapatry with the more typical fluviatile landlocked form
of trout, S . truttafario, from which it can readily be distinguished by a complete lack of black and red spots on the
body, the presence of a unique light-coloured marbled
patterning and anatomical characteristics such as body
shape (Sommani 1948, 1961). Based on its high morphological distinctiveness, it has been hypothesized that the
marbled trout represents the earliest branching in the S.
trutta complex and deserves specific status (Behnke 1968).
Another morphologically unique population is endemic to
Lake Garda and known as carpione, or S. trutta carpio. It is
a small deep-water, bottom-spawning trout and, unlike
any other trout population, it exhibits peculiar adaptations
for a benthic mode of life (DAncona & Merlo 1958).
In a recent PCR-direct sequencing analysis of mitochondrial DNA sequence variation among European
brown trout populations, levels of genetic differentiation
did not correlate with the extent of morphological distinction of these forms (Bernatchez et al. 1992). Genetic data
did not
the hypothesis that marmor~rlls represents
the oldest branching in the s. trutta complex, and rather
suggested that its branching" does not appear earlier than
that of any of the other major population groupings identified. The form cnrpio could not be associated with any distinct genotype but represented a mixture of different
mtDNA groupings. However, because only a limited sampling of northern Italy was included in the study and these
results were based only on variation of the noncoding,
control region, it is possible that the apparent lack of congruence between phylogenetic hypotheses based on levels .
of morphological and genetic differentiation was due to an
insufficient genetic characterization of these populations.
In this paper, we used PCR and direct sequencing techniques to compare mitochondrial DNA sequence variation
observed among morphologically distinct marmoratus and
carpio populations, and PB River basinfario populations by
analysing segments of two coding genes, the cytochrome b
and the ATPase subunit-VI genes, in addition to segments
of the mitochondrial control region studied by Bernatchez
~f al. (1992).This allowed us to: (a) test the congruence in
--
phylogenetic relationships among brown trout populations inferred from the analysis of coding and noncoding
regions of the mitochondrial genome, (b) improve the
resolution of the intraspecific phylogenetic tree previously
obtained for 5. trtitta, ( c )present a first detailed analysis of
the genetic variation among north Italian brown trout
populations and, (d) document the levels of genetic contamination among native populations due to the stocking
programs in northern Italy.
Materials and methods
Sample collections
A total of 225 trout were collected between 1990 and 1992.
These samples represented eight populations of the form
marmoratus distributed throughout its distribution range,
seven populations of the formfario from the same or adjacent tributaries and the unique carpio population (Table 1,
Fig. 1).The identification of specimens to a given morphological form was based on diagnostic characteristics,
namely skin colour pattern and body shape. Most samples
were obtained from apparently unstocked locations with
domestic strains, unless otherwise indicated in Table 1 . In
order to detect the potential genetic contamination of native populations resulting from stocking, we also characterized mtDNA variation of individuals from the two
major domesticated populations used in stocking programs in the Piemonte region and of eight additional individuals from a fish farm from Gournay, France.
Table 1 Origins,
~. phenotypic identification, and sample sizes ( N )
of trout popuhtions sampled in the P6 River basin from northern
Italy. Asterisks indicate populations currently stocked with domestic strains of Atlantic basin origin
1.
a Pellice Villairanca
b
c
d
e
f
g
h
i
j
k
1
m
n
o
P
q
r
Pellice Torrepellice
Stura di Lanzo
Toce
Brenta (9
Gesso
Sarca (9
Stura di Demonte Vinadio
Stura di Demonte Sambuco
Ripa
Chisone P. Argentina (*)
Chisone S. German0 (*)
Chisone Fenestrelle
Fontanaccia (*)
Tagliole (*)
GardaLake
Dom. Perosa Argentina
Dom. Cuneo
N
Phenotype
10
10
20
10
12
marmoratiis
martnorat iis
17
8
15
15
6
12
10
15
15
12
16
12
10
marmoratus
tnarmoratus
marmoratiis
marmoratus
marmorat us
marmoratirs
fario
jario
farlo
fnrio
furio
furio
fnrio
carpio
domestic
domestic
mtDNA SEQUENCE VARIATION IN Salmo trutta 163
Fig. 1 Geographic locations of
trout populations sampled in the
P6 River basin for mtDNA
sequence analysis. Shadowed area
indicates the distribution of the
morphologically distinct form
Salmo frutta marmoratus (after
Sommani 1961)
D N A extraction
DNA was extracted from frozen muscle or liver following
the protocol of mtDNA extraction of Bernatchez et al.
(1988) or the protocol for total DNA extraction of Kocher
et al. (1989).For two individuals, DNA was obtained from
muscle of museum specimens fixed in formalin and conserved in ethanol (70%)after Paabo (1990),adding a dialysis of the minced tissue in a microconcentrator (Centricon
30, Amicon).
D N A amplification and sequencing
Double-stranded PCR amplifications of the control region
were performed in a programmable thermocycler (Prem
IIItm, LEP Scientific) using the same primers and protocols reported in Bernatchez et nl. (1992).For museum specimens an additional primer (H2: 5' CGTTGGTCGGTTCTTAC-3') reported in Bernatchez & Danzmann (1993)
was used in conjunction with primer L19 of Bernatchez et
a/. (1992) to amplify a region of approximately 350 bp at
the 5' end of the control region. Moreover, BSA (bovine
serum albumin, 0.1 pg/mL from Sigma, St Louis, MO) was
added to the PCR mix used for museum specimens in order to overcome the inhibitory activity, of unknown origin, occasionally present in old material extracts (Paabo
19901,
The primers L14841 and H15149 described in Kocher
et al. (1989) and modified as McVeigh el al. (1991) were
used to amplify a 308-bp segment at the 5' end of the c y t e
chrome b gene. PCR reaction mix composition was identical to that described in Bernatchez etal. (1992).The thermal
profile used for the cytochrome b gene segment was as follows: one denaturation (95"C, 1 min) followed by 40
cycles of strand denaturation (92 "C, 1 rnin), primer annealing (55 "C, 1 rnin), and DNA extension (72 "C, 45 s).
For the ATPase subunit-VI gene, we used primers H9208
(5'-TATGCGTGTGClTGGTGTGCCA-3') and L8558 (5'AGCTTCTTCGACCAATITATGAG-3') designed by E.
Giuffra and P. Presa (Laboratoire de Gknbtique des Poissons, INRA, 78352 Jouy-en-Josas, France) from sequence
homology between Pacific salmon (genus Oncorhynchus)
and distant taxa (Xenopus, Caenorhnbditis, Sirongylocentrotus and human). This set of primers amplifies a 697-bp
segment comprising the full gene. PCR conditions were as
followed: a first denaturation step (95 "C, 1 min), followed
by 35 cycles with denaturation at 92 "C (1rnin), annealing
at 62 "C (1 min), and extension at 72 "C (1 min) with a final
elongation step (72 "C,10 mid.
Amplified DNA was purified either on Na45 nitrocellulose membranes (Scleicher & Schuell) according to the
supplier's protocol or by selective alcohol precipitation
(Benmansour, personal communication; Laboratoire de
Pathologies des Poissons, INRA, 78352, Jouy-en-Josas,
France) as follows:
1 extraction in 100 pL with 1 vol. choloroform-isoamyl
alcohol (24:l);
2 10 minutes' precipitation in 1.4 M ammonium acetate
(pH 5.0), 70% isopropanol and 15 min centrifugation;
3 DNA pellets rinsed in 200 pL of ethanol (70%) and centrifuged for 10 min; and
4 vacuum-dried pellets resuspended in 10 pL of sterile,
distilled water.
Double-stranded DNA sequencing procedures were as
described Bernatchez et al. (1992)with the following modifications. Sequencing of the 5' end of the control region
was done using the internal primer H2. For coding genes
segments, both light and heavy strand primers were used
to obtain complementary sequences. Furthermore, the termination reaction tubes contained 1.5 pL each of ddNTPs
mixture and 1.0 pL of the extension mix in order to elongate the readable portion of the sequence.
164
E. GIUFFRA et a[.
genetic trees according to a maximum parsimony criterion
(analogous to Wagner trees) using the DNAPARS program.
Majority-rule consensus trees were constructed using the
CONSENSE program and confidence statements on branches
were estimated by running DNAPARS on 1000 bootstrap
replicates obtained by SEQBOOT program. These same analybcal procedures were then performed on coding and
noncoding segment, from data sets pooled together to
generate overall phylogenetic trees. In all cases, trees were
rooted using Atlantic salmon (Salrno salar) (obtained from
Matredal hatchery, Norway) sequence as an outgroup.
Intra- and interpopulation genetic diversity was measured by the maximum likelihood estimation of the average
number of nucleotide substitutions per site within and between populations (Nei 1987).We constructed a matrix of
net interpopulation nucleotide divergence which was
used to build a phenogram (NEIGHBOUR, option UPGMA;
PHYLIP 3 . 5 ~relating
)
all populations analysed.
RFLP analysis of the control region
Based on the sequencing results of brown trout mitochondrial control region, we identified a diagnostic restriction site combination that allowed us to assign 88
additional individuals to one of the major mtDNA groupings described in Bernatchez et al. (19921,without the need
of performing complete sequencing (Table 5). To do so,
PCR-amplified DNA was purified by phenol/chloroform
extraction, precipitated in 70% ethanol and resuspended
in sterile, distilled water. AluI and AsnI restriction enzymes were used as recommended by the supplier to detect the presence or absence of the four restriction
polymorphic sites that characterized the major mtDNA
groupings.
Sequence analysis
Sequence data obtained for coding and noncoding gene
segments were separately subjected to both distance and
character-based analyses. The distance measure used was
the estimate of nucleotide substitution calculated under
the Kimura two-parameter model (Kimura 1980).The resulting matrices of painvise distance comparisons were
used to build trees using the Neighbour-Joining algorithm
(Saitou & Nei 1987) on which confidence estimates were
obtained from 1000 bootstrap replicates. This procedure
was carried out by the program s N i s o o T provided by J. M.
Cornuet (Laboratoire de Biologie et GenCtique Evolutive,
Universitb d’Orsay, France). Character-based analysis was
realized using the PHYLIP 3 . 5 ~computer package (Felsenstein 1993). Sequence data were used to generate phylo-
(a) Sequence
Pop’n
AT1
ME1
ME2
AD1
MA1
MA2
8
b
1
8
C
d
f
g
5 (2)
3
1
The sequence of a 310-bp segment at the 5’ end of control
region (homologous to the one studied by Bernatchez et al.
(1992)) was determined for 137 trout. A total of seven
genotypic variants were identified for this segment among
Italian populations (Table 2). All of them were previously
detected among European populations and they represented four of the five phylogenetic groupings described
in Bernatchez et al. (1992); Atlantic (AT), Adriatic (AD),
Mediterranean (ME) and Marmoratus (MA).
AT
ME
AD
19
10
5
8 (1)
4
1
8
16
8
15
8 (2)
5(2)
1
1
k
1
rn
l(1)
7
4
5
15
1
1
7
3
7(2)
5
10)
1 (1)
0
2
8 (1)
8 (1)
7(2)
l(1)
l(1)
7
4
1
12
10
4
4
h
n
MA
10
9
1
I
8
12 (1)
h
r
MA3
8 (1)
1
P
q
Sequence variation and diversity of mtDNA genotypes
(b) Sequence + RFLP
a
e
Results
3
7
5
8
8
2
9
4
Table 2 (a) Absolute frequency
distribution of seven mtDNA
variants detected among 137 Salrno
trutta control region sequences; (b)
absolute frequency distribution of
the four major mtDNA groupings
among 225 trout from the Pt, River
basin detected either by sequence
or RFLP analyses. Genotype and
mtDNA groupings designation
refers to nomenclature used in
Bernatchez et al. (1992); Atlantic
(AT),Adriatic (AD), Mediterranean (ME) and martnorutus (MA).
Numbers in parentheses refer to
individuals used for cytochrome b
and ATPase subunit-VI genes
sequence analyses
mtDNA SEQUENCE VARIATION IN S n h o frirttn
165
noncoding mtDNA sequences. The cytochrome 6 gene
segment was homologous to the one analysed for S. salnr
by McVeigh et al. (1991). The ATPase subunit VI segment
was homologous to that of rainbow trout Oncorhyiichirs
mykiss anaiysed by Thomas & Beckenbach (1989). However, the sequence alignment of S. frutfa and S. snlnr with
that species revealed the insertion of four additional
codons (Fig. 2). A minimum of 295 bp and 315 bp could be
determined for each segment respectively (Fig. 2 a,b).
We then subsampled 20 individuals representing each
of these major groupings to determine sequence variation
for a segment of both the cytochrome 6 and ATPaje
subunit VI genes (Table 2). We also extended the coding
regions sequence analysis to four additional trout (for a
total of 24 individuals) representing other control region
genotypic variants (DAI, DA2, AD3 and AT2) reported in
Bernatchez ef al. (1992) (ADZ unavailable) in order to perform a more complete phylogenetic analysis of coding and
ATPase subunit Vl
1
S salar
S butta
. . . . . . . . . . . . . . . . .G.. ...A*.....
CGAAACCAEC
CCACCGCCGC
50
........ 0. ....... T . .
CCTCGGCCAT CTCCTGCCTG
AAGGAACCCC
1
S salar
S trutta
S salar
S truth
51
.C....A...
CGTTCCCCTA
2
101
........ T.
ATCCCCGTCC
100
.T........
TCATTATTAT
3
151
S salar
........ A. . . . . . . . . . . . . . T......
s trufte
CACCTCCTCA
S salar
S butta
201
C,.A......
AATGCCTACA
TTCARCTAAT
CGAEACAATT
AGCCTTTTTA
4
150
C.
C..T..
GTACGACTTA CAGCTAACCT CACAGCAGGC
............................
TCCGCCCCCT CGCCCTTGGT
....................
CGCCACAGCA
....
..........
200
............
A.......
GCCTTTGTCC TCCTACCXAT
5
7
250
C...
A..T....
TAACTTCTAT CGTCCTATTC CTGCTCACCC
..........................
GTAGCAATCC
6
..
8
251
S salar
S trutta
......................
T'CTTGAAAT
TGCCGTTGCC
10
. . . . . . . . . . . . . .31.5
9
300
.............
A.......
T......
ATEATCCAAG CCTATGTATT TGTCCTACTC
11
301
S salar
s htta
CTAAGCCTCT ACCTA
................ H 9 2 0 8
Cytochrome b
1
S.salar
S.trutta
S. salar
s.trutta
S.salar
s.tmtta
S.salar
s.tnma
.c
50
................. c .......... .........C ........ G.
CTCTTAGGCT TATGTCTAGC CACCCAAATT CTTACCGGAC
12 13
51
100
T....
TCTTCCTAGC CATACACTAC ACCTCCGATA TCTCAACAGC CTTTTCCTCT
14
15
101
150
T.....
T
GTTTGCCACA TTTGCCGRGA XGTTAGCTAC GGCTGACTCA TCCGAAACAT
17
16
151
200
CTTTGGCTCA
..............................
..........
.............................
..............
.............................................
TCACGCTAAC GGAGCATCTT
201
S.salar
s.trutta
..........
CCCGAGGACT
T..T......
CTACTATGGT
251
S. salar
S.trutta
.....
..... T....
.T........
GGAGTCGTAC TGCTACTTCT
c....
TCTTCTTTAT CTGTATTTAT ATACATATCG
.....
....................
250
T....
TCCTACCTAT ATAAAGAAAC CTGAAATATC
. . . . . . . . . . . . T .......
CACTATAATA ACCGCCTTCG
295
.AL...
TGGGC
Fig. 2 DNA sequences (L strand) of segments of the cytochrome b (Fig. 2a), and ATPase subunit-VI (Fig. 2b) mtDNA genes, from Salrno
trutta type AT1 (domesticstrain) and S. salnr. Nucleotides are given for S. salar when different from S . truttn, while identity is indicated by
dots. Variable positions among brown trout mtDNA variants are underlined and numbered. The four additional codons found by aligning
the sequence of the ATPase subunit V1 gene with that of rainbow trout are shadowed. The sequences presented in this paper (cf. Table 3)
have been entered into GenBank under the accession numbers X74240 to X74245.
166
E . GIUFFRA eta!.
Table 3 Variable nucleotide positions of cytochrorne b and ATPase subunit VI genes observed among individuals representing 11 Salmo
trutta mitochondridl control region variants described in Bernatchez ef al. (1992).Numbers above sequences refer to variable nucleotide
positions in Fig. 2. Nucleotide at each position is given for genotypes AT(1,2). For other genotypes, nucleotides are given when different
from AT, and identity is indicated by dots. Abbreviations above sequences refer to amino acids. P) The non-silent mutation resulted in an
isoleucine - Valine replacement.
ATF’ase subunit VI
’ATl,2’
ME1
ME2
AD1
AD3
AD4
’MA1,2,3’
‘DAl,?.’
Cytochrome b
I
2
3
4
5
6
7
8
9
10
11
12-13
14
15
Gln
Leu
Ile*
Glu
Leu
Leu
Pro
Ala
Thr
Leu
Met
Leu
Ala
Tyr Asp
CCT
...C
..C
..C
..C
..C
..C
..C
GCA ACC CTT ATG
..G ... ..C . . .
. . . . . . ..C ...
. . . . . . ..C ...
. . . . . . ..C ...
. . . . . . ..C ...
. . . ..T ..C . . .
. . . . . . . . . ..A
TTA
C.G
C.G
GCC
TAC GAT CCA
CAG CTA ATT GAG CTC CTA
..A . . . . . . ..A ... ..G
..A . . . . . . ..A ... ..G
. . A T..
. . . ..A ... ..G
..A T.. . . . ..A ..T ...
..A T.. ... ..A ... ..G
..A ... G.. ..A . . . . . .
..A . . . . . . ..A ... ..G
Levels of variation detected among coding regions
were slightly less than that reported for the control region,
both in terms of number of mtDNA variants detected and
sequence divergence estimates among variants. The cytochrome b gene segment represented the least variable region, with six substitutions detected, compared to eleven
in the ATPase subunit-VI gene (Table 3 ) and 17 in the 5’
end segment of the control region analysed among the
same 24 individuals. Sequence variation in both coding
gene segments was strictly due to transitional events
(TS\TV ratio; 1 7 9 ) . Fourteen transitions occurred at the
third base of a codon, while the three others involved first
positions. Only one substitution in the ATPase subunit VI
gene involved a conservative amino acid replacement (Table 3). In the 5‘ and 3’end segments of the control region,
the transition:transversion ratio was nearly 3:l (176) and
three deletions were found (Bernatchez et al. 1992). By
combining the variable positions for coding segments, a
total of eight genotypic variants were detected as opposed
t o 11 in the control region (Table 3).Several control region
genotypic variants collapsed into a same coding segment
variant, namely MAI, MA2 and MA3, DAl and DA2, AT1
and AT2. In contrast, there was only one instance (AD41
where individuals with identical control region sequence
(one AD1 genotype individual) differed in a coding segment sequence (Table 3).
Pairwise sequence divergence estimates among
mtDNA variants detected in coding gene segments varied
from 0.17 to 1.70% (mean f SD: 0.93 k 0.40%), implying
one t o nine mutational steps ( 5 f 2.10) among 610 bp between genotypes (Table 4). These estimates were slightly
less than those reported by Bernatchez et al. (1992) for the
control region: divergence estimates ranged from 0.16 to
1.92%(1.20 0.44%); mutational steps among 640 bp from
1 to 12 (7.5 k 2.8).
*
16
17
Arg
.T . . . . . C . . .
. . . . . . ..c ...
. . . . . . . .c . . .
.
...
. .G
. .G
. .G
. .G
. . . . . . .
.c
...
. . . . . . ..c . . .
. . . . . . . .c . . .
. . . . . T . . C . .G
Table 4 Matrix of pairwise percentage sequence divergence estimates (below main diagonal) and observed number o f mutational
events differences (above main diagonal) in the 295-bp cytochrome b and 315-bp ATl’ase subunit VI gene segments among 24
trout representing 11 mitochondria1 control region genotypic
variants described in Bernatchez et al. (1992)
AT1,2
‘AT1,2’
ME1
ME2
AD1
AD3
AD4
’MA1,2,3’
’DA1,2’
’MA ’DA
ME1 ME2 AD1 AD3 AD4 1,2,3‘ 1,2’
1
1.70
1.35
1.18
1.18
1.35
1.35
1.52
0.33
0.84
1.18
0.67
1.01
1.18
0
3
0.50
0.84
0.33
0.67
0.84
8
7
6
4
0.33
0.17
0.84
1.01
8
7
5
4
0.50
0.84
1.35
8
5
3
2
3
0.67
0.84
8
7
5
6
5
5
9
7
5
6
7
5
7
1.18
Molecular trees
Both neighbour-joining tree and the majority-rule consensus tree resulting from the parsimony analysis of cytochrome b and ATPase subunit VI data had the same
topology. The parsimony analysis resolved a minimum of
11 equally parsimonious trees and the consensus tree required 23 mutational steps with a consistency index of
0.74. In both analyses, all individuals that clustered into
five separate groupings (AT, AD, MA, ME, DA) in the control region analysis also clustered distinctively in the coding regions analysis (Fig. 3). Similarly to the results of
Bernatchez et al. (1992), t h e AD grouping was the least
supported with a bootstrapping value of 45. Most branching pattern among these groupings also remained weakly
supported. A major difference was in the resolution of the
branching pattern of the AT grouping for which the early
divergence from other groupings was supported by a high
mtDNA SEQUENCE VARIATION IN Sdrno trirtta
Fig. 3 Neighhour Joining tree clustering
individuals representing 11 brown trout mtDNA
control region variants reported in Bernatchez et
a!. (1992)according to sequence variation in their
cytochrome b and ATPase subunit VI gene
segments. Clusters are numbered as in
Bernatchez ~f nl. (1992).Numbers above branches
indicate the number of bootstrap replicates (as a
percentage) for which the groupings were
supported. The topology of the majority rule
consensus network resulting from parsimony
bootstrap value (97) and by the rooting position between
that grouping and the others in the coding region analysis.
The distinction of the AT grouping was mainly due to
homology at four nucleotide positions with S. salar that
differed in all other S. trutta genotypes.
We then pooled sequence data obtained for both the
control region and the coding genes to generate overall
phylogenetic trees based on 1250 bp (Fig.4). Both the
neighbour-joining and the majority-rule consensus trees
had identical topology. Five major groupings were identified and supported by bootstrap values varying from 84 to
100, thus confirming that they represent phylogenetically
distinct assemblages. These groupings were well differentiated as indicated by the net sequence divergence estimates among them that varied from 0.79 to 1.24%
(mean = 1.05%). They were also completely congruent to
those identified solely on the basis of the control region
analysis. The early branching of the AT grouping was still
supported by the rooting position. Branching patterns
among other groupings were not significantly supported
although moderate bootstrap values (69 and 72) were in-
resolved by the combination of cytochrome b,
ATPase subunit VI, and control region segments
sequence data (n = 1250 bp). The five groupings
resolved are identical to those obtained from the
control region analysis alone. Confidence
statements (in percent) estimated from 1000
bootstrap replicates are given above branches.
The majority-rule consensus tree resolved from
parsimony analysis had identical topology and
comparable confidence statements; numbers of
the variable coding region sites are drawn on
rm
IM
111
DA1/01\2
~
b"
ME1
97
ME2
7W
LM1IMA2IMAl
-
167
46
'
I
1
AD3
I1
dicative that the DA grouping has a sister group relationship with the remaining three groupings (MA, ME, AD).
The branching pattern among these three groupings still
represented an unresolved trichotomy.
mtDNA variation among north Italian
brown trout populations
Because sequence information obtained from both coding
and noncoding segments was congruent in defining major
mtDNA phylogenetic groupings, we used data from the
control region only to document their distribution among
trout populations from the P6 River basin. Beside the 137
individuals that were sequenced, we analysed an additional 88 trout by diagnostic enzymatic restriction assays
(Table 5).
All mnrrnomtcis populations were clearly distinguished
from others (Table2). Thus, 93% (n = 86) of the 92
marmoruttis analysed belonged to mtDNA grouping MA.
The other six marrnorutus possessed the AT genotype,
which was characteristic of all fish from the two Italian
100
,m
I t $1I ,
'
.-
L
DA1
DA2
~
111
MAI
69
IW
3669....
- 8
L M . 2
MA3
"
1
;
.12
/L
98
O ' . ' .
39
-t
84
ME2
kF1
I
1
E. GIUFFRA etal.
168
and the French domestic strains surveyed. The AT grouping was naturally absent from southern drainages (Bernatchez et al. 1992), and has been introduced in northern
Italy from domestic strains originating from the Atlantic
basin.
[n contrast to marnorutus populations, the carpio population was not specifically associated with any given genotype, and was characterized by all four major mtDNA
groupings, including that of domestic origin.
High Ievels of heterogeneity in mtDNA variation were
observed among furio populations in which all four major
mtDNA groupings were observed with variable frequencies (Table 2). The domestic (AT grouping) genotype was
found at relatively high frequencies in most populations
known to be heavily stocked, except in the Sarca and
Chisone P. Argentina populations. Furthermore, the domestic genotype was observed in the Gesso population,
not reported to have been stocked. For other mtDNA
groupings, some populations, such as Stura di Demonte R.
vs. Fontanaccia and Tagliole R. were respectively fixed for
AD and ME rntDNA groupings. Conversely, samples
from Ripa R. and Chisone R. possessed both AD and ME
groupings. In addition, the MA grouping, that dominated
marmorufus samples was also present among Chisone R.
samples.
The distance matrix of net interpopulation nucleotide
divergence was used to construct a UPGMA tree relating all
18 trout populations studied (Fig. 5). The populations
Table 5 Polymorphic restriction sites from the control region for
restriction enzymes AIuI and AsnI that discriminate the four major mtDNA groupings found among trout populations from the
PB River basin. Numbers refer to variable sites reported in
Bernatchez etal. (1992). The presence of a given cut site for a particular mtDNA grouping is indicated by the complete restriction
site recognition sequence. Nucleotides are given when different
from the recognition sequences and identity is indicated by dots
Enzyme
Ah1
(12-13)
AluI
(20)
AGCT
. AT.
. GT .
. . .A
AGCT
AGCT
‘ADl,3,4‘
. . . .G.
. . . .G.
. . . .G.
. . . .G.
.GG.
‘ME1,Z’
ATTAAT
AGCT
. . .A
. . .A
AsnI
(5)
‘AT1,2’
’MA23
MA1
clustered into several distinct groupings. A11 marmoratus
populations formed a distinct cluster, while morphologically identical fario populations did not compose a monophyletic grouping but clustered into three different
branches, reflecting the heterogeneous distribution of all
major mtDNA groupings among these populations. The
curpzo population did not differentiate from fario populations, and clustered with the three furio samples from
Chisone R. (k, 1, m), also characterized by the mixture of
AD and MA genotype groupings.
Discussion
Congruent levels of variation in
protein coding genes and control region
c
b
f
h
inarmoratus
a
a
c
d
0
n
i
fario
i
,
1.0
4
I
0.8
I
I
0.6
/
I
0.4
,
I
0.2
8
I
0
nucleotide divergence ( x 100)
Fig. 5 Population tree (UPGMA) clustering 18 5. tnrltu populations
from the PB River basin according to the distance matrix resulting
from the maximum likelihood estimation of the net average
number of nucleotide substitutions per site among populations
based on the 5‘ end of the control region (310 bp). Letters refer to
populations listed in tabie 1.
Globally, the sequence analysis of coding (n = 610 bp) and
noncoding (n = 640 bp) regions were comparable both in
terms of mtDNA variants detected (8 vs. 11) and in sequence divergence estimates among the variants (mean:
0.93% vs. 1.20%). Congruence in the level of variability
was also found at the interspecific level. The average coding gene sequence divergence estimates between S. truth
and S. sufar (6.17-7.50%) were comparable to those observed for the control region (5.44444%) and almost
identical to those reported by Gyllensten & Wilson (1987)
in an RFLP analysis (6.18452%). However, they contrasted with previous observations for intraspecific variation in mammals reporting that the rate of sequence
divergence in the control region (for the homologous segments analysed in the present study) is about five to 15
times greater than that of the coding gene region (Brown
et ul. 1982).Our results also contrasted with a recent study
of Brown et ul. (1993) which reported that the rate of sequence divergence in the control region of the white stur-
mtDNA SEQUENCE V A R I A T I O N IN Snlrno trutta 169
geon (Aciprnser fransrnontanus)was comparable to that reported for mammals, being four to five times that observed over the entire mtDNA molecule by RFLP study.
As a result, Brown et al. (1993)resolved twice as many variants in the control region analysis a s in the RFLP study
performed on the same individuals. Conversely, Bernatchez & Danzmann (1993) found that the mutation rate
in the control region of brook charr (Saluelinus fontindis,
Salmonidae) was less than twice that observed over the
entire mitochondria1 genome by RFLP analysis, and therefore comparable to that observed in brown trout.
MtDNA variation in the control region of these
salmonids also differed from that observed in mammals
and sturgeon in the type of mutations observed. It has
been generally documented that at the intraspecific level,
there is a strong mutational bias favouring transitional
events that outnumber transversions by a 101 to 30:l ratio
both in the control region (e.g. Aquadro & Greenberg 1983;
Brown et al. 1Y93), and in the protein coding gene regions
(e.g. Beckenbach et al. 1990; Carr & Marshall 1991; Smith &
Patton 1991; Birt-Friesen et al. 1992). Similarly, we observed a strong transitional bias (ratio of 170) in mtDNA
protein coding genes (cytochrome b and ATPase subunit
VI genes) of brown trout. In contrast, ratios of 1 7 6 and 8:3
were observed in the control region of brown trout and
brook charr (Bernatchez & Danzmann 19931, respectively.
Such low ratios of transition/transversion events at the
intraspecific level appears to be very unusual among vertebrates, and to our knowledge have been reported only
for one other vertebrate species (Fajen & Breden 1992).The
ratio of transitional mutations to transversions in the
mtDNA molecule is generally believed to decrease towards higher taxonomic levels because undetectable multiple transitional events at more variable sites accumulate
as a function of time since divergence. For instance, it has
been reported in primates that the ratio may be as high as
321 a t the intraspecific level, decreasing to a ratio of 3:l
between species that diverged 8 millions years ago, and
reaching 1:l when time of divergence exceeds 25 million
years (Brown et nl. 1982). In a sequence analysis of mitochondrial protein coding genes, Thomas & Beckenbach
(1989) documented for Oncorhynchus species (Salmonidae)
a transition: transversion ratio of 12:l at the intraspecific
level, 9:l among the most closely related species, and 5:l
among the most distantly related Pacific trout and salmon.
The same tendency was observed recently in an interspecific comparison of sequence variation of the control
region in Oncorhynchus (Shedlock et al. 1992). In the
present study, we observed comparable transition-transversion ratio for the coding gene (25:ll)and control region
(25:7) segments in interspecific comparison between S.
salar and S. t r u t h Therefore, while the strong transitional
bias (17:O) in the mtDNA protein coding genes of brown
trout was comparable to intraspecific values reported in
other vertebrates, the transiti0n:transvertion ratio (176)
observed in the control region of the same individuals was
closer to those reported for interspecific comparisons. As
was reported in Bernatchez & Danzmann (1993) for S.
fontirmlis, our results suggest fundamental differences in
patterns of mutation in the control region of S. f u u f t u .
Phylogenetic resoliition of coding sequences
A major objective of the present study was to verify the
congruence of mtDNA sequence variation among coding
(cytochrome b and ATPase subunit VI genes) and noncoding (control region) segments in order to re-examine
the phylogenetic relationships among morphologically
distinct trout populations from northern Italy. The analysis of coding gene sequences gave additional support to
the definition of the five phylogenetically distinct mtDNA
trout assemblages previously found among European
trout populations (Bernatchezet al. 1992).It also allowed a
better resolution of branching patterns among mtDNA
groupings, namely in establishing the phylogenetic position of the AT grouping. It is noteworthy that the branching pattern of the AT mtDNA grouping was determined
by identity at four nucleotide positions with S. salar that
differed in all other S. trtifta genotypes. The choice of a distant outgroup may cause apparent reversions of substitutions due to homoplasy which could explain the apparent
homology between S. solar and AT grouping. In such a
case, however, one would expect homoplasic events to be
scattered randomly among different groupings, as was
observed in the control region (Bernatchez et a!. 1992).
Thus, it appears more likely that synplesiomorphy can
better explain the homology between S. salar and the AT
grouping at these nucleotide positions. We can only
speculate at present on the possible explanations for the
retention of ancestral sequence in the AT grouping.
Namely, stochastic lineage extinction could have determined the fixation of this genotypic grouping in early
times of differentiation between S. snlar and S. trutta from a
common ancestor (Avise et al. 1983, 1987; Avise, Neigel &
Arnold 1984).It could also be evidence of a deviation from
the constant rate of molecular evolution (Gillespie 1984,
1986)or of selective processes (MacRae & Anderson 1988).
MtDNA variation among trout populafions
in northern Italy
Our results clearly demonstrated that all martnoratus
populations are monophyletic in origin, and represented a
distinct evolutionary lineage among the brown trout
population complex. Based on sequence divergence estimates, and tentatively applying the '2% sequence divergence per million year molecular clock' (Brown et al. 19791,
rnarrnoratus would appear to have evolved independently
170
E. GIUFFIiA et al.
in the order of 500 000 years. Because there is growing evidence that the mtDNA mutation rate is highly variable
among vertebrates but probably lower in fish than reported for higher vertebrates, we do not consider this
value as absolute but only as a minimal estimate of the
time of divergence for marmoratus. Protein electrophoretic
data also revealed a strong differentiation of this form in
the nuclear genome, and provided more evidence that
marmoratus represents a distinct, monophyletic assemblage (Giuffra et al. 1991; Giuffra 1993).
In contrast, the origin of the phenotypically distinct
carpio population appear much more recent than that of
marmoratus as it was not associated with any phylogenetically distinct branching but composed of mtDNA groupings observed in other phenotypic forms of trout. These
groupings most likely evolved in allopatry during the
Pleistocene glaciations (Bernatchez ef nl. 1992).Their intermixing observed in carpio probably occurred postglacially,
which would support the hypothesis of a recent morphological differentiation of that population (DAncona &
Merlo 1958). Thus, carpio possibly represents another example of rapid morphological radiation among salmonid
fishes during postglacial times (Behnke 1972). The other
extreme of uncoupling between genetic and phenotypic
differentiation was observed in fario, for which morphologically indistinguishable populations were as genetically differentiated as they were from the highly distinct
marmoratus, revealing the presence of the ME (Mediterranean) grouping also in the P6 River basin and a marked
introgression with the MA (marmoratus) grouping in the
Chisone River samples.
The presence of the AT (Atlantic) grouping among
many populations demonstrated that domestic strains
introgressed with all native forms (fario, mnrmoratus,
cnrpzo). Consequently, these results show that the actual
stocking program in northern Italy may significantly alter
the genetic integrity of unique gene pools of trout found in
that region. We are currently examining whether the pattern of genetic variation found in mtDNA of these populations is reflected in nuclear genes.
hardware and software for editing. This work was supported by BRS fundings (Bureau des Ressources Genetiques, France). E. Giuffra was supported by a doctoral
fellowship of the University of Turin (Italy).
References
Aknowledgements
We are indebted toG. Forneris and R. Giannatelli (Dipartimen to di Produzioni Animali, Epidemiologia ed Ecologia,
University of Turin, Italy) for kindly providing us with
most part of samples from the Po R. basin, M. DAccordi
(Museo civic0 di Storia Naturale, Verona, Italy), and M.
Fern (Sezione Caccia e Pesca, Provincia di Modena, Italy).
We also thank J. M. Cornuet (Lab. Biologie et Genetique
Evolutive, Universite days’orsay, France) and P. Boursot
(Lab.Genome et Populations, Universite de Montpellier 11,
France) for technical assistance and helpful comments. P.
Rollino ~ R C A T O Ms.r.l., Genoa, Italy) provided us with
.
Avise JC, Shapira JF, Daniel SW, Aquadro CF, Lansman RA (1983)
Mitochondrial DNA differentiation during the speciation
process inPeromyscus. Molecular Biolosjand Evolution, 1,38-56.
Avise JC, Neigel JE, Arnold J (1984) Demographic influences on
mitochondria1 DNA lineage survivorship in animal popuiations. Journal of Molecular Evolution, 20,99-105.
Avise JC, Arnold J, Ball RM et al. (1987) Intraspecific phylogeography: the mitochondria1 DNA bridge between population genetics and systematics. Annual Reviaus of Ecology and
Systematics, 18,489-522.
Behnke RJ (1968) A new subgenus and species of trout, Salmo
(Platysalmo) platycephalus, from Southcentral Turkey, with
comments on the classification of the subfamily Salmoninae.
Mitt. Hamburg Zool. Museum Institute, 66, 1-15.
Behnke RJ. (1972) The systematics of salrnonid fishes of recently
glaciated lakes. Journal of Fisheries Research Board of Canada, 29,
639-571.
Behnke RJ 11986) Brown trout. Trout, 27,4247.
Bernatchez L, Savard L, Dodson JJ, Pallotta D (1988) Mitochondrial DNA sequence heterogeneity among James-Hudson Bay
anadromous coregonines. Finnish Fisheries Research, 9,17-26.
Bernatchez L, Guyornard R, Bonhomme F (1992) DNA sequence
variation of the mitochondrial control region among gcographically and morphologically remote European brown
trout Salmo trutta populations. Molecular Ecology, 1,161-173.
Bernatchez L, Danzmann RG (1993)Congruence in control-region
sequence and restriction-site variation in mitochondrial DNA
of Brook cham (Salvelinus fontinalis Mitchill). Molecular Biology
and Evolution, 10 (5): 1002-1014.
Brown WM, George Jr. M, Wilson AC (1979) Rapid evolution of
animal mitochondrial DNA. Proceedings of the Nntionai Academy of Sciences ofthe USA, 76,1967-1971.
Brown WM, Prager EM, Wang A, Wilson AC (1982) Mitochondrial DNA sequences of primates: Tempo and mode of evolution. Journal of Molecular Ezrolntion, 18,225-239.
Brown JR, Beckenbach AT, Smith MJ (1993) Intraspecific DNA
sequence variation of the mitochondria1 control region of
white sturgeon (Aciyenser transmontanus). Molecular Biology
and Evolution, 10,326-341.
DAncona U, Merlo S (1958)La speciazione nelle trote italiane ed
in particolare in quelle del Lago di Garda. Atti dell’Istituto
Veneto di Scienze. Lettere ed Arti, Tomo CXVII-CL di Sciolze
matematiche e naturali.
Fajen A, Breden F (1992) Mitochondrial DNA sequence variation
among natural populations of the Trinidad Guppy, Poecilia
reticulata. Evolution, 46, 1457-1465.
Felsenstein J (1993). PHYLIP (Phylogeny inference package) Ver.
of Genetics, SK-50, University o f Washsion 3 . 5 ~Department
ington, Seattle, WA.
Gillespie JH (1984)The molecular clock may be an episodic clock.
Proceedings of fhe National Academy of Sciences of the USA, 81,
8009-8013.
Gillespie JH (1986) Natural selection and the molecular clock.
Molecular Biology nnd Evolution, 3,138-155.
Giuffra E (1993)Genetic identification and phylogeny of hroum trout,
Salmo hutta L., populations of the P6 R. basin. PhD thesis, Uni-
mtDNA SEQUENCE V A R I A T I O N I N Snlmo t r u f t u 171
versity of Turin.
Giuffra E, Guyomard R, Forneris G, Giannatelli R (1991) Electrophoretic variation of brown trout in Northern Italy. Abstracts of
the Symposium on Biochemical Genetics and Taxonomy of Fish.
Queen's University, Belfast: 37.
Guyomard li (1989) Diversit6 genetique d e La truite commune.
Bulletin Franqais de la Pe^cheet de la Pisciculture, 314, 118-135.
Hindar K, Jonsson B, Ryman N, Stdhl G (19911Genetic relationships among landlocked, resident, and anadromous brown
trout, Salmo trutta L. Heredity, 66,83-91.
Kimura M (1980) A simple method for estimating evolutionary
rate of base substitutions through comparative studies of nucleotide sequences. Journal of Molecular Evolution, 16, 111-120.
Kocher TD, Thomas WK, Meyer A et al. (1989) Dynamics of mitochondrial DNA evolution in animals: amplification and sequencing with conserved primers. Proceedings of the National
Academy of Sciences USA, 86,61964200
Lansman RA, Avise JC, Aquadro CF, Shapira JF, Daniel SW (1983)
Extensive genetic variation in mitochondrial DNAs among
geographic populations of the deer mouse, Peromyscus
maniculatus. Evolution, 37, 1-16.
Lelek A (1987) The Freshwater Fishes of Europe, Vol. 9. Threateized
fishes of Europe. European Committee for the Conservation of
Nature and Natural Resources.
MacRae AF, Anderson WW (1988) Evidence for non-neuhality of
mitochondrial DNA haplotypes in Drosophila pseudoobscura.
Genetics, 120, 485-494.
McVeigh HP, Bartlett SE, Davidson WS (1991) Polymerase chain
reaction direct sequence analysis of the cytochrome b gene in
Snlmo salar. Aquaculture, 95,225-233.
Nei M (1987) Molecular Ezvlutionnry Genetics. Columbia University Press, New York.
Paibo S (1990) Amplifying ancient DNA. In: PCR Protocols: a
Guide to Methods and Applications (eds Innis MA, Gelfand DH,
Sninsky JJ, White TJ), pp. 159-166. Academic Press, New York.
Saitou N, Nei M (1987) The neighbor joining method: a new
method for reconstructing phylogenetic trees. Molecular Brology and Euolutioti, 4, 4061125.
Saunders NC, Kessler LC, Avise JC (1986) Genetic varialion and
geographic differentiation in mitochondrial DNA of the horseshoe crab, Litnulus polyphemus. Genetics, 112, 613-627.
Shedlock AM, Parker JD, Crispin DA et al. (1992)Evolutlon of the
salmonid mitochondrial control region. Mdeculur P i r y l o p ~
etics and Ez)ollution,3, 179-1 92.
Skaala 0,Navdal G (1989) Genetic differentiationbetween freshwater resident and anadromous brown trout, Salmo trutta,
within watercourses. journal of Fish Biology, 34, 597-605.
Skaala 0 (1992) Genetic population structure of Norwegian
brown trout. Journal of Fish Biology, 41, 631-646.
Sommani E (1948) Sulla presenza del Salmo fario L. e del S.
marmoratus CUP.nell'Italia settentrionale: lor0 caratteristiche
ecologiche e connsiderazioni relative ai ripopolamenti.
Boiiettino di Pesca, Piscicoliura e Idrobiologia Roma, 3, 136-145.
Sommani E (1961) I1 Saltno marmoratus Cuv.: sua origine e
distribuzione nell'Italia settentrionale. Bollettino di Pescn,
Piscicoltura e Idrobiologia Roma, 36,4047.
Thomas WK, Beckenbach AT (1989) Variation in salmonid mitochondrial DNA: evolutionary constraints and mechanisms of
substitution. Iournal of Molecirlnv Evolution, 29, 233-245.
This study is part of the dissertation work of E. Giuffra on the
phylogenetic analysis of north Italian brown trout populations
based on mitochondrial and nuclear genes data. A major research
interest of L. Bernatchez and R. Guyomard is in using molecular
genetics approaches to study evolutionary processes and population structure in fish. The collaboration of L. Bernatchez to this
study began while he was a postdoctoral fellow in the Laboratoire
Genome et Populations directed by Franqois Bonhomme at
Universite d e Montpellier JI, France.
© Copyright 2026 Paperzz